Uddrag fra JP Morgan:
While most other bank strategists lost their minds, and flip-flopped (and then flipped again) from bullish to bearish and then again bullish again throughout 2025 always after the fact, and cost their clients substantial alpha as they reacted to events instead of predicting what will happen, one trading desk that was once (again) surprisingly accurate in its market calls, was JPMorgan’s Market Intel team, which for the 3rd year in a row was stubbornly bullish and right, turning bearish (correctly) just once ahead of the Liberation Day meltdown, then flipping bullish again as the market bottomed.
Which is why we were not surprised to read that, in its first note of 2025, the JPM Market Intel team led by Andrew Tyler announced that it is yet again Tactically Bullish, even as it lays out both the bullish and bearish cases.
Below we excerpt from the full must-read note, available to pro subs in the usual place.
The S&P closed 2025 with a 16.4% gain, its 3 consecutive annual double digit gain. Nasdaq added 20.2% and Russell 2000 rose 11.3%, and yet the major American indices lagged many of their international counterparts as we see the broadening of the rally away from US Tech pushing investors outside the country as the US depreciation aided the ex-US bull case, a phenomenon which JPM believes is poised to continue in 2026 Q1.
As Andrew Tyler writes, “we begin the year Tactically Bullish” and reviews the Bull and Bear cases. We excerpt the key sections below (full note available here)
I. REVIEWING THE BULL CASE
MACRO FUNDAMENTALS – During this current bull run, our framework has focused on (i) a good and getting back better picture, (ii) robust earnings growth, and (iii) a thawing trade war. We review those parts of the hypothesis while also looking at some market technicals.
CONSUMER – In our most recent Consumer Cash Pile note, we find that the top 4 income quintiles have more cash relative to YE2019 on an inflation adjusted basis. This follows ~52% increase in household net worth since 2019 Q4, or +$57T. Checking accounts have increased from $1.53T to $5.42T from 2019Q4 to 2025Q2; the pre-COVID high watermark was below $1.7T.

This has increased the rate of consumption, proxied by Retail Sales. In 2014, Retail Sales averaged $420bn/month increasing to $495bn/month in 2019 and to $689bn in 2024. The CAGR from 2014 – 2019 was 3.4% and from 2019 – 2024 was 6.8%. In 2025, we have averaged $713bn/month. This elevated spending is the primary driver behind the above-trend real GDP growth witnesses over the last 3 years. Further, Bank of America card data shows that October combined credit and debit card spending was +2.4% YoY, per household, the strongest annual growth since 2024 Q1.

On a monthly basis, the increase was +0.3% MoM, the fifth consecutive monthly gain, mostly via Services. Higher-income household spending was +2.7% YoY following +3.7% YoY after-tax wage growth and lower-income household spending was +0.7% YoY following +1.0% YoY after-tax wage growth. Chase card data was +0.51% MoM for October, +0.40% MoM for November, and was +3.9% YoY.

LABOR MARKET – Abiel Reinhart gave a late 2025 assessment:
- WHAT LOOKS BETTER – the ‘labor market differential’ improved MoM pointing to stability in the unemployment rate.
- WHAT LOOKS THE SAME – initial jobless claims have oscillated around a stable trend line; however, continuing claims look worse with no slowing of the pace of YoY increases pointing to a gradual increase in unemployment. Also, PMIs have traded in a tight range over the last 6 months.
- WHAT LOOKS WORSE – Job openings data continues to decline, while ISM / PMI data keep weakening, albeit at a gradual pace. Plus, Beige Book points to a softer labor market though overall economic activity is unchanged.
CORPORATE SECTOR – For publicly traded companies, fundamentals have come off a bit from all-time strength witnessed in 2021 – 2023 but they have yet to return to pre-COVID levels. Revenue and EBITDA have expanded for 8 consecutive quarters, including the highest margin in two years; debt increased the most in 3.5 years. More than 20% of HY market cap has been upgraded to IG since Jan 2022 and what remains has a default rate of ~1.8% [FY2026 forecast] vs. 3.4% is the 25-year average. For Leveraged Loans, the default is 3.33% vs. 3.1% 25-year average. Post-GFC, the default rate for HY and Leveraged Loans is 2.5% and 2.4%, respectively. Nelson Jantzen forecasts 2026 to look similar to 2025 in its default characteristics with HY defaults below long-term/post-GFC levels and Leveraged Loans aligned with historical averages. For non-public businesses, we track bankruptcies which would double count public businesses but 25Q2 saw 23,043 companies file for bankruptcy, down from 23,309 in 25Q1. The quarterly average from 1980 – 2024 was 40,563 per Trading Economics. The record low was 12,748 in 22Q2 and the record high is 82,446 in 1987Q4. Overall, the US corporate sector can be characterized as normalizing to pre-COVID trends and not deteriorating beyond those pre-COVID trends. This means that businesses can likely absorb another inflation peak and / or near-term slowing, e.g., technical recession.
EARNINGS OUTLOOK (FactSet) – Q4 2025 is expected to see 7.6% revenue growth, 8.3% EPS growth, with 12.8% profit margins. This compares to Q3 2025 numbers of 8.5% (revenue), 13.6% (EPS), and 13.1% (margin). The 5-year averages are 8.0% (revenue), 14.9% (EPS), and 12.1% (margin). For FY2025, it is expected to see 7.0% revenue growth and 12.3% EPS growth.
- FY2026 EARNINGS PREVIEW – For FY2026, FactSet see 7.2% revenue growth, 15.0% EPS growth, with 13.9% net profit margin.


TRADE WAR IMPROVEMENTS – The trend throughout 2025 was both a lower effective and realized tariff rate. The major trade-related catalysts will be stronger US / China deal which appears to be chips for rare earths and USMCA renegotiations where the US will look to hold discussions with Canada and Mexico separately. Given the Nov / Dec election outcomes, the Administration is attacking the affordability issue so we may see tariff rates move lower in 2026, even if temporary.

US MARKET INTEL SCOTUS SCENARIO ANALYSIS – the P(Tariffs Upheld) is sourced from Polymarket as of Jan 2, 2026. The balance of the probabilities are Market Intelligence estimates.
- TARIFF STRUCK DOWN AND IMMEDIATELY REPLACED – [64%] this is the base case per comments from both Trump and Bessent. This outcome seems like a Time Value of Money problem where cash flows in year 0 increase by the amount of the tariffs though that money will likely need to be recouped via lawsuit. Future realized effective tariff rates should remain similar to what was paid in 2025. Look for the SPX to rise on the announcement, 0.75% – 1% on the same-day, and then for investors to fade the move as the Administration replaces emergency tariffs. SPX closes up 10-20bps.
- Bessent says Trump admin will be able to replicate tariffs even if it loses Supreme Court decision (CNBC)
- TARIFFS UPHELD – [26%] this status quo outcome may see bigger moves in the yield curve than with Equities, given how much the yield curve appears to have adjusted to a SCOTUS that strikes down tariffs. Look for the SPX to decline 30bp – 50bp same day.
- TARIFFS STRUCK DOWN AND REPLACED AFTER MID-TERMS – [9%] the most bullish outcome as this assists the Fed’s tariff-induced inflation headwind, gives small businesses temporary relief but increases uncertainty unless there is a specific announcement on timing. Assuming the Administration is transparent on timing, look for the SPX to rise 1.25% – 1.5% on the day with RTY significantly outperforming.
- TARIFFS STRUCK DOWN AND NO REPLACEMENT – [1%] this would be the most bullish outcome for stocks but make see the recent yield curve steepening continue, more aggressively; so, there may be Rates Vol-induced limits on the Equity move. Speaking to our colleague Mark Whitworth, he highlights that some of our Rate clients think this outcome would push Trump to an incrementally more dovish Fed candidate (view is that the candidate is announced post-SCOTUS ruling). This would twist the yield curve steeper with the back-end selling off on higher inflation expectations. SPX rises 1.5% – 2% on the day, again with RTY outperforming.
TECHNICALS – The macro fundamentals remain intact from a bullish perspective but there are ancillary tailwinds from the technical backdrop.
BUYBACKS – Dubravko sees buybacks printing ~$1T in FY26, down 9% YoY, as he flags the record among of announced but not yet executed buybacks. In FY25, buybacks were primarily funded by cash (~86% of all buybacks) but that may shift toward using debt-funded buybacks in FY26. Lastly, Dubravko mentions that both buybacks and Retail investors are agnostic to valuation but do react to price declines, i.e., dip buyers (full note is here).

POSITIONING – The most recent update from Positioning Intel on Dec 18 is here. The overall message is one of cautious optimism as the team tells us that, “[The] medium-term trends remain positive, which has been supportive of further equity gains …”. The Tactical Positioning Monitor was 68th percentile since 2015, as of the Dec 18 publication, which has led to a +14% average gain in years that followed positive positioning conditions which trended
higher into year-end. The team flags risks from AI, negative mid-term election seasonality, Momentum factor, high HF leverage, and increasing margin debt levels.
RETAIL INVESTORS – 2025 was a record year for the Retail Investor, with flows ~1.9x the five-year average, +53% YoY, and +14% above 2021 levels. Retail investors have averaged ~$6.3bn/week in flows in 2025, or ~$325bn. He identifies 3 trends:
- (i) buy-the-dip mentality;
- (ii) a shift from single stocks to ETFs / Macro trading, which became more pronounced May – Dec; and,
- (iii) AI purchases were funded with SPX470.

SOURCE OF NEW DEMAND FOR US EQUITIES – the Chinese Retail Investor. South China Morning Post reports that Chinese households have a record amount of savings ¥163T, or $23.3T. These investors can access US markets via qualified domestic institutional investor (QDII) programs; currently the combined quota is $94.3bn. For reference, US Retail Investors had ~$325bn in inflows in FY25. As China moves to improve the household balance sheets, it may choose to expand these quotas to take advantage of foreign markets, increasing.
II. REVIEWING THE BEAR CASE
AI TRADE:
- (i) In 2025, some of the debate on AI focused on valuation, revenue circularity, and to a certain extent the ability to deliver on signed contracts. As we move to 2026, does the debate center on whether AI works as intended, e.g., something akin to a science fiction film where a human-like interface with matching cognitive abilities can drive innovation and thus revenue? If the answer is No that AI cannot deliver positive ROI, then do we see a pullback on capex spend in 2026 and beyond and does that trigger an exodus similar to the late Oct / Nov pullback witnessed last year? One potential warning sign is the Anthropic / Accenture deal to identify and drive business adoption of AI. Recent client discussions reveal a desire to see more than cost cutting initiatives borne from AI solutions. If the market forces companies to reduce AI spend unless companies can prove improved value via revenue, then we may see the ‘AI Exhaustion’ theme resurface.
- (ii) Next, the competitive threat from China / Open Source methods may trigger another ‘DeepSeek Monday’ type of event or a more durable headwind to the theme.
- (iii) Lastly, energy prices in a price sensitive political environment may create an additional bottleneck.
PULLBACK PERFORMANCE: From Oct 29 to Nov 20, the NDX fell 7.9% with Mag7 -9.9% (JP1BMAG7 Index), AI TMT (JPAITMT Index) -12.8%, AI ex-TMT (JPAIXTMT Index) -5.8%, AI Capex (JPAICAPX Index) -14.9%, and Debt-driven AI (JPAIDEBT Index) -19.5%. Mag7 names make up 34.8% of the SPX and Mag10 (Mag7 plus AMD, AVGO, and LTR) comprise 38.9% of the SPX, so any bear market begins with these names experiencing a material decline.
- Anthropic and Accenture Strike AI Deal Targeting Business Clients (WSJ)
- Bernie Sanders and Ron DeSantis speak out against data center boom. It’s a bad sign for AI industry (CNBC)
- CoreWeave’s Staggering Fall From Market Grace Highlights AI Bubble Fears (WSJ)
- Microsoft Slips on Report of Lower Demand for Some AI Tools (BBG)
- Oracle Delays Some Data Center Projects for OpenAI to 2028 (BBG)
- Rise of China’s open source platforms will burst AI bubble (SCMP)


FED : One of the biggest threats to the market is a loss of Fed independence, or perceived loss of independence, so the Jan 21 SCOTUS hearing on whether Trump can fired the Fed’s Cook is critical. It is possible that if the SCOTUS allows Trump to fire her; if so, we think the market reaction will be similar to the ‘Liberation Day’ reaction where the SPX fell 10.8% in two days. In this case, it is unclear what a Trump pivot would look like in this scenario, nor how it would be received by the market, given his recent selection of Fed Chair candidates. Alternatively, Powell may choose to stay on after his Chairmanship ends, since we could remain a governor until 2028. Should we chose to remain on staff, that would likely calm some fears surrounding the Fed’s independence.
- Bank of America CEO says the market “will punish people if we don’t have an independent Fed” (CBS News)
- Will he stay or will he go? Powell is not saying whether he’ll stay on Fed board when chair term ends (CNBC)
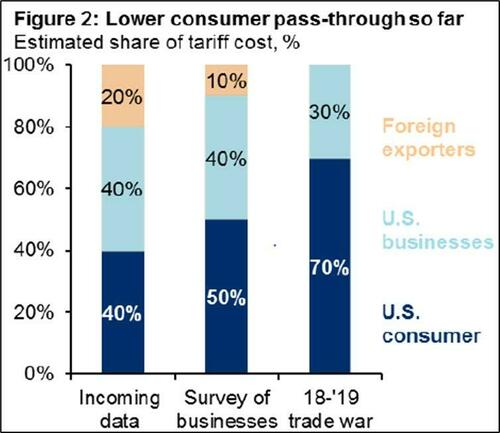
INFLATION: Focusing on tariff-induced inflation, the story is multifaceted and the delays to trade negotiations have delayed the full impact of tariffs to the global economy. First, there was a demand pull -forward dating to October 2024 and additional demand spikes for goods just before Trump was inaugurated in January 2025 and again after the extension from ‘Liberation Day’ tariffs were extended again before the June 2025 deadline. This inventory build has to be extinguished before businesses replace at higher prices, which can them be passed along to consumers. Second, we are seeing a lower B2C pass-through rate in Trade War 2.0 relative to 1.0 which likely is a combination of concerns on legacy, cumulative tariffs, and the health of the consumer. If our view on the consumer plays out, then it is reasonable to expect a higher tariff pass-through percentage as we enter 2026, and beyond. Third, keep an eye on how Congress solves ACA (aka Obamacare) with premiums set to rise this is another driver of core inflation. Lastly, “demand-pull’ inflation from higher tax returns and other features of OBBBA may firm inflation.

MACRO DETERIORATION: Stagflation may be the biggest risk for 2026 which could be triggered by (i) an increase in unemployment combined with (ii) a stock market decline that curtails spending in the top two income deciles.
- UNEMPLOYMENT: Commentary from ISM/PMI and earnings releases point to a continued increase in input costs with companies largely delaying decisions to increase prices due to concerns on the consumer and economy. If companies are unable to pass along those costs, then margin compression generally leads to layoffs. Currently, this is more likely to occur in non-public businesses. If we see the unemployment rate (U.3) accelerate to / through 5%, then this becomes a red flag.
- STOCK MARKET DECLINE: Bloomberg identified the top income decile is now nearly 50% of total US consumption. This is a group that has benefitted from asset appreciation since peak-COVID. It is thought that the ‘wealth effect’ from asset appreciation is driving elevated consumption levels so the risk to US growth is a significant decline in US asset prices, where a 10-20% decline in stock indices is more likely than a housing crash triggering similar price declines. Further, Bloomberg states that the bottom 80% of the income distribution are seeing wages gains that are keeping pace with inflation so another inflation peak would drive further downward pressure on consumption.
- It’s getting harder to separate the stock market from the economy. That means the Fed and Congress have more incentive to help Wall Street (Fortune)
- “Today, every 1% increase in stock wealth translates to a 0.05% uptick in consumer spending …”
- The sudden increase in the wealth effect and its impact on spending (Visa)
- “… for every $1 increase in household wealth, consumer spending increased by 9 cents. Over the last few years, however, something changed dramatically. Using data through the third quarter of 2022, we find that the wealth effect has increased to 34 cents, almost quadruple the pre-pandemic average.”
- It’s getting harder to separate the stock market from the economy. That means the Fed and Congress have more incentive to help Wall Street (Fortune)


ROTATION AWAY FROM THE US: In H1 2025, the DXY fell 11% helping fuel global ex-US outperformance. While the SPX and NDX added 3.8% and 5.2% respectively, APAC (MXAP Index) was +12.2%, Latam (MXLA) +24.4%, and EM (MXEA) +16.4%, all returns expressed in USD. The USD is expected to see a decline in FY26 while ROW growth and earnings are expected to close to the gap to the US, do we see a continuation of US underperformance? The key is the US Tech sector as if we see a broader rally in the US with Tech performing in line with the SPX or with a slight lag,
then investors are more likely to look ex-US for returns.
* * *
Finally, here is the JPMorgan preferred monetization menu:
- We like TMT as a core holding, including Mag7, Semis, China Tech, and AI plays. For AI, we like the Core AI and TMT-focused AI baskets (JPAICORE Index and JPAITMT Index); though we would holder a lower the allocation relative to the balance of Tech.
- The US / Global Growth Reboot remains attractive and like holding a combination of Airlines (JP2AIR Index), Cyclicals (JPACYCL Index), Financials (both KRE and XLF), and Transports ex-Airlines (JP1BTXA Index). The RTY is another beneficiary of this theme.
- International plays are likely to perform at least in line with the SPX and we like China, Japan, and South Korea within APAC, broader Latam including Brazil.
- Debasement – this theme was very profitable in 2025 and think that trend continue in the very near-term as geopolitical turmoil renews interest. Within this theme we like gold, silver and their associated miners (GLD, SLV, GDX, SILJ, and XME).