
Fra Advisorsperspektives:
Today’s release of the publicly available data from ECRI puts its Weekly Leading Index (WLI) at 143.9, down from the previous week. Year-over-year the four-week moving average of the indicator is now at 4.36%, down from 4.63% last week. The WLI Growth indicator is now at 1.9, also down from the previous week.
“Finding the Root Cause of Recessions”
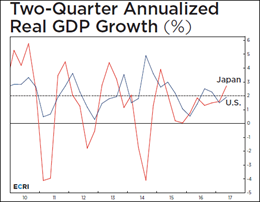
ECRI’s latest headline article digs into the causes of recent recessions after the 2008 financial crisis. Specifically, comparisons are made between US and Japanese economic growth, economic vulnerability, and exogenous shocks. ECRI concludes that while US GDP has been extremely low since the Great Recession, no recession has occurred due to a lack of exogenous events. Read more
The ECRI Indicator Year-over-Year
Below is a chart of ECRI’s smoothed year-over-year percent change since 2000 of their weekly leading index. The latest level is above where it was at the start of the last recession.

RecessionAlert has launched an alternative to ECRI’s WLIg, the Weekly Leading Economic Indicator (WLEI), which uses 50 different time series from various categories, including the Corporate Bond Composite, Treasury Bond Composite, Stock Market Composite, Labor Market Composite, and Credit Market Composite. An interesting point to notice — back in 2011, ECRI made an erroneous recession call, while the WLEI did not trigger such a premature call. However, both indicators are now generally in agreement and moving in the same direction.

Appendix: A Closer Look at the ECRI Index
The first chart below shows the history of the Weekly Leading Index and highlights its current level.

For a better understanding of the relationship of the WLI level to recessions, the next chart shows the data series in terms of the percent-off the previous peak. In other words, new weekly highs register at 100%, with subsequent declines plotted accordingly.

As the chart above illustrates, only once has a recession ended without the index level achieving a new high — the two recessions, commonly referred to as a “double-dip,” in the early 1980s. We’ve exceeded the previously longest stretch between highs, which was from February 1973 to April 1978. But the index level rose steadily from the trough at the end of the 1973-1975 recession to reach its new high in 1978. The pattern in ECRI’s indictor is quite different, and this has no doubt been a key factor in their business cycle analysis.
The best known of ECRI’s indexes is their growth calculation on the WLI. For a close look at this index in recent months, here’s a snapshot of the data since 2000.

Now let’s step back and examine the complete series available to the public, which dates from 1967. ECRI’s WLIg metric has had a respectable record for forecasting recessions and rebounds therefrom. The next chart shows the correlation between the WLI, GDP, and recessions.

Year-over-Year Growth in the WLI
Here is a snapshot of the year-over-year growth of the WLI rather than ECRI’s previously favored method of calculating the WLIg series from the underlying WLI (see the endnote below). Specifically, the chart immediately below is the year-over-year change in the 4-week moving average of the WLI. The red dots highlight the YoY value for the month when recessions began.

The WLI YoY has been in positive territory for over 52 weeks and is now at 4.36%, down from 4.63% last week. The latest level is higher than at the start of all of the last seven recessions.
Note: How to Calculate the Growth series from the Weekly Leading Index
ECRI’s weekly Excel spreadsheet includes the WLI and the Growth series, but the latter is a series of values without the underlying calculations. After a collaborative effort by Franz Lischka, Georg Vrba, Dwaine van Vuuren and Kishor Bhatia to model the calculation, Georg discovered the actual formula in a 1999 article published by Anirvan Banerji, the Chief Research Officer at ECRI: ” The three Ps: simple tools for monitoring economic cycles – pronounced, pervasive and persistent economic indicators.”


