Uddrag fra
Regardless of these valuation, concentration, and contrarian indicator signals, an incredible
stretch of time has passed absent a one-day, 2% decline (or more). The last 2% day was
over 270 trading days ago, a stretch of time not seen since February 2018 (Exhibit 3B).
Exhibit 3: Is this Bull in a Bubble in Need of a Reset?
3A) Concentration is a Concern, Earnings and Profitability have Followed
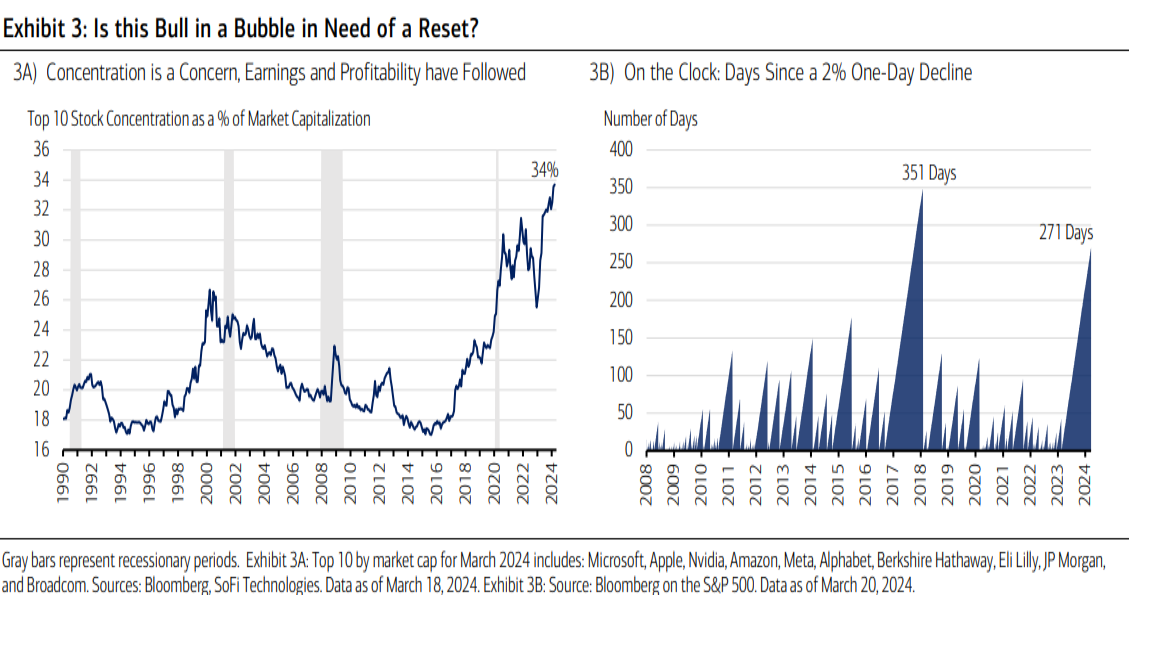
3B) On the Clock: Days Since a 2% One-Day Decline
Gray bars represent recessionary periods. Exhibit 3A: Top 10 by market cap for March 2024 includes: Microsoft, Apple, Nvidia, Amazon, Meta, Alphabet, Berkshire Hathaway, Eli Lilly, JP Morgan,
and Broadcom. Sources: Bloomberg, SoFi Technologies. Data as of March 18, 2024. Exhibit 3B: Source: Bloomberg on the S&P 500. Data as of March 20, 2024.
While not a predictive indicator of what’s ahead, we wouldn’t be surprised to see a healthy,
corrective pullback considering that volatility is a feature of all markets. On average, the
S&P 500 experiences three 5% pullbacks a year and one 10% correction. As for the
investment implications of all this, supposing the supports behind the rally remain largely
in place, we’d not only stay invested at these levels, but further allocate into risk assets.