Uddrag fra Zerohedge:
One month ago, we said that when Morgan Stanley’s chief equity strategist Michael Wilson hiked his year-end price target from 3,900 to 4,000, he did so very “reluctantly“, as if someone was tapping on his shoulder with an Uzi, because while the note was supposed to be cheerful and rosy, all Wilson could talk about was the downside scenario which included all the usual sorts of fire and brimstone.
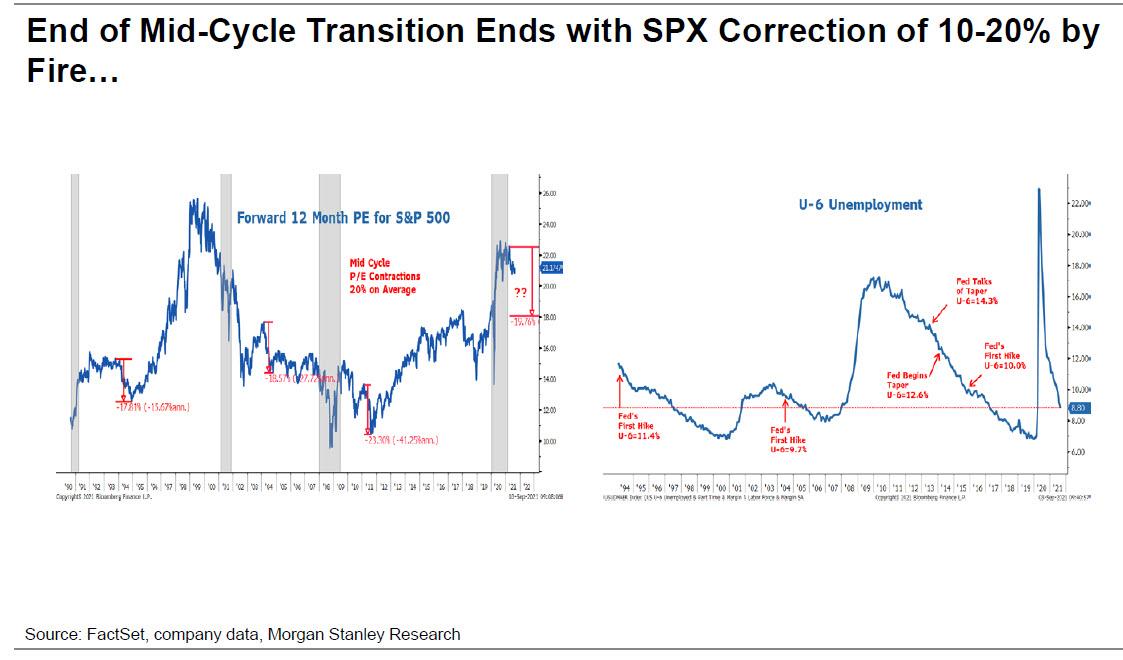
Well, fast forward to today when suddenly global markets are writing under the throes of Evergrande contagion sending spoos sharply below their 50DMA critical support level, and when early this morning, Michael Wilson is back in his prime as Wall Street’s biggest bear, going back to his core thesis that the current Mid-cycle transition will end in either “Fire”, i.e. a sharp market correction…
… or “Ice”, with consumer spending grinding to a halt…
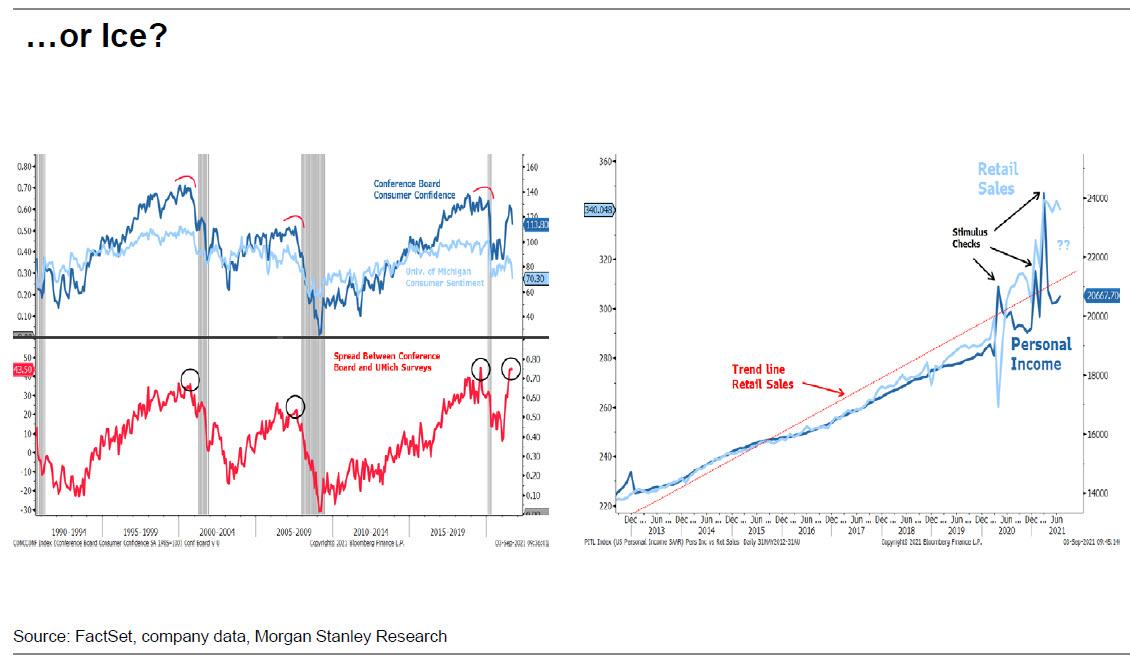
… and observes that “the ice scenario would be worse for markets and we are leaning in that direction given the fall in consumer confidence and reset lower in PMIs we expect.”
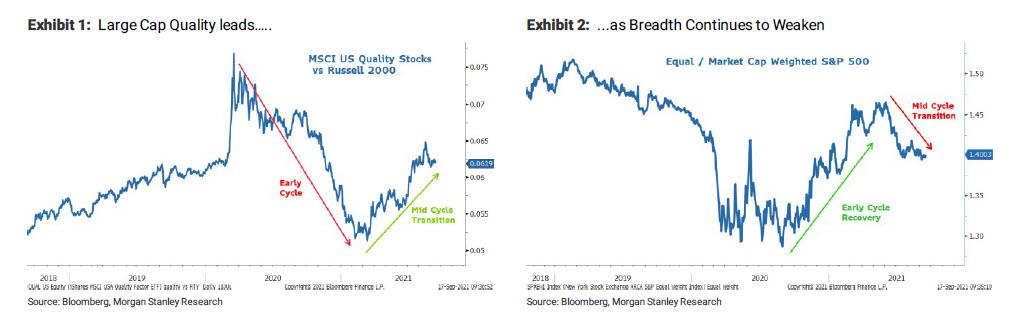
Backing up a bit, for those unaware, since March, Wilson had been espoused a mid-cycle transition narrative for US Equity markets, which he says has played out to script for the most part, with large-cap quality outperforming while the average stock has materially underperformed the S&P 500, the exact opposite of what occurred during the early cycle phase of recovery.
Relieved that he no longer has to hide his bearish views behind a facade of cheerful optimism (observed most recently during his August S&P target hike), Wilson than mocks the “many commentators and clients” who continue to point to the S&P 500 near all-time highs as a leading indicator and rationale for even higher prices ahead, and cautions that in his view, “the relative strength of the S&P 500 and Nasdaq 100 is further confirmation that the market understands the mid-cycle transition narrative and has bought into it hook, line and sinker. After all, the S&P 500 is the highest quality large cap index in the world. In short, it should be outperforming right now.”
The question, as Wilson puts it, whether the mid-cycle transition will end with a correction in this index as it typically does, or whether it’s different this time? His prediction: “With our year end target 10% below current levels, our view is clear: the mid-cycle transition will end with the rolling correction finally hitting the S&P 500.”
And so, for the benefit incredulous bulls who can’t believe all the red they are seeing this morning, Wilson explains that “the mid-cycle transition will end with the rolling correction finally hitting the S&P 500.” He then reminds MS clients that he has laid out two near-term risk paths that could lead to this outcome: “fire” (the Fed begins to remove monetary accommodation in response to an overheating economy) and “ice” (earnings revisions and higher frequency macro data points decelerate amid demand pull forward, supply chain issues and margin pressure).”
And while in his weekly note he dives deeper into both of these paths and points “to accelerating risks on both the policy and growth fronts” the emphasis is on the “Ice” scenario which could result in “a mode destructive outcome, i.e., a 20%+ correction.” Here’s why:
The typical mid-cycle “fire” outcome would lead to a modest and healthy 10% correction in the S&P 500. However, the “ice” scenario is starting to look more likely, and could result in a more destructive outcome – i.e. a 20%+ correction. As a result, we continue to recommend a barbell of more defensively oriented quality (Healthcare and Staples) to protect from the “ice” scenario while keeping a leg in Financials to participate in the “fire” outcome as higher rates materialize.
The next question is what would catalyze the upcoming correction, whether it is the 10% “fire” or 20% “ice” drop. Wilson responds:
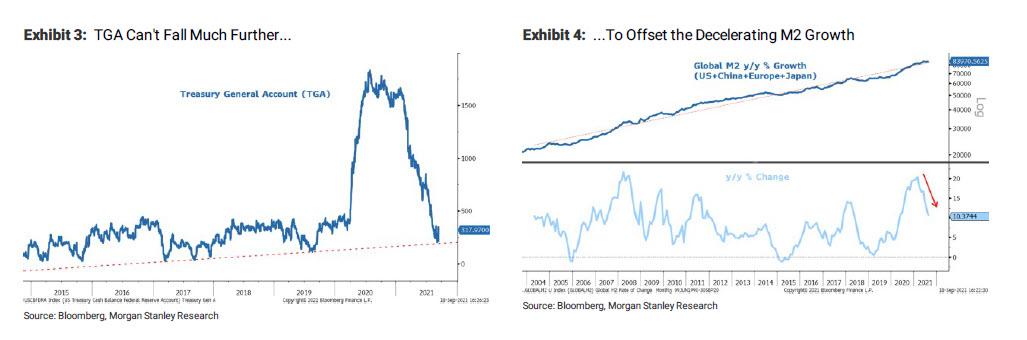
We have presented two potential scenarios for why / how the correction will ensue. The more traditional ending to a mid-cycle transition is a “fire” outcome whereby the recovery overheats and the Fed begins to remove accommodation. In the 1994 and 2004 transitions, that meant raising the Fed Funds Rate. In 2011, it was simply the ending of QE2. This time we think it is the tapering of asset purchases later this year/early next year. Given that the taper was effectively pre-announced at Jackson Hole 3 weeks ago, is it a coincidence that equity markets have been softer in September? Under this scenario, the economy reaccelerates from the summer slowdown but not enough to offset the tightening of financial conditions from higher back end rates and less liquidity in the system. In addition to the anticipated tapering of asset purchases later this year, we point to the fact that the Treasury’s General Account (TGA) has fallen by $1T since March (Exhibit 3).
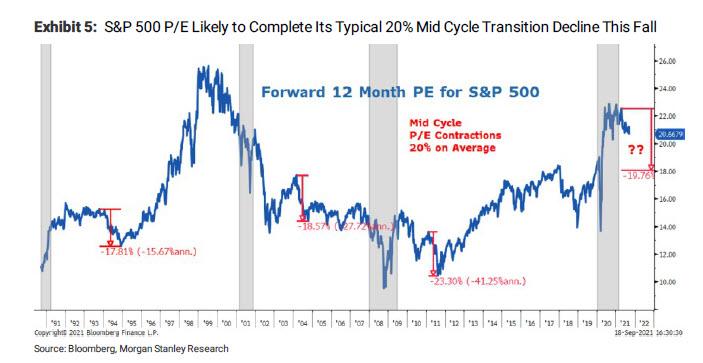
While this has been a good offset to the decelerating M2 growth (Exhibit 4), that offset is probably finished now. Bottom line, this is the time of the mid cycle transition when P/Es for the broader index properly contract (Exhibit 5).
Piling on the pessimism, Wilson then notes that “there are several key variables we are monitoring that currently support a view for a worse than expected growth deceleration.”
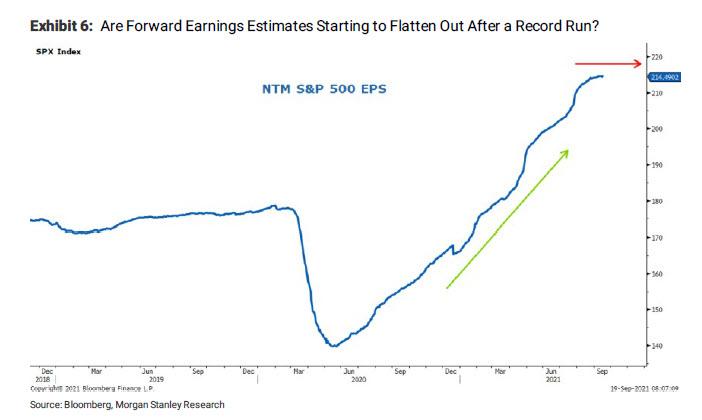
- First is NTM earnings estimates. Even if the economy rebounds in 4Q from the slowdown this summer, it likely won’t translate into higher earnings estimates as incremental margins rollover due to higher costs and taxes. This is the mirror image of the past year when costs were being eliminated as revenues benefitted greatly from the fiscal stimulus. Indeed, NTM EPS estimates for the S&P 500 appear to have been flattening out over the past month after a record recovery to levels that are 20% above the prior peak (Exhibit 6). This will be critical to watch as we enter 3Q earnings season and companies update investors on costs/margins and potential payback in demand from the consumption binge earlier this year.
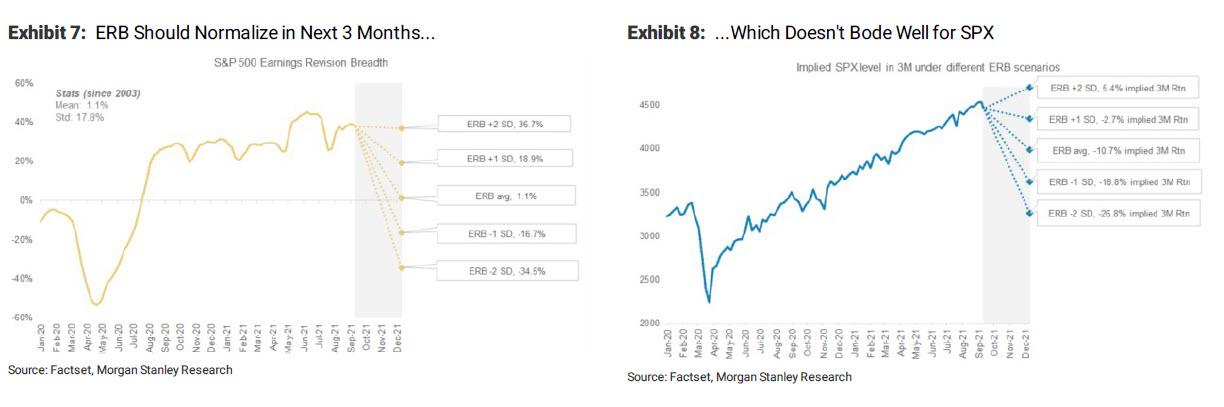
Another way to analyze this rate of change on earnings momentum is to look at earnings revision breadth (or ERB), which Wilson thinks is vulnerable to a simple reversion to the mean from today’s very elevated levels of +2 standard deviations (Exhibit 7). If earnings revision breadth (ERB) normalizes to its average over the next 3 months, the S&P should fall approximately 11%. If the ERB falls toward 1 standard deviation below average, the S&P 500 should fall 19%, and at -2 standard deviations, the S&P 500 falls 27% (Exhibit 8).
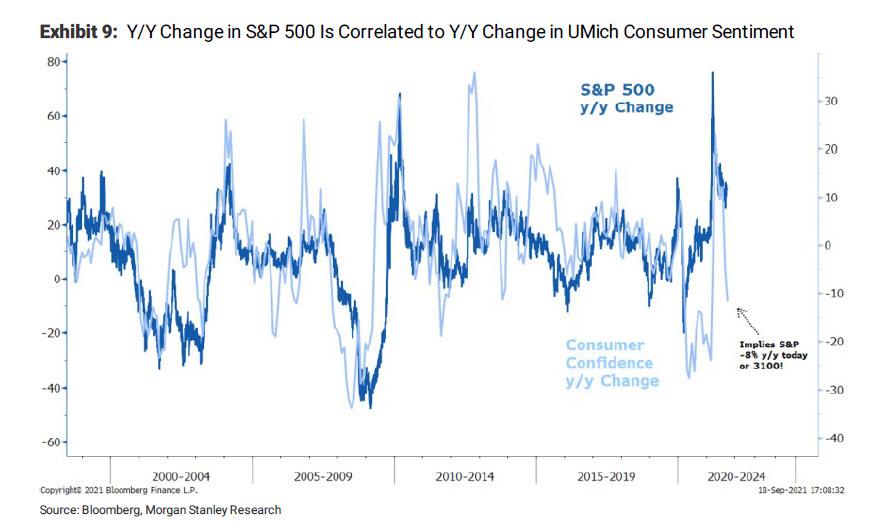
- Second, and as discussed here most recently on Friday, consumer confidence has recently fallen sharply. It started with the University of Michigan survey plummeting in August to lower levels than we witnessed during the entire pandemic and recession last year. While the Conference Board Consumer Confidence Survey remained elevated in July, it saw a big catch up to the downside in August as well. According to Wilson, these surveys are important variables because they have strong positive correlations to the y/y change in the S&P 500. In other words, based on the UMich survey, the S&P 500 appears vulnerable to at least a 10-20% correction if the survey doesn’t improve next month.
Here, Morgan Stanley’s view is that “consumers aren’t as naïve as they are often made out to be. They know the last year has been a bit of a bonanza working from home while receiving stimulus checks from the government that many didn’t need (85% of all Americans received stimulus checks).” Meanwhile, prices of everything are up a lot just as the extra money has stopped going out. That’s a bad combo for sentiment and supports not only our stagflation thesis, but also Morgan Stanley’s expectation of payback in demand view and underweight on Consumer Discretionary stocks, particularly goods-related ones.
Finally, while Wilson concedes that many businesses have done extremely well during the pandemic, “the trends here are also likely to subside” and the best way to gauge the fadiing momentum in businesses will come from the Purchasing Manager Surveys. While earlier this year we reached record highs in many of the subcomponents, much like economic surprise indices and earnings revision breadth measures, the PMIs are mean reverting. Indeed, as Wilson – who used PMI data to cement his mid-cycle thesis – the peak rate of change was in April just as the PMIs peaked as well. Most importantly, as we observed previously, the prices paid component (inverted) leads the headline by approximately 12 months and suggests the decline in the PMIs will likely be worse than typically witnessed during the mid-cycle transition phase – i.e., back toward 50, if not lower (Exhibit 10). This, as Morgan Stanley points out, would imply the Headline PMI is down 10-20% y/y by December: “Given a tight relationship with the y/y change in the S&P 500, the implication is that the S&P could see at least a 10-20% decline over the next 3 months (Exhibit 11).”

Bottom line according to Wilson, the typical “fire” outcome would lead to a modest and healthy 10% correction in the S&P 500, but “the “ice” scenario is starting to look more likely, in our opinion, and could result in a more destructive and unexpected outcome.” As a result, we continue to recommend a barbell of more defensively oriented quality (Healthcare and Staples) to protect from the “ice” scenario while keeping a leg in Financials to participate in the “fire” outcome should higher rates materialize.