Nordea har analyseret udviklingen af den norske krone, der er faldet kraftigt de seneste måneder til omkring 10,30 kr. over for euroen. Nordea tror, at bunden er nået – for denne gang. Olieprisen har stor betydning for kronen, og da Nordea mener, at olieprisen snarere bevæger sig nedad end opad, kan det føre til en styrket krone.
NOK has reached the peak for now
The NOK rally continued last week, but we believe that NOK has reached the peak for now. Further downside in EURNOK is probably very limited in the near term. In our opinion, the cross is more likely to move up than further down in the near term.
The NOK rally continued last week and EURNOK fell below 10.30 for the first time since February 2020. But we believe that NOK has reached the peak for now and further downside in EURNOK is probably very limited in the near term. In our opinion, the cross is more likely to move up than further down in the near term. Levels on the upside to watch are 10.50/60.
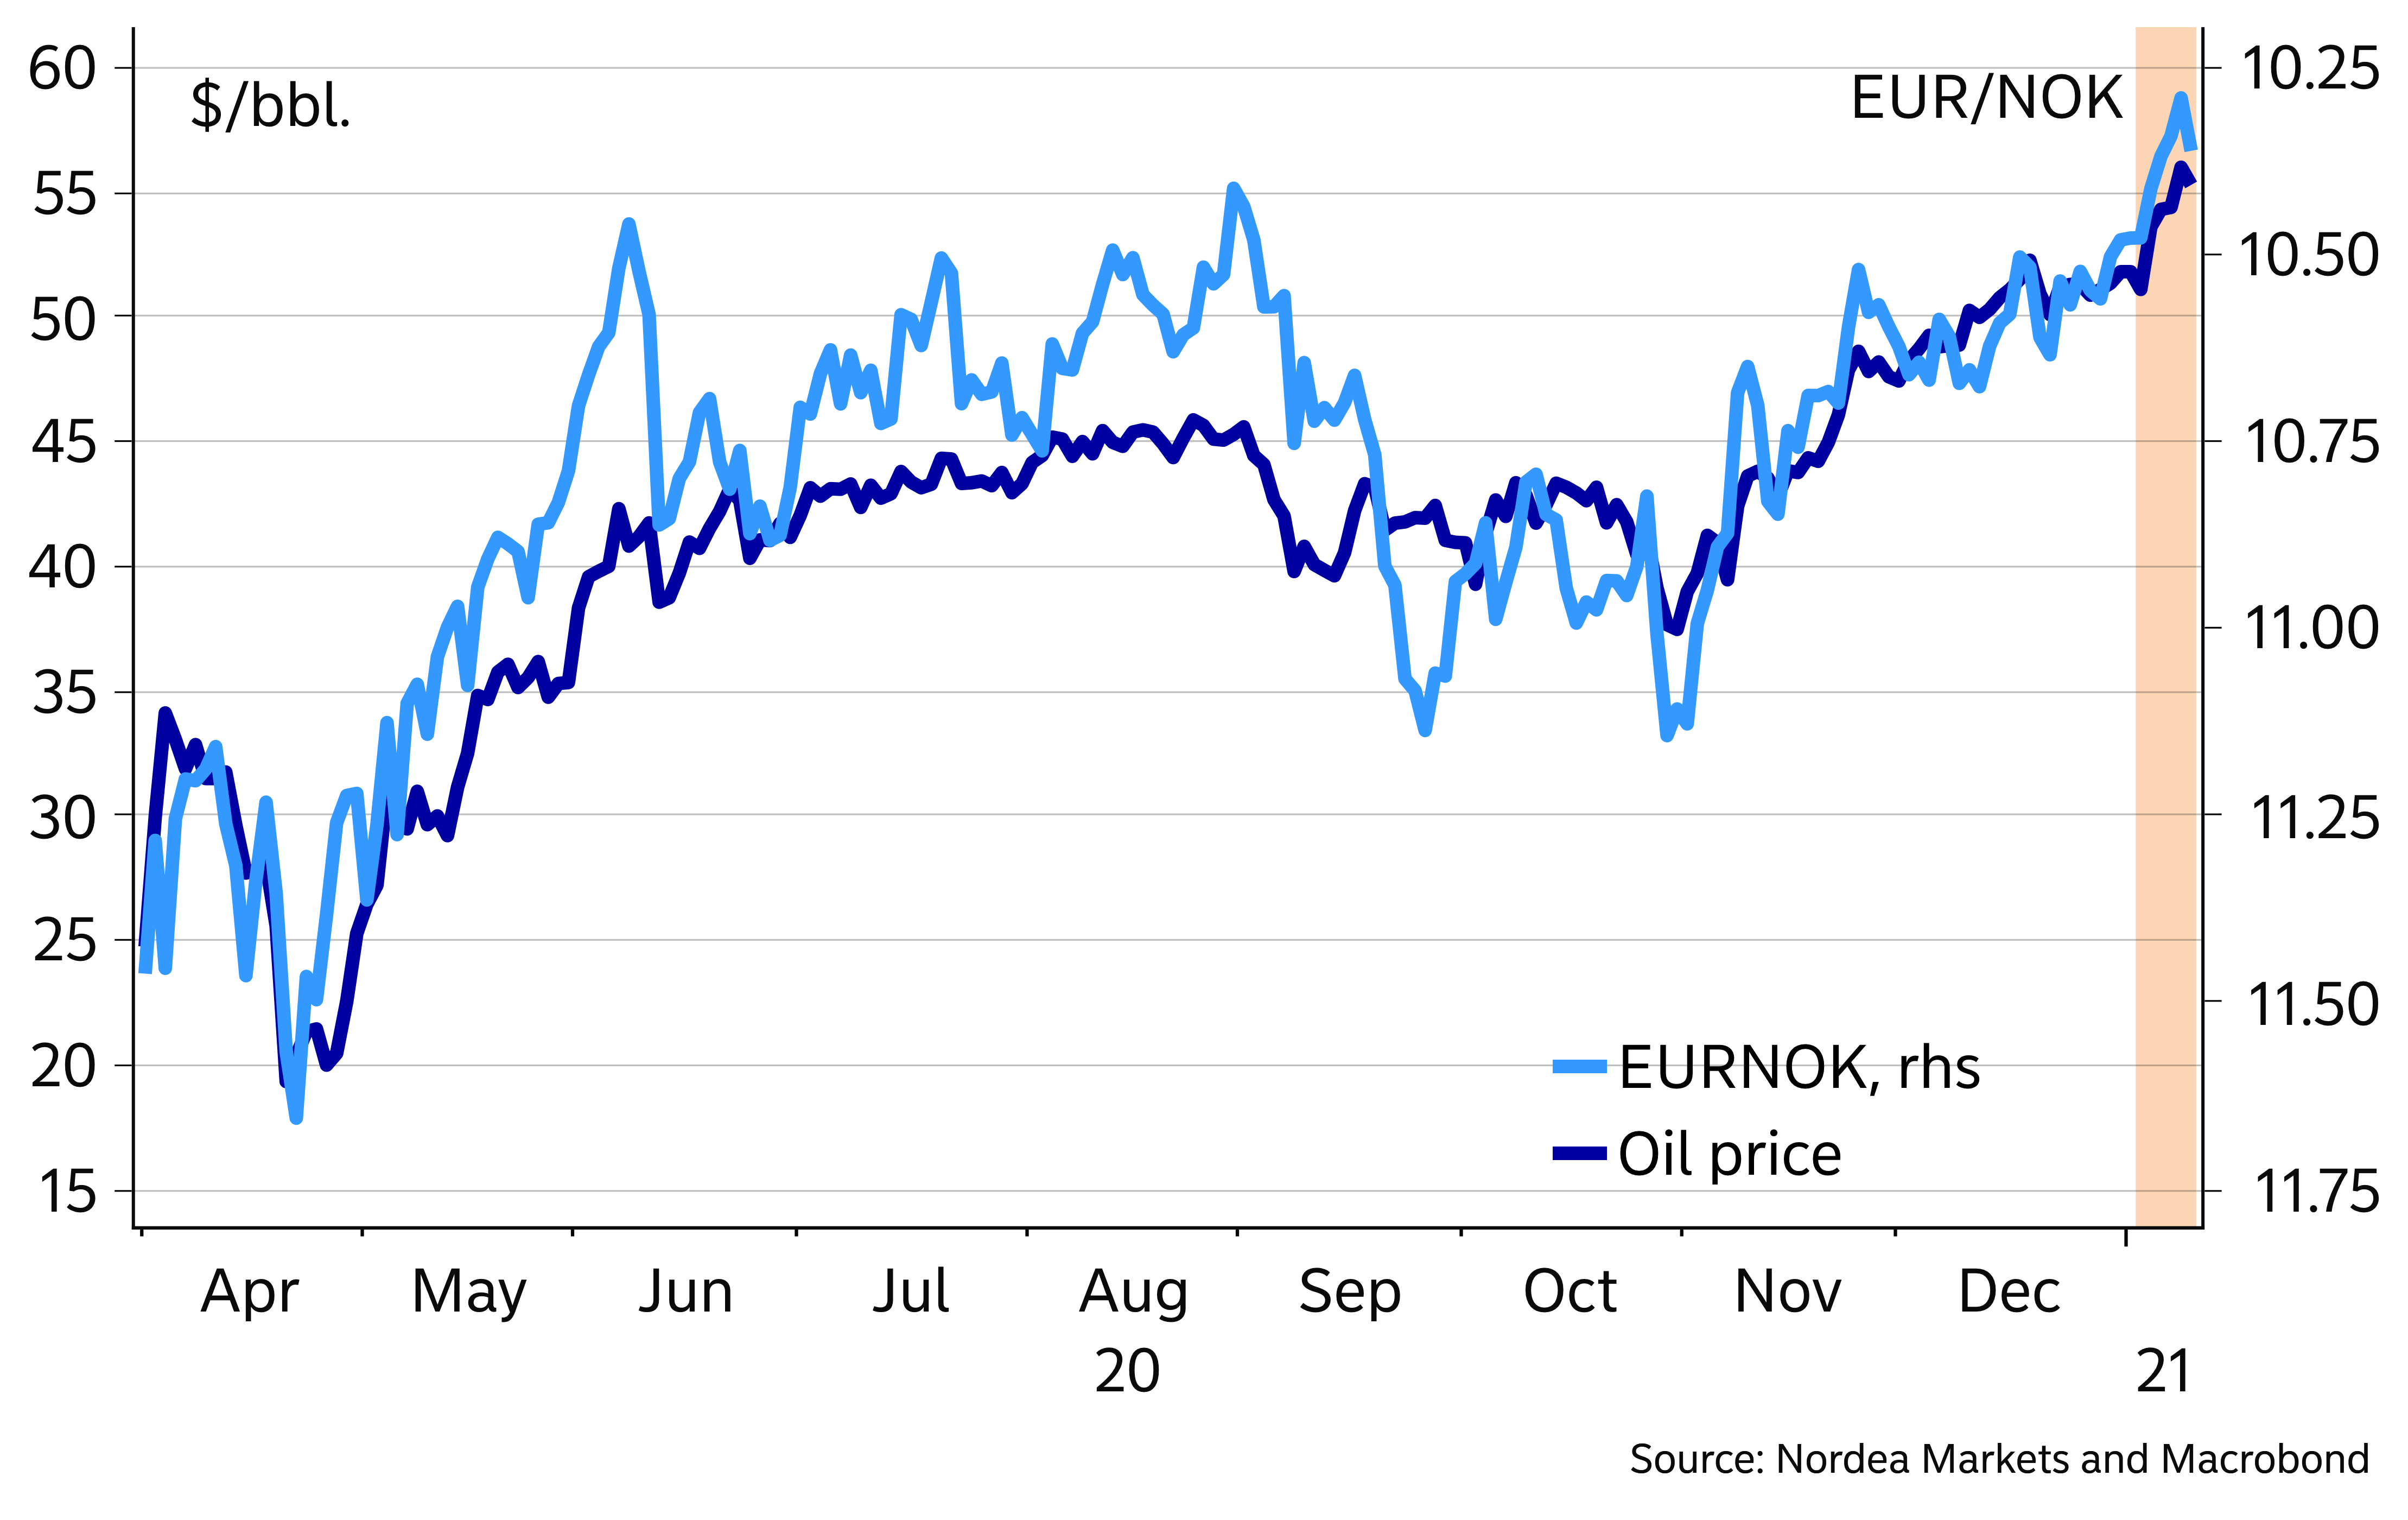
2021 has begun with an euphoric environment in which NOK thrives. EURNOK currently trades around 10.36, after having fallen from 10.50 to 10.27 last week, see chart 1. The unexpected oil production cut from Saudi Arabia pushed oil prices higher last week, now standing around $55/barrel, see chart 2. Moreover, NOK benefited further from the very positive sentiment in financial markets. In addition, the seasonal pattern pointed to a stronger NOK in January, see chart 3, and this year is so far no exception.
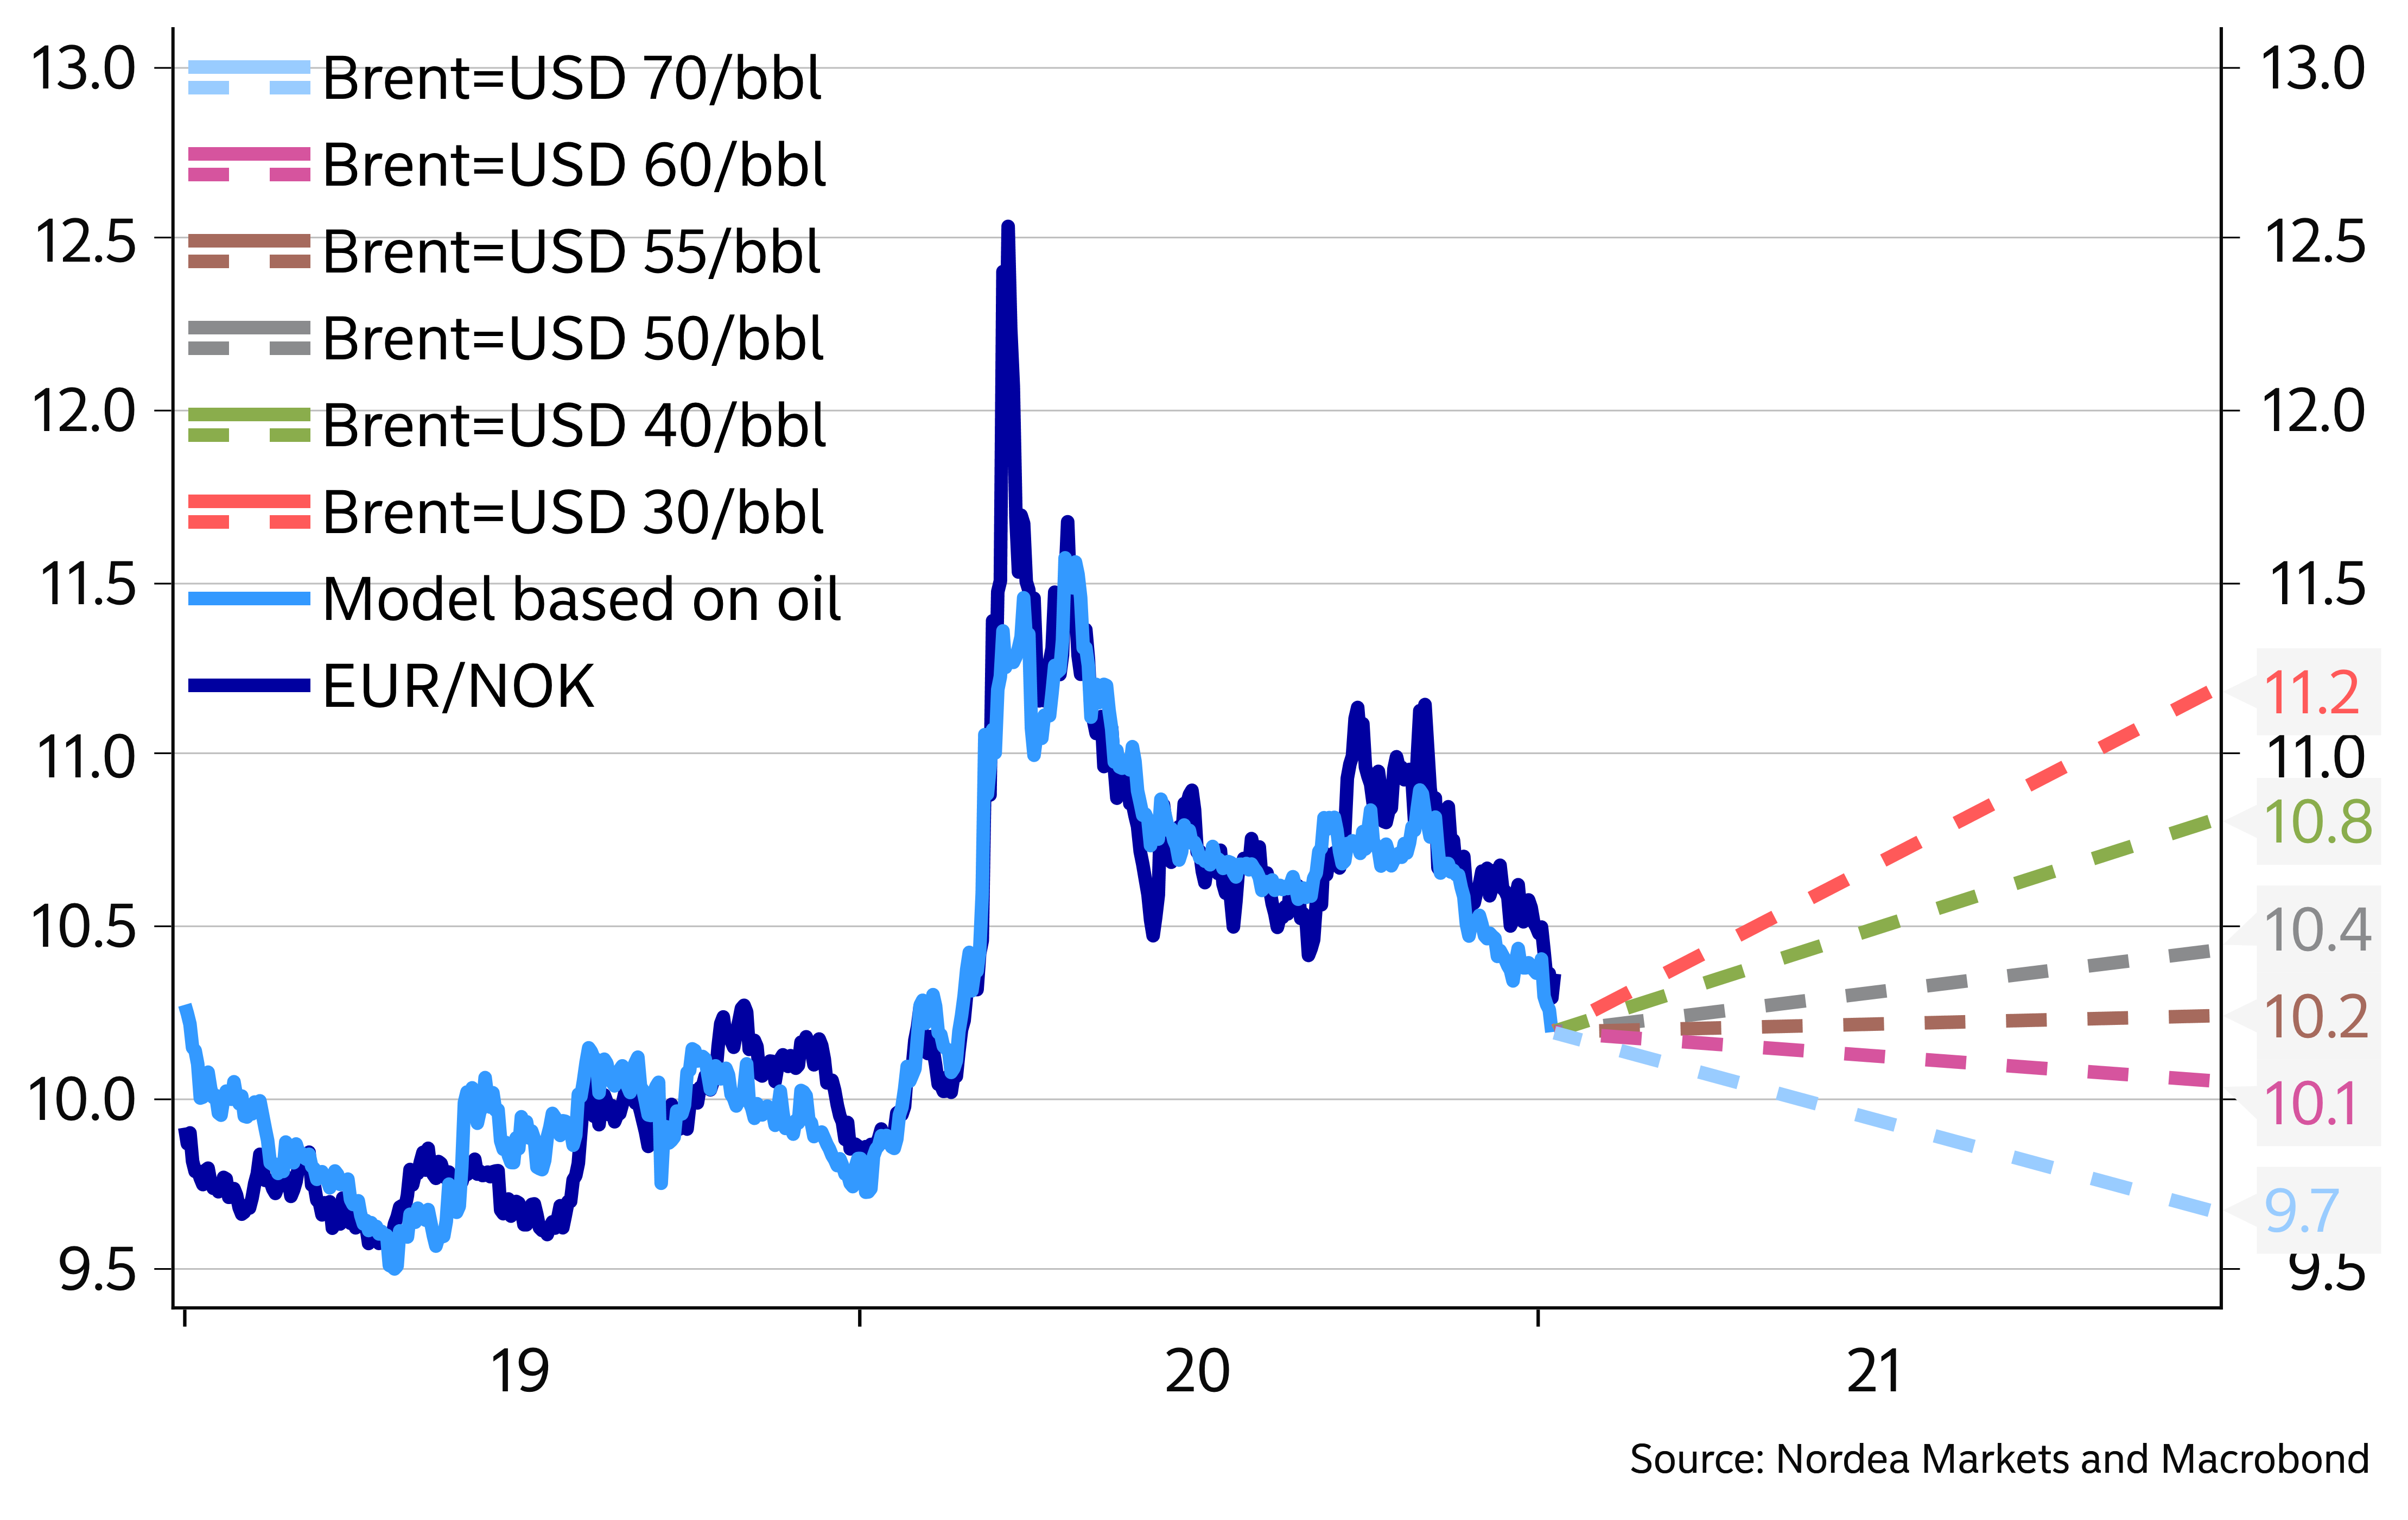
The oil price will remain the key driver for NOK ahead. If Brent moves higher, EURNOK could continue to fall, see chart 4. But we expect the NOK rally will stall when oil prices stop moving higher. And we are getting very close to that point. Further upside in the oil price is probably very limited in the short term, and we don’t expect prices above $60/barrel before the summer.
Overall, we believe NOK has reached the peak for now. This gives an asymmetric outcome for the cross where, in our opinion, it is more likely that EURNOK will move up than further down in the near term. On the upside, we see resistance at 10.50 and then at 10.60, see Chart 1. We see support at 10.30 but this level fell last week and the next line in the sand is 10.20.
Here are the main factors which suggest that the NOK rally is finished for now:
1. EURNOK has fallen around 3.5% since 22 December 2020 when this rally began. Chart 5 shows that previous rallies have ended with movements between 3% and 4%. This suggests that the end of this rally is near.
2. The Relative Strength Index (RSI) has come below 30, a sign that NOK is overbought against the EUR, see chart 6. Usually, after an RSI reading below 30, EURNOK either moves up or consolidates.
3. Foreigners are already quite long NOK, see chart 7. At the current EURNOK levels, the foreign financial speculators could be tempted to unwind their long NOK positions. The same argument holds for domestic financial speculators. Any headwinds in financial markets will likely lead to a snowball effect whereby financial speculators all head for the door at once, potentially leading to a sharp rise in EURNOK.
4. With most of the oil bullishness already priced in, oil prices are likely near their peak for now, restricting the upside for NOK in the short term. The strong market sentiment – reflected by the highest amount of Brent money market net long contracts in a year, see chart 8 – and the production cuts from Saudi Arabia have been detrimental in pushing oil prices higher. Knowing that vaccines will lead to normalisation later this year, markets seem not to care about the restrictions which continue to weigh on demand. But they should care about the high likelihood that US shale producers will increasing investments and supply ahead (see chart 9), something which is profitable at today’s prices, see chart 10.
EURNOK Figures
Chart 1: The NOK rally continued last week. Next support level at 10.20, first resistance at 10.50.
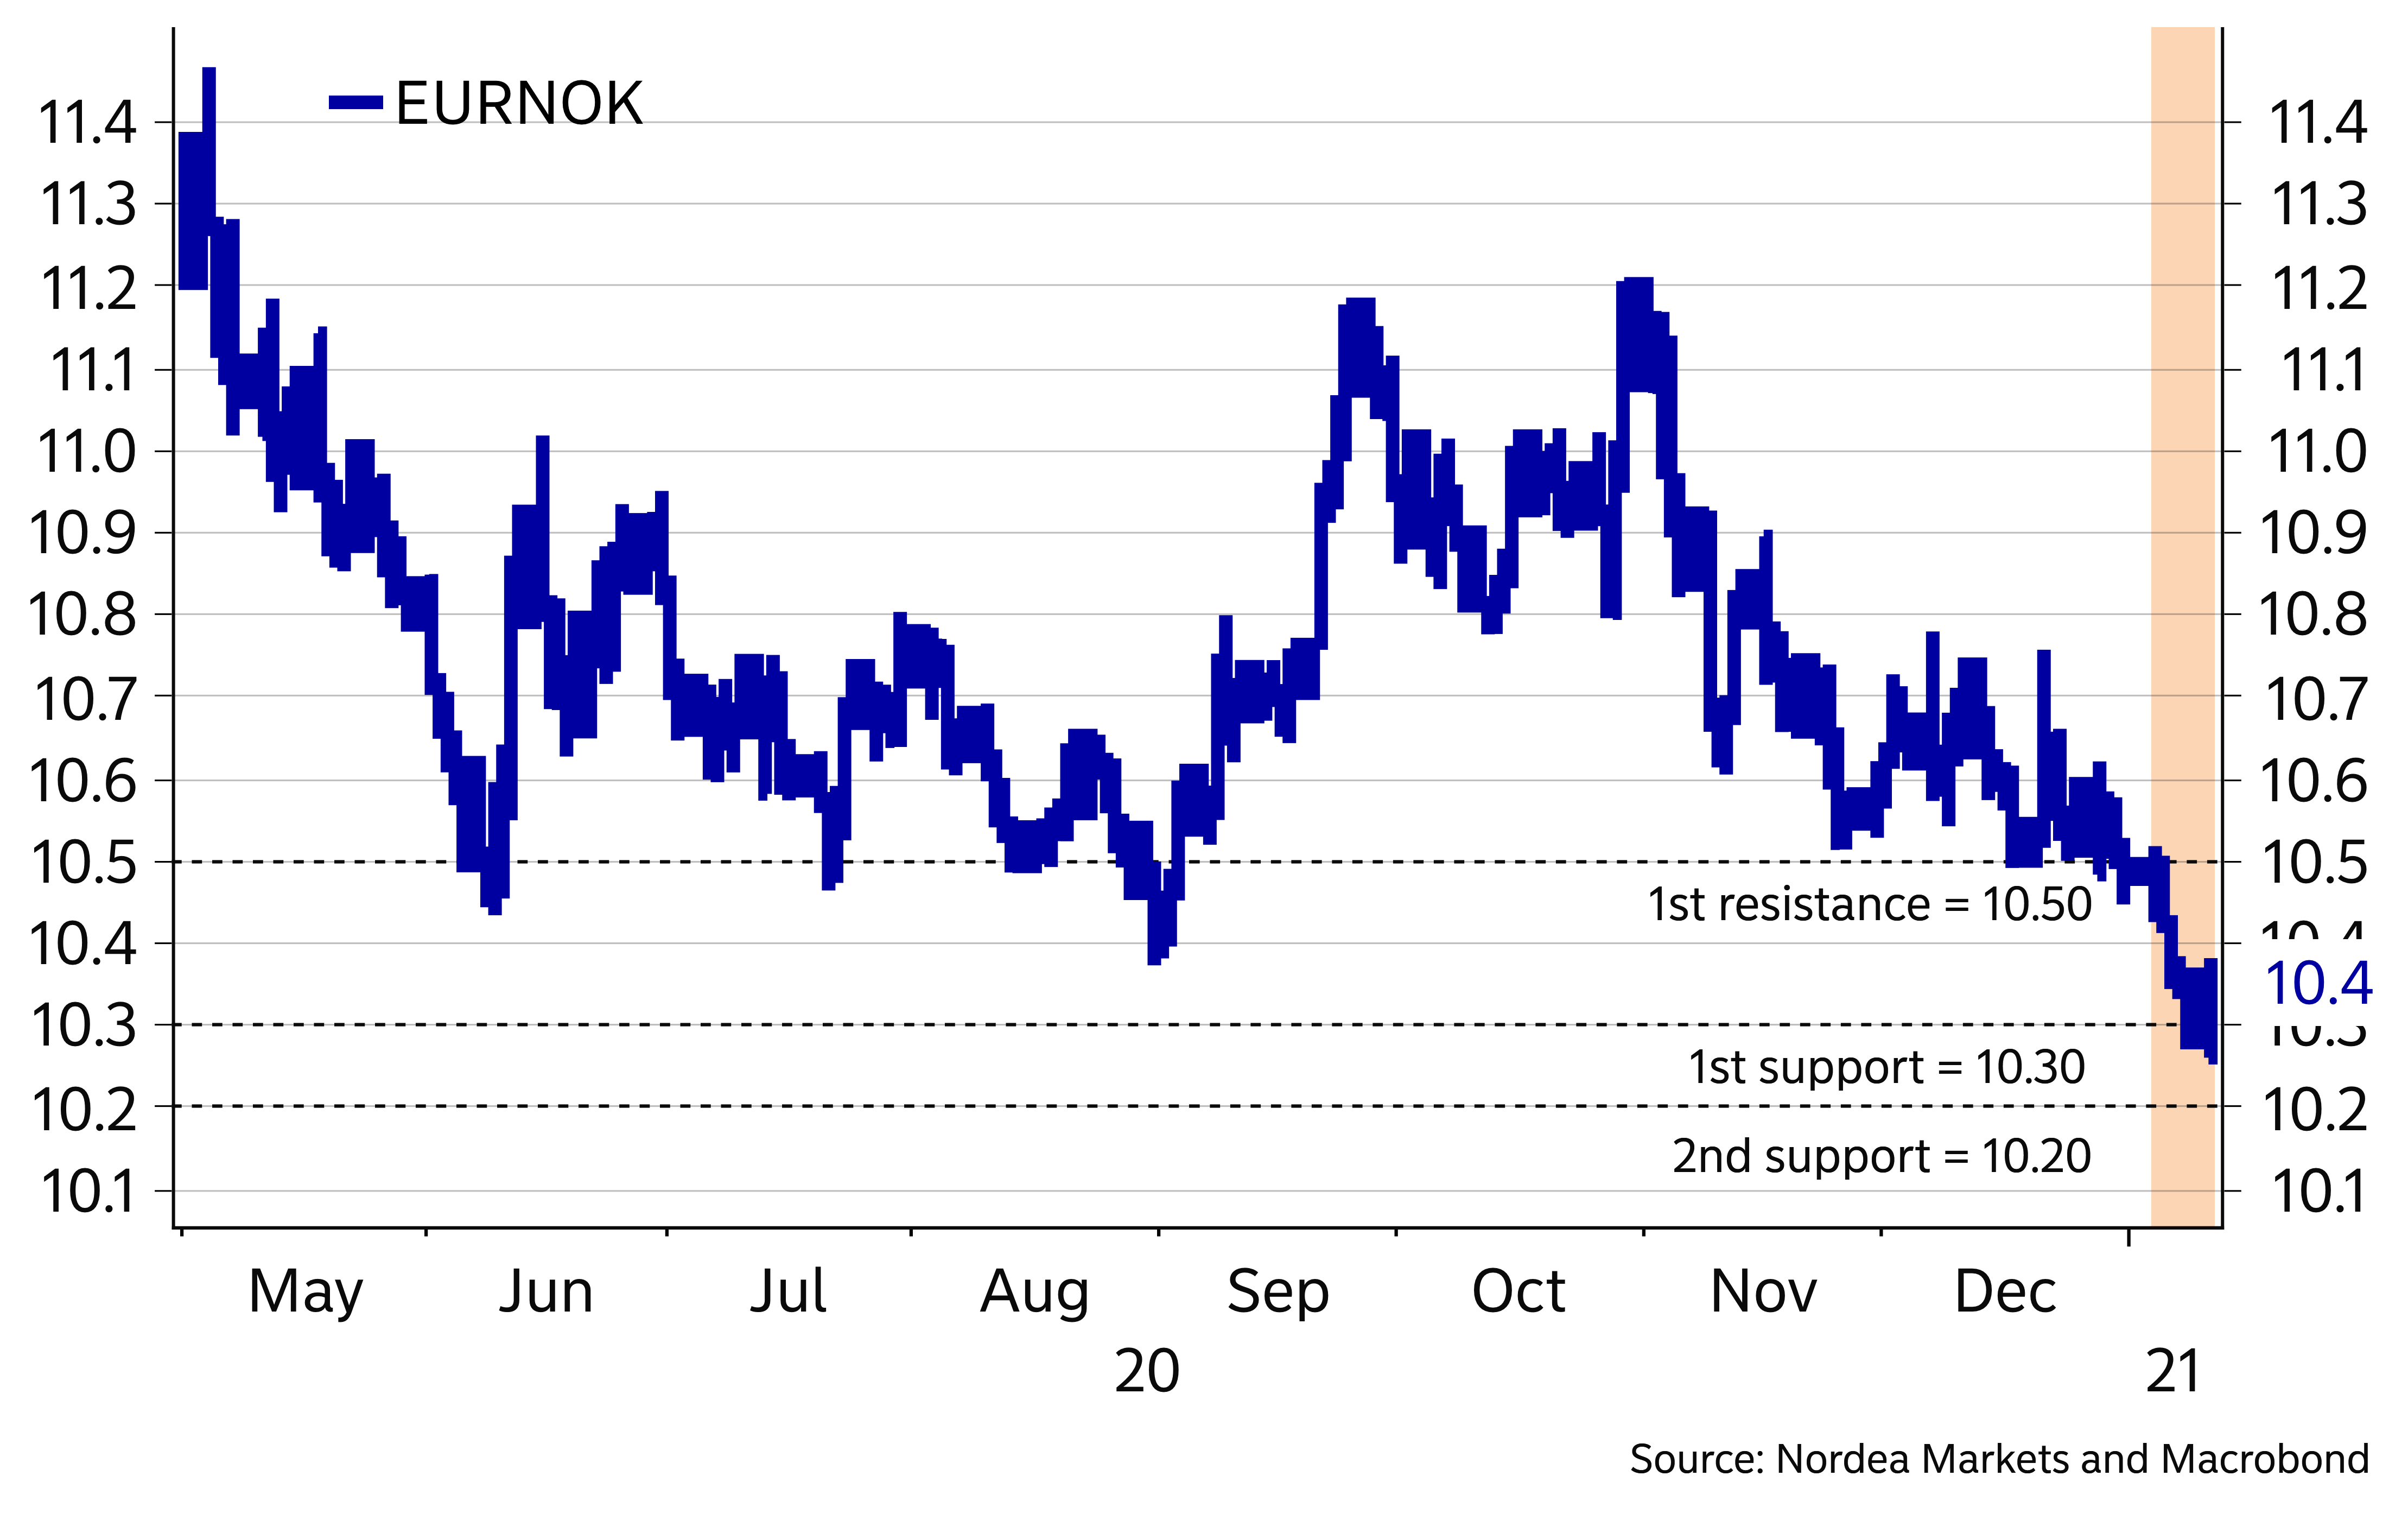
Chart 2: A higher oil price has been the driver behind the lower EURNOK