Der er masser af støj på medie-linjen i denne tid, men det betyder kun lidt for geopolitikken, skriver Nordea. Præsident Donald Trump virker umiddelbart stærk over for Kina, men i realiteten er han ved at tabe handelskrigen. Nordea gennemgår kapitalstrømmene og valutaudviklingen på globalt plan.
Uddrag fra Nordea:
Geopolitics… Who cares? Follow the money
The clock is TikTok’ing on Trumps first term and we should expect a truckload of noisy headlines, executive orders, and esoteric tweeting, but who cares anymore? We try to only care if Trumps activity alters the flow picture. Follow the money.
If you want to receive a copy of FX weekly directly in your inbox, you can sign up via this link.
Quote of the week
“Follow the money” All the President’s Men
Executive orders aimed at banning Chinese based social media services, “Magnitsky-style” sanctions against targeted individuals in Hong Kong, continued focus on the issues with mail-in voting and we could go on and on. The list of very noisy but also fairly market irrelevant geopolitical stories is long. It will prove to be more important than ever to have the irrelevance/noise filter switched on over the coming months. Follow the money, not the noise, which is obviously much easier said than done.
Trumps executive orders from over the weekend is an example of something to take notice of as it will drive flows via e.g. extraordinary unemployment benefits, while the executive orders on TikTok and WeChat and the closing of consulates are of much smaller relevance flow wise.
A lot can be said about Trumps trade advisor, Peter Navarro, but he understands that flows and supply chains matter more than anything else. The design of the US trade war policy was aimed at distorting supply chains in China, while at the same time changing flows via tariffs and it worked. Flows changed destination, Chinas supply chain was distorted and production net/net moved to neighboring countries and China payed parts of that (big) bill, which was ultimately why they had to negotiate with the US to stop tariffs from increasing even more. The problem is just that China outsmarted the US trade team during the negotiations.
Chart 1: Despite the truckload of noise on the US/Chinese relationship, no-ones talking about tariffs anymore. If tariffs are not raised again, then USD/CNY doesn’t care
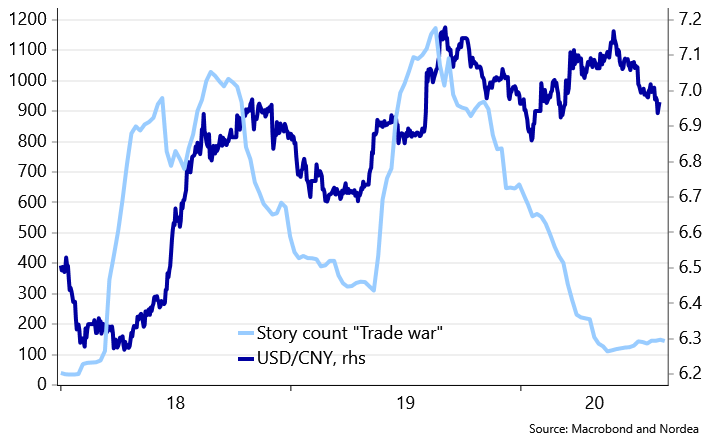
We envisaged that Trump would have had to re-implement a tariff increasing strategy by now in response to China not complying with the trade deal at all, when we entered our long USD/CNH position just before summer. China is not even close to complying with the trade thresholds and they run at respectively 5% and 20% of the promised purchases on important areas such as energy and agriculture. The emperor wears no clothes, and in this case the Emperors name is Donald.
Will Trump finally fully admit that China is not even trying to comply with the trade deal, or will he blame Covid-19 for the lack of trade-flows? The former would entail admitting to being naked the whole time. Not a typical Trumpish move. The former would also entail a re-introduction of a tarrif and supply-chain war, which would be USD positive and risk asset negative.
For now, it seems like Trump will choose the latter by blaming Covid-19 and not fully admitting to the huge trade defeat, while at the same time allowing his administration to continuously bash China in all sorts of flow-irrelevant ways.
Chart 2: Foreign holdings of Treasuries are getting smaller as % of the total market
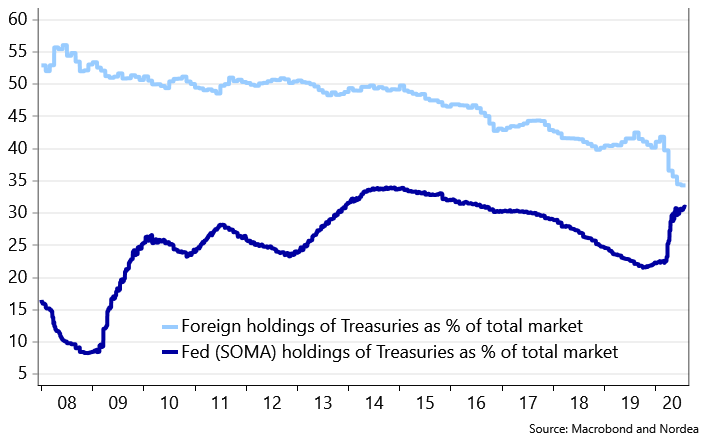
We looked at how and when Emerging Markets build up USD reserves last week and it all depends on the Fed. When the Fed prints a lot of new USDs as in March, it i) eases global USD scarcity, ii) stops the USD appreciation pressure and iii) helps foreign central banks in building USD reserves again. The Chinese central bank is not really in control of this market dynamic, why the USD reserve in China tends to be more of a residual of Fed decision making.
China builds holdings of US Treasuries when the USD weakens, as an increase in global trade is combined with a USD/CNY downside pressure. China’s central bank sells Treasuries (and USD) during a crisis since global trade is subdued. This is exactly what we have seen through spring again with decreasing foreign holdings of US Treasuries, which always leads the media (and even investment banks) to write stories on “the end of the US Treasury and the USD as international safe haven assets”.
Pardon our French, but this is nonsense!
Chart 3: International net purchases of USD assets always slow during crisis periods. It happened in 2008, 2016 and during Covid-19 lockdowns in 2020. It’s called a global trade recession.
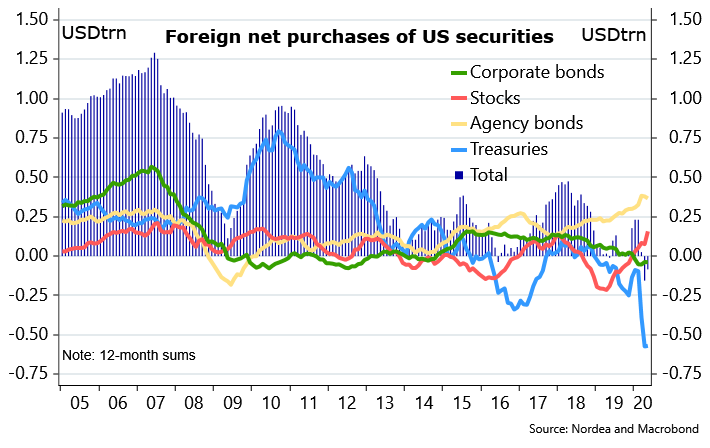
A lot of commentators will be surprised that the net purchase of US assets will pick-up during the rebound phase once global trade increases month by month. It is now even a good idea to buy US Treasuries including an FX hedge from Japanese or European soil, which has not been the case during e.g. 2019. Flows will, in case fully FX hedged, of course remain neutral to USD/JPY and/or EUR/USD.
One could argue that Bank of Japans yield-curve-control de facto spills over to the USD curve now, since Japanese investors will have incentives to buy FX hedged Treasuries on any dip.
Chart 4: US Treasuries are “back in fashion” even if FX hedges are included
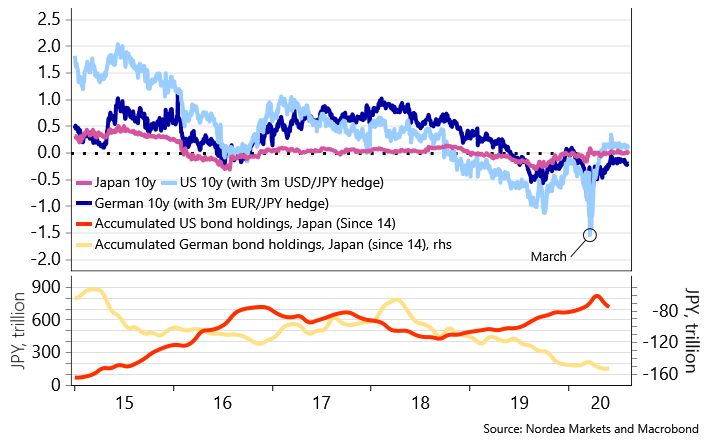
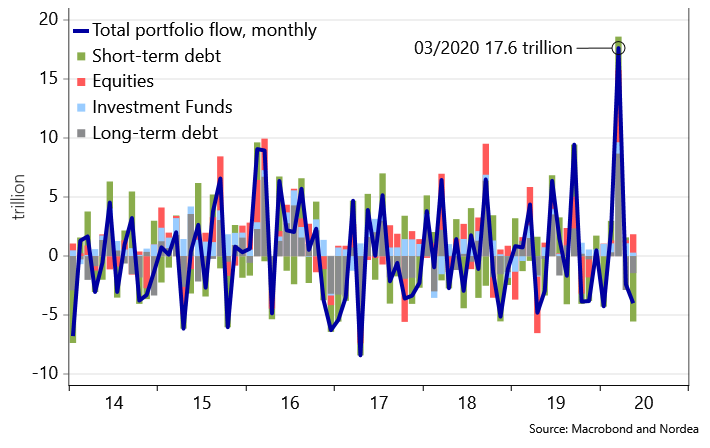
The Japanese investors even started buying a truckload of US Treasuries in the midst of the Corona-storm. The net portfolio flow between US and Japan reached a monthly record high in March, which means that either Japanese investors net bought US bonds or US investors net sold Japanese bonds. We know now that Japanese investors accumulated US bonds through March/April (see the bottom of chart 4), which is in sharp contrast to the narrative that Japanese investors always repatriate flows during crisis times. This could also have repercussions for the safe haven status of the JPY if this pattern proves to be sticky during turbulent times.
Follow the money instead of the noise #2.
Chart 5: Do Japanese investors repatriate money during crisis times? Hmm… At least not during Covid-19 crisis times (Chart shows the net portfolio flow in JPY)
Enough ex-post explanations on flows, and on to the ex-ante discussion on USD liquidity. The US Treasury still expects to “out-issue” the Fed with a USD 947bn Q3 target, which could lead to continued withdrawal of USD liquidity depending on the Treasury Cash Balance at the Fed. The US Treasury expects a quarter-end cash balance at USD 800bn, which is the exact same forecast as for Q2 and we all know how that ended up (USD 1800bn almost).
Trumps executive orders on extraordinary unemployment benefits are already capped at USD 44bn, while the flow effect from the temporary payroll tax cut is highly uncertain. Will employers even comply with it when it is a temporary executive order-based cut? Likely not.
We see a fair chance that the cash account will continue to remain at (very) elevated levels, which could turn into a slightly positive USD story compared to the current narrative.
Chart 6: If USD liquidity is not allowed to re-increase, it will likely lead to a setback for the EUR/USD momentum
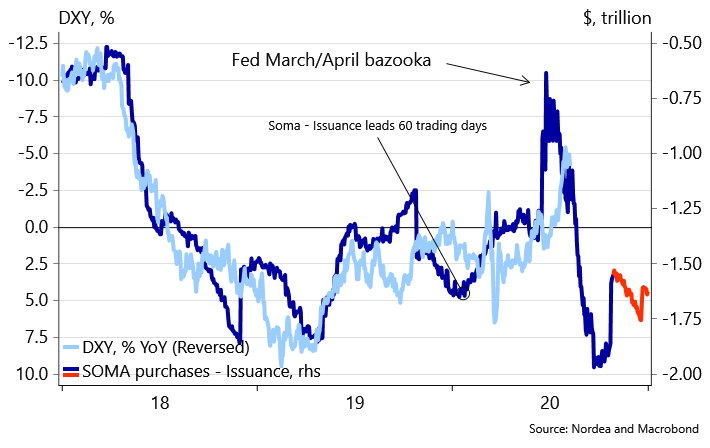
The withdrawal of USD liquidity (even if it has clearly abated in recent weeks) is a reason to expect EUR/USD to retrace from current levels as the hot money long EUR vs. USD positioning is already stretched at 21.1% of net open interest. We have only had 12 weeks of larger net long positioning on CFTC data over the past decade.
It is still relevant to distinguish between hot money and slow money positioning in EUR/USD. USD hedge ratios are likely still (markedly) below historical averages and now that USD rates are almost back on par with the rest of the world, we would expect USD hedge ratios to be slowly but surely increased. Hedge ratio data from Denmark suggests that asset managers, pension funds and the likes are still 7-10% underhedged in USD compared to historical averages.
This is a reason to expect EUR/USD to break materially higher over the medium-term, but for now we lean short in the pair due to USD liquidity, a stretched long in hot money positioning and the smell of roasted Turkey (Week ahead: EUR/USD keeps TRY(ing))
We enter short EUR/USD with a target of 1.1430 and a S/L at 1.1940 (accordingly we take profit in long EUR/CHF).
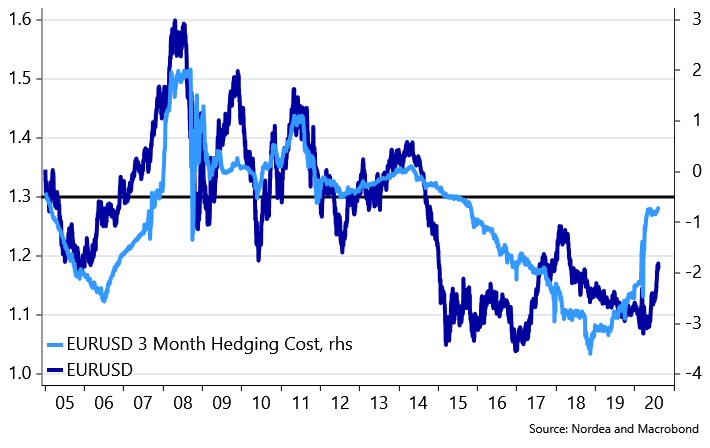
Chart 7: Cheaper USDs in FX hedging usually leads to a weaker USD spot level over time
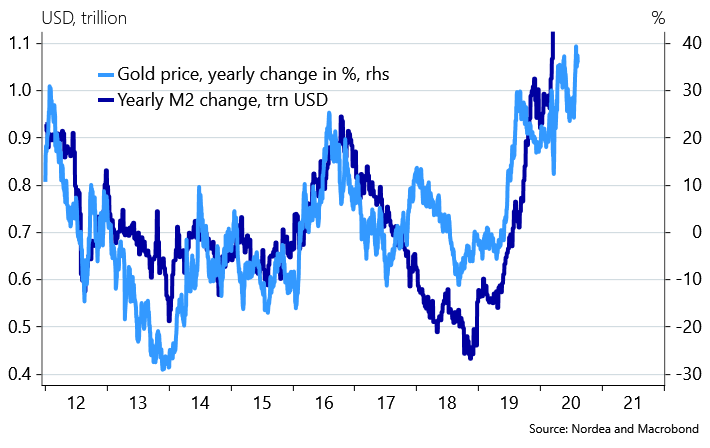
Our short-term USD view also entails that the Gold momentum could take a breather, even if charts like the below makes us almost historically bullish on the shiny metal. When an explosion in M2 is seen, shouldn’t you expect Gold to depict a fiat-debasement?
Chart 8: M2 has left the chart to the upside… will Gold leave it to?
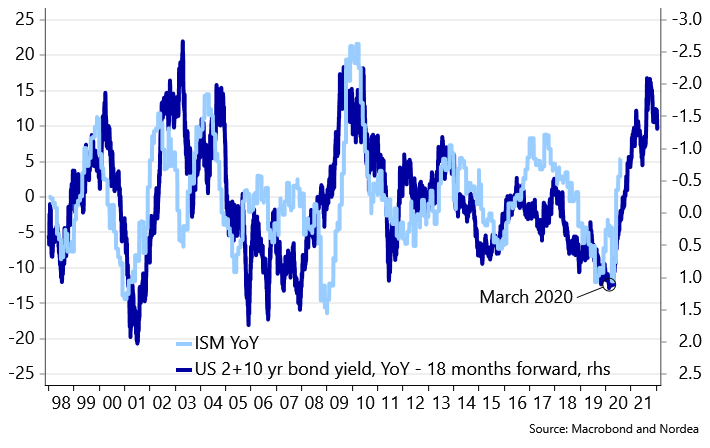
A sudden material pick-up in key figures is the biggest risk to the low real yield environment, and such a positive re-pricing certainly cannot be ruled out. We still lean clearly towards a positive re-pricing risk in to 2021 due to lagged effects of the (too big) truckload of combined monetary and fiscal stimulus. If the below chart holds true, then we should expect a range of 65-70 readings in ISM over the next 9 months. Will the Fed continue to keep the curve 100% flat in such case?
We find it too early to run after such story, but we will remain alert on chances of playing the reflationary spiral big time in to Q4-2020 in e.g. long NOK/SEK, USD curve steepeners or via EM vs. USD equity bets. It is just too early.
Chart 9: Will the ISM index explode to the UPSIDE when we are out of this mess?
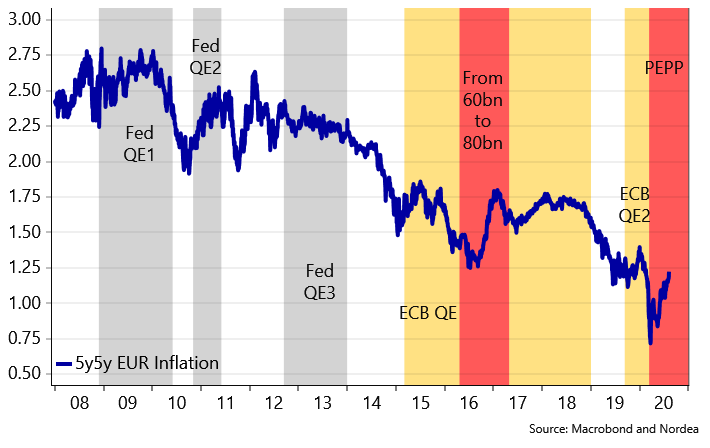
The fiat debasement put is still in place as both the ECB and the Fed will do almost whatever it takes to artificially push up inflation expectations while keeping nominal rates low(er) for longer. Remember that inflation expectations almost always drop outside of QE programs. You shouldn’t expect new all-time nominal EUR core rates lows until the next time that the ECB tries to untangle itself from the QE program.
Chart 10: The ECB inflation swap put is still in place
Scandi markets: The weather is HOT but so is the housing market
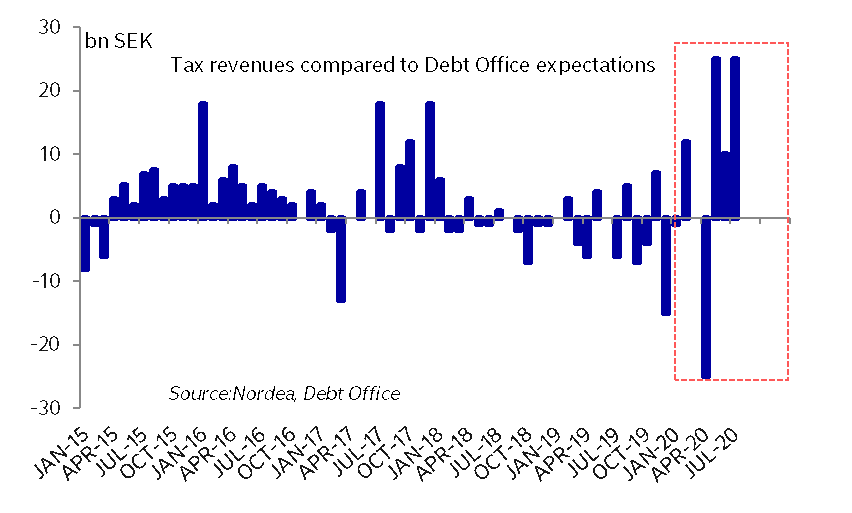
The Scandi economies are still clearly the best among the worst in the West as e.g. housing market tendencies remain solid across all countries, tax revenues are bigger than expected by debt offices and aid packages are not as heavily relied upon as feared. All in all, this is basically just a signal that Scandinavia is broadly speaking performing better than projected by the administrations duing March, April and May.
The monthly Swedish budget outcome for July showed a deficit of SEK 34.4 bn, while the debt office expected a deficit of 58.7bn. Tax revenues were almost 25bn higher than expected, while aid measures are still not used as much as expected. The aid package on fixed costs in Denmark has paid out a little more than 3bn DKK compared to a projection of 65bn DKK from the Government.
The most direct consequence is less borrowing in bills/CPs for both Sweden and Denmark, but it also leaves Scandi FX in a good spot should the reflation re-pricing return more clearly in global markets. Being short a package of USD/SEK, USD/NOK and USD/DKK looks solid with a 12-24-month horizon, but we keep our powder dry for now in such trades.
Chart 11: More taxes than expected in Sweden.. Scandinavia generally faring better than expected
In Norway, house prices rose almost 1% on a seasonal adjusted basis in July, which is a potential catalyst for a more hawkish rate path in September from Norges Bank. Norges Bank warned that an overheating housing market could lead to faster rate increases, and they will allow swift sequential improvements in both economic activity and house prices to be reflected in the longer-end of the rate path in September with inflation being clearly above target as well.
This could make an interesting case for paying NOK rates vs. SEK rates into that meeting, while also buying NOK/SEK. NOK is starting to look cheap again (sorry, we know that’s been said before), also compared to the rapidly rising house prices. We aim to enter NOK/SEK when market liquidity improves later in August, while paying e.g. 1y2y in NOK rates vs. either EUR or SEK could be interesting as the NIBOR specific premium could also pick up 5-7 bps in to seasonally tight NOK banking liquidity in September.
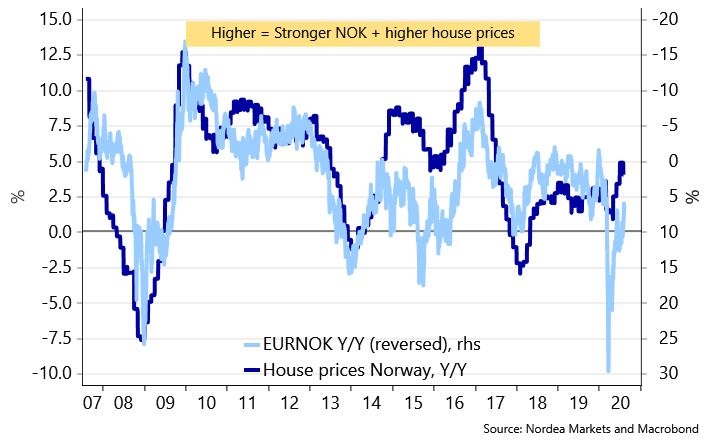
Chart 12: NOK starting to look cheap versus house prices again.
Our running track-record is always attached here.