Der kommer meget svingende økonomiske data i denne tid, og en stribe grafer fra Nordea giver et godt overblik over udviklingen. Selv om den amerikanske rentekurve ser ud til at blive flad som en pandekage, så er der meget forskellige udviklinger, ikke mindst på grund af Ukraine-krigen. Priserne stiger, og det rammer forbruget. Virksomhedernes eksportordrer bliver ramt. Olieprisen stiger, men den amerikanske olieproduktion er dog ikke rentabel endnu, og derfor øges olieproduktionen ikke derfra. Renterne presses opad, og udviklingen fortsætte næste år. Det hele kan tvinge lande og virksomheder til at sætte mere skube i grønne investeringer.
Week Ahead: Flat as a pancake
Global bond sell-off deepened and the US yield curve continued to flatten. There are early signs that consumer sentiment has deteriorated clearly since the Russian assault started, and rising inflation puts pressure on private consumption.
The labor market is very strong, and inflation is much too high
Jerome Powell, 21 March 2022 [1]
The financial markets have continued to position for tighter monetary policy and as a result bond yields have jumped higher, especially in the US, where some changes have been almost off the charts. For example, the 2y Treasury yield rose 18bp on Monday, which is the second biggest jump after the financial crisis, and the largest one-day increase happened only six weeks ago.
The market clearly has the jitters, which is not a surprise in a situation where energy prices will push inflation even higher, war is raging in Ukraine, the Fed is expected to hike 190bp this year and a quantitative tightening will be announced most likely in May.
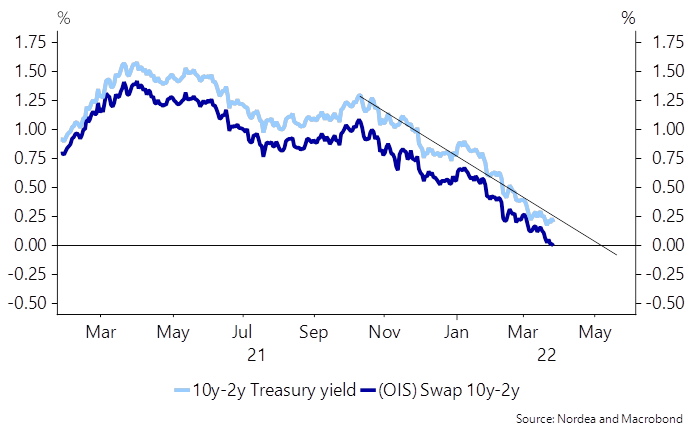
Consequently the US Treasury yield curve has continued to flatten and perhaps the most watched recession indicator, the 10 year minus 2 year Treasury yield spread, is not far from inverting. At this pace, it will invert in early May and if we look at the OIS curve, which excludes the credit component, the 2s10s spread is pretty much inverted already.
The Fed has previously argued that the 10y-3m spread is a more reliable recession indicator, but early in the hiking cycle it’s not the best indicator to watch. The 10y-3m spread might be more reliable, but it’s likely that the market starts to worry much earlier before it inverts. The US yield curve has flattened quickly, but we do note that in the last cycle 10s2s hit 25bp in mid-June 2018 and it took more than a year for the curve to invert, mainly because Fed stopped hiking after December 2018.
Chart 1. The US yield curve has continued to flatten
The latest surge in bond yields has pushed the 10y Treasury yield above the decades-old trend line. Purely from the technical perspective a successful break above the trendline indicates that yields are heading higher from here, but a successful break isn’t always a long lasting event as we saw in 2018.
Chart 2. US yields are testing the decades-old trendline
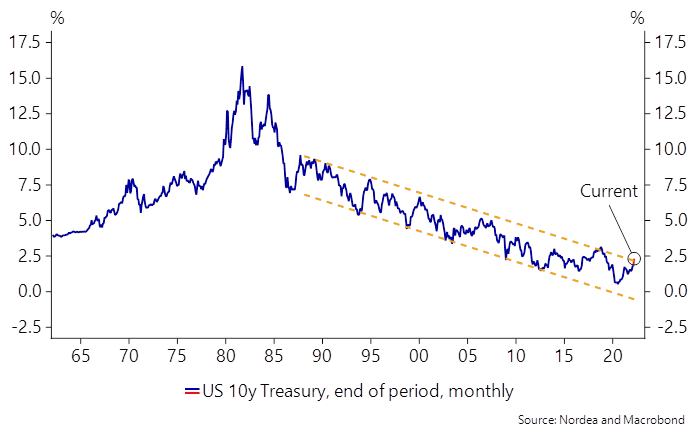
We expect yields to rise even more in 2023 as highlighted in our financial forecasts and yields may have bottomed permanently. However, we are far from certain to call significantly higher yields in the horizon. For example, weak working age population growth and rather slow productivity indicate that we are not heading towards clearly higher, for example 4 %, yields at least permanently.
On the other hand, not all factors point towards low yields. Climate change probably means higher – and more volatile – inflation in the coming years. In addition, there is a need for green investments globally and higher money demand should support higher yields. Also the Covid-19 pandemic is creating uncertainty, and we still do not know how it will affect productivity longer out.
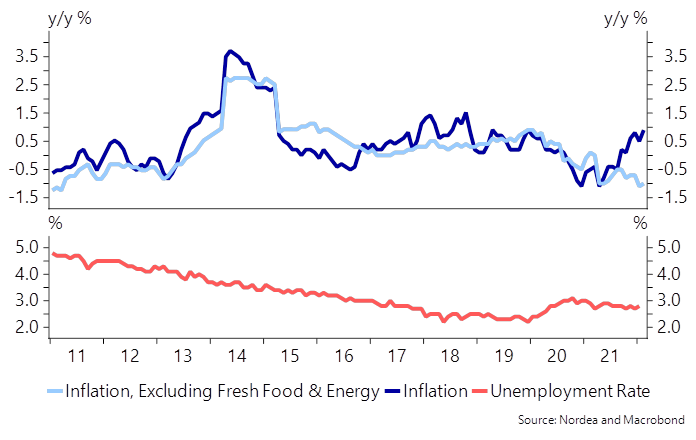
Moves in the bond market spilled over to the FX market as well. One of the victims has been the Japanese yen, which usually should gain in uncertain times (although safe haven status is not as clear as it has been historically). USDJPY has risen 2% this week, and the Bank of Japan is pretty much the only dove standing. Deflationary forces are strong in Japan and core inflation is still negative, although headline inflation has climbed to 0.9 %.
Maybe this time global inflation pressures prove to be so strong that even the BoJ could turn hawkish? That would be quite something. Also rising oil prices have hurt the JPY. Japan imports almost all its energy and the current account may well drop to negative territory during the spring. The JPY should have a hard time going forward, but the biggest depreciation is probably already behind us.
Chart 3. Core inflation is still negative in Japan
In the commodity space, energy prices have surged again this week. Oil prices have risen to USD 117 per barrel and in Europe gas prices rose about 10% this week, driven by president Putin’s demand for ruble payments from so-called unfriendly nations. Currently, it seems that the EU will not impose sanctions on Russian energy, and it is unlikely that Russia will stop energy flows to Europe. However, the EU’s response depends on how the Russian assault will develop and energy sanctions are not completely off the table.
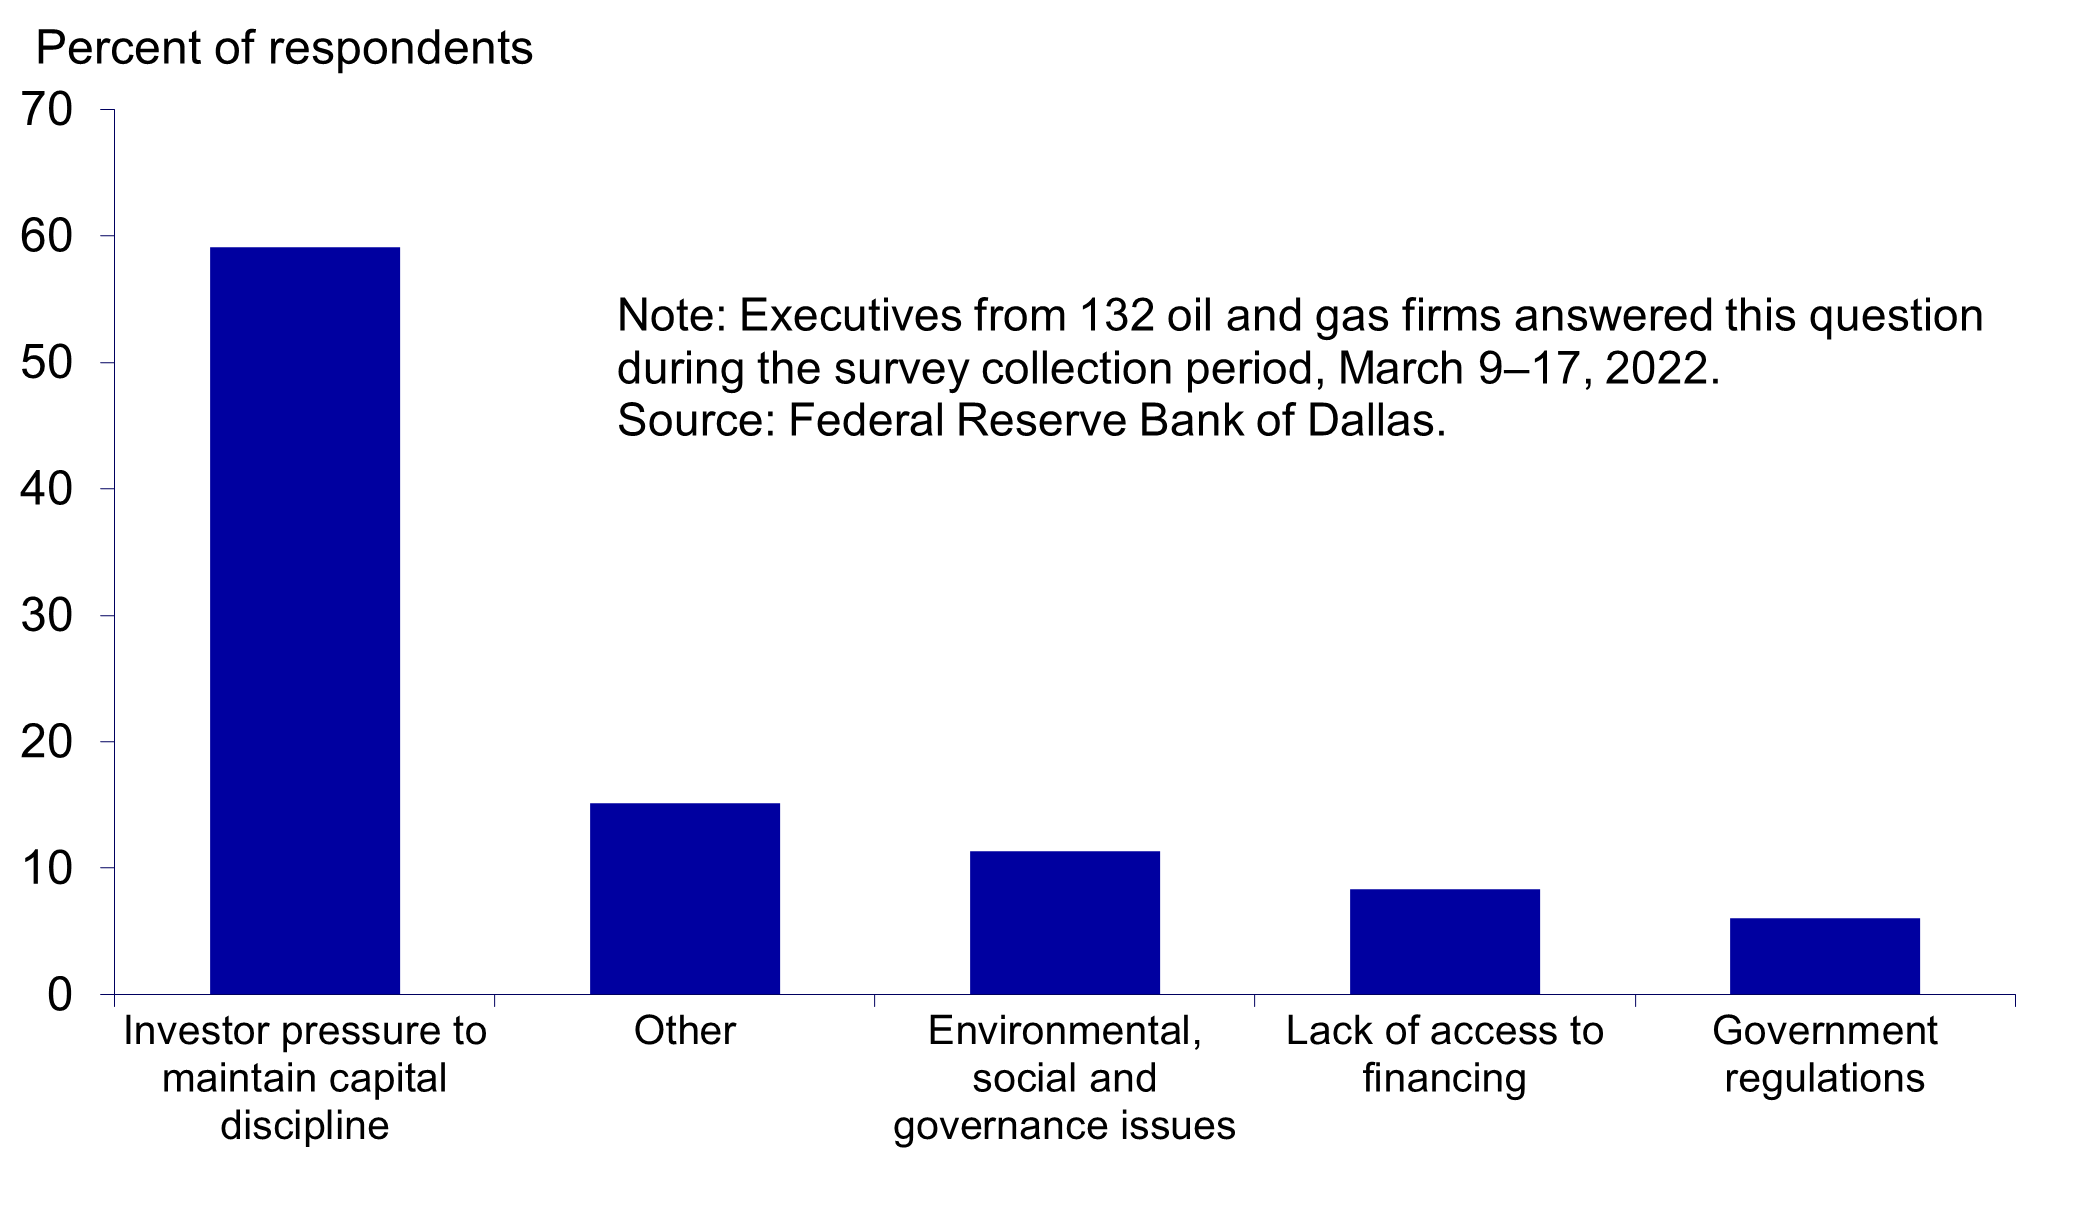
In the US, oil production is well below the pre-pandemic levels, and the Dallas Fed survey reveals that oil executives consider that the primary reason why public companies are restraining growth despite high oil prices is investor pressure to maintain capital discipline. High oil prices may not help the US oil production to recover quickly. According to the Dallas Fed survey companies need USD 56 per barrel on average to profitably drill and 30% of large companies expect crude oil production to rise more than 10%. All in all, the survey indicates that companies are not in hurry to produce more, which should support the oil prices.
Chart 4. Slow recovery of US oil production
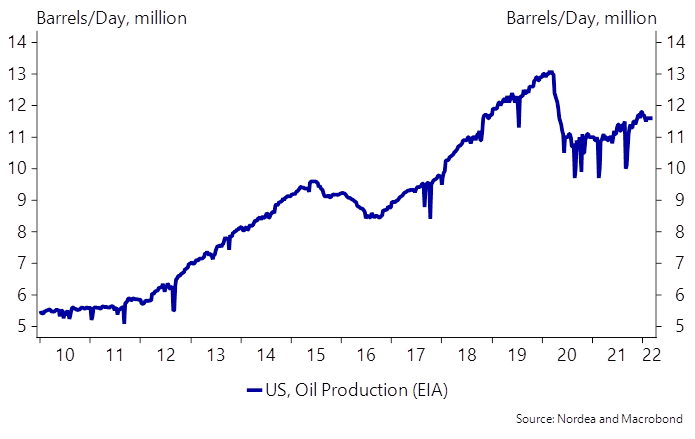
Chart 5. Which of the following is the primary reason that publicly traded oil producers are restraining growth despite high oil prices?
Russian assault deteriorated consumer sentiment
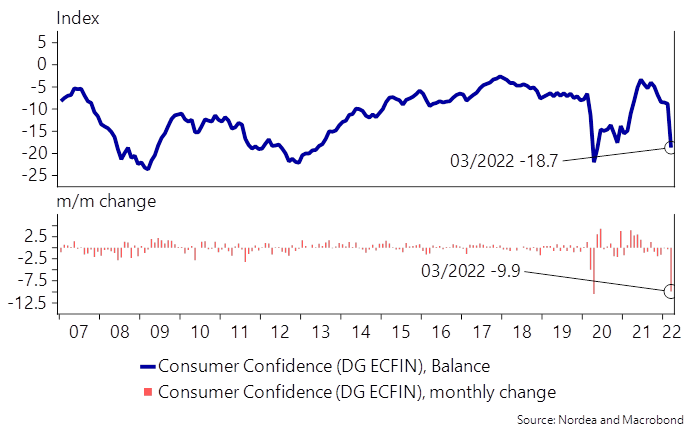
Everyone is trying to estimate how companies and consumers are going to react to the war-related uncertainty and this week we had the first confidence indicators. Results were mixed. Euro area consumer confidence dropped 9.9 points in March, almost as much as when the Covid-19 pandemic shut down societies in 2020. The same trend was seen in Denmark and Belgium but war-related uncertainty is not the only driver. The cost of living has increased fast, which darkens the mood among consumers.
Chart 6. Euro area consumer confidence plummeted
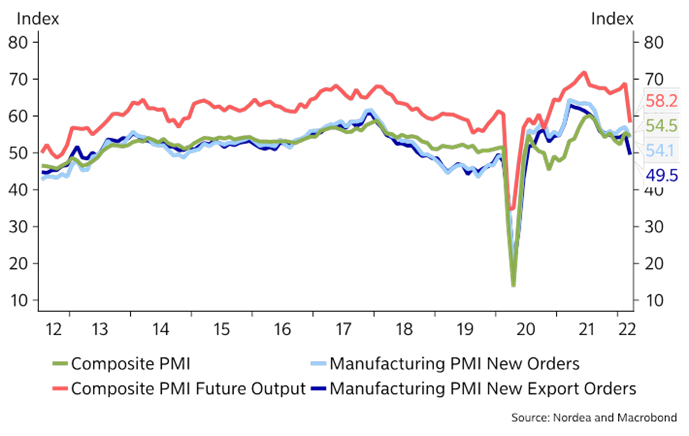
Euro-area Purchasing Managers’ Indices (PMI) were mixed. PMIs surprised to the upside on a headline level. Further re-opening of the economies boosted activity, while the war in Ukraine reduced it. Companies are struggling with supply chains and both input and output prices edged higher in March. The Future Output Index dropped from 68.7 to 58.2, most likely illustrating high uncertainty.
A worrying signal was new export orders dropping below the 50 level for the first time since July 2020. At this point it’s still too early to conclude how consumers and companies will react to increased uncertainty, and we might see soft data overestimating the effects. In our Finnish Corona Barometer (data including week 10), which tracks Finnish card spending, we do not see any significant effects from the war. However, the outlook for private consumption isn’t bright as high inflation will reduce purchasing power going forward.