Nordea sætter spørgsmålstegn ved, om tingene bliver normale igen. Råvare- og energipriserne er steget så meget, at det vil påvirke vækstudsigterne. Desuden har forbruget fuldstændig ændret karakter under pandemien fra service-efterspørgsel til efterspørgsel efter håndgribelige varer, fordi forbrugerne ikke kunne “færdes frit” under pandemien, men kunne bestille varer hjemmefra. Men det kan også føre til en overflod af forbrugsvarer. Produktionsvilkårene og pandemien har også påvirket arbejdsmarkedet, så lønningerne er presset i vejret. Kort og godt: Der er mange usikre momenter, men én ting er sikker: The hyperinflationistas are back in town, som Nordea udtrykker det.
Nordea weekly: The hyperinflationistas are back in town
This is the moment that hyperinflationistas have been waiting for, but we remain unconvinced that the current wave of inflation is QE-driven. It doesn’t mean that we aren’t expecting a further frontloading of inflation during Q4. Stay long energy.
We continue to like energy-linked positions as the EU remains stuck in tricky discussions with Poland and Hungary, rather than focusing on solving the energy crunch. Meanwhile, according to the Climate Prediction Center, there is an 87% probability of the so-called La Nina phenomenon again this winter. This will be the second year running, which leaves an elevated risk of high-pressure systems over Siberia, which will usually plan an important role in the winter formation in Europe (colder than usual). While this is extremely far from being actual hyperinflation (the definition is 50% price increases MoM), we remain of the view that inflation expectations can be frontloaded even further into New Years.
Will anything ever be normal again?
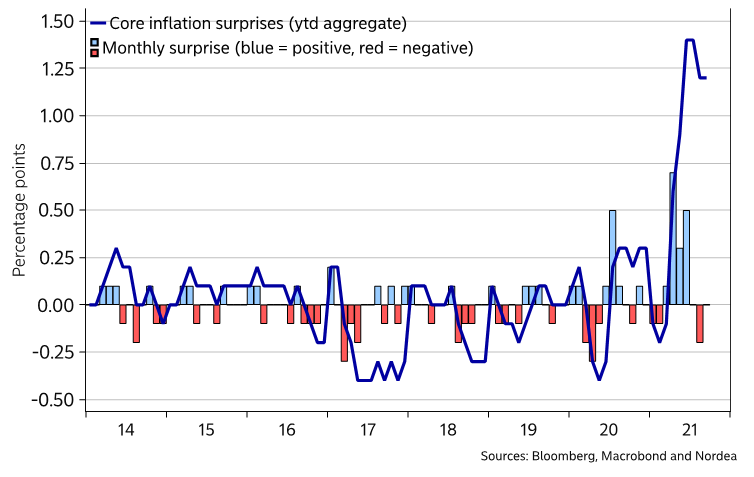
Inflation and stagflation continue to be the themes du jour, as inflation has surprised the most ever so far this year (vs consensus expectations in the terminal). The commodity price boom and the energy crisis – likely growth-negative in our view – are further strengthening the stagflationary narrative. Supply chain issues are showing up across social media, with even Bloomberg reporting on empty shelves.
Chart 1: US core CPI has surprised by the most ever so far this year
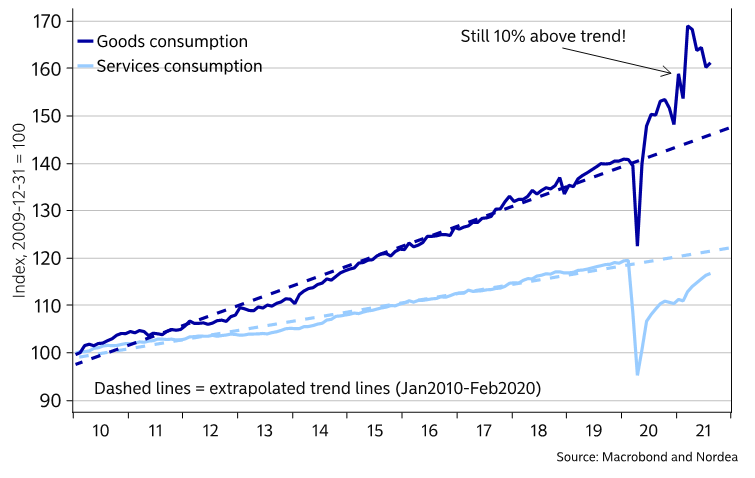
One likely underappreciated driver of so-called supply chain issues stem from demand-side issues. The initial shock from the pandemic depressed demand both for goods and services. However, already by June 2020 US goods consumption had surged way above trend. If you can’t consume services as you’re locked into your apartment – of course goods consumption will surge. This nonetheless caught goods-producing companies off guard since they plan for trend growth in demand, and this has not only exacerbated various shortages but also led to greater CPI “inflation” as goods prices are more flexible than service prices.
Chart 2: Composition of demand still out of whack
If the composition of demand ever normalises, this will ease inflationary pressures and ease shortages – possibly even leading to a glut of goods, if producers are currently betting that what we have seen since June 2020 represents a new normal. However, as of August 2021 goods demand was still running 10% above trend.
Indeed, Americans are still very afraid of the virus, especially Democrats (41% of Democrats think it’s a 50% risk for an unvaccinated person to end up in hospital if diagnosed with COVID-19). Democrats’ idol Fauci has said it’s “too soon to tell” if Christmas ought to be cancelled or not, so a normalisation would seem distant, hence inflationary pressures from this wonky demand composition won’t ease for quite some while.
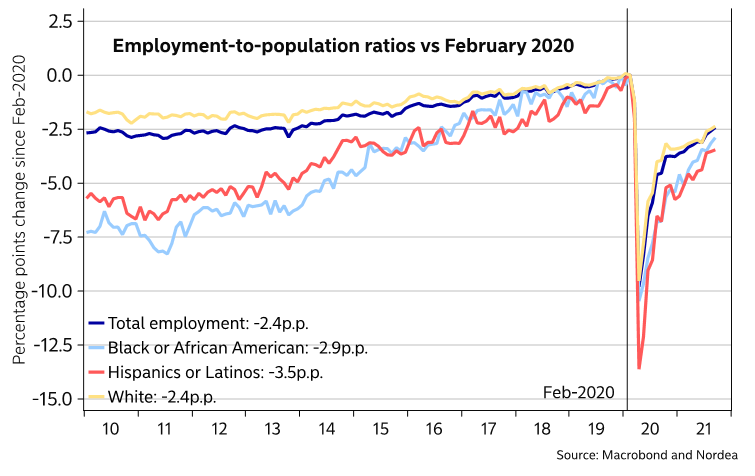
Chart 3: There should be massive slack according to EPOP ratios
Team Biden is making the situation worse
What’s more, we would argue that team Biden is making everything worse – and not only because of its war against brown energy/re-regulation/shutting down pipelines, etc. Vaccine mandates are intensifying the distortions on the US labour market.
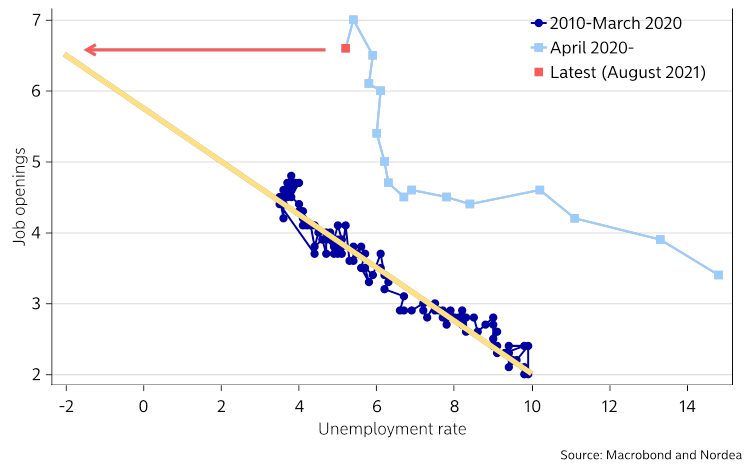
While employment-to-population ratios suggests there should be lots and lots of wage-depressing slack in the labour market, an updated Beveridge curve suggests otherwise – that the equilibrium rate of unemployment/NAIRU (or whatever the economist priest-class calls it nowadays) has surged.
Chart 4: Pre-pandemic Beveridge curve suggests an unemployment rate at -2%
The pre-pandemic relationship between job openings and the unemployment rate (the so-called Beveridge curve) suggests that we ought to have been seeing a -2% unemployment rate. However, with workers afraid of the virus, or having trouble to find child care, trying to move from the service sector to the goods sector, NAIRU will be higher at least for a while. Thousands upon thousands of workers have also been fired due to vaccine mandates, which is intensifying worker shortages in some regions (and reducing the flexibility of the US labour market). This is inflationary. Jobless New York nurses are of course welcome to Florida but relocating takes time and it boosts frictional unemployment and thus NAIRU – again at least temporarily.

