Kina og Tyskland er de lande, der rammes hårdest af den eksplosive stigning i energipriserne, skriver Nordea i en analyse. Kina er især hårdt ramt, fordi der har været en enorm stigning i produktionen efter pandemien, fordi Kina også vil skære ned på fossilt brændstof. Da Kina lægger om fra kul til naturgas, påvirker det også Tyskland, der er meget afhængig af naturgas. Tyske virksomheder kan desuden blive ramt, hvis økonomien og eksporten i Kina bliver markant lavere. USA klarer sig langt bedre gennem energikrisen. Rusland og Norge bliver de helt store vindere med kraftige stigninger i deres indtjening – også på valutaområdet.
Global: Mirror, mirror on the wall, who will win the energy brawl
Who will be the winners and loser of the current energy crisis? Will Germany take a beating over the winter? And why we keep liking RUB and AUD.
Highlights from our analysis
- Chinese coal shortage and environmental regulations will skew Chinese energy demand towards gas, in turn keeping pressure on energy prices over the cold winter months and the first quarter of 2022
- We remain confident in our short EUR/AUD and CNH/RUB energy trades as global energy demand is unlikely to ease in the near-term
- AUD and COP longs are the energy trades with the least stretched positioning
- Long KRW looks like an attractive energy fade trade, but it is too early
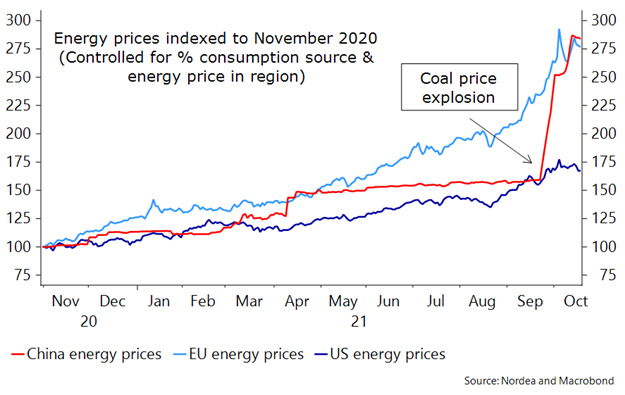
The recent energy price surge have taken markets with a storm and is unlikely to pass by before we have made it through the cold winter season. The situation is contained in the US while prices are snowballing in Europe and China. While the energy situation in Europe has deteriorated throughout much of 2021 it markedly worsened when China’s coal prices went rampage – and it is likely to continue to depend on the situation in China.
Chart 1. China has exacerbated the energy crunch
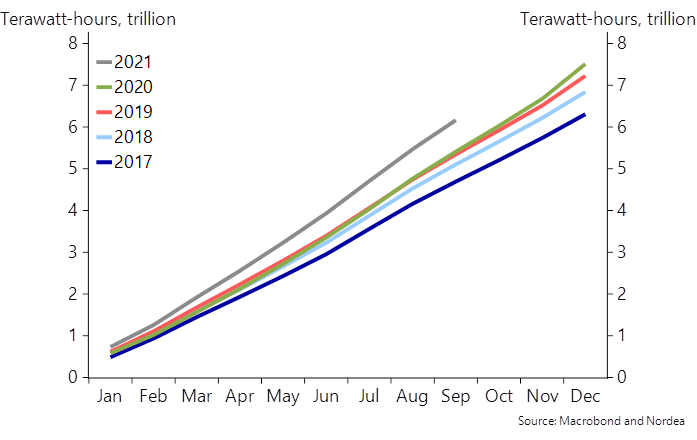
For China, being the world’s factory has its advantages, but it certainly comes at a price. The global reopening and exploding demand for Chinese goods has given rise to an abnormally high energy consumption in China. The combination of historically low Chinese coal inventories and China’s ambition in cutting its energy intensity and CO2 emissions (ahead of the Winter Olympics) means that around 2/3 of the economy is impacted by varying degrees of energy curbs. Considering seasonal high energy consumption patterns in Q4 and Q1 Chinese regions may very well have troubles meeting production if they cannot import enough natural gas to meet environmental targets.
Chart 2. Aggregate Chinese 2021 energy consumption is an outlier
We expect the shortage of coal in China and the increasing demand for LNG due to China’s limited pipeline capacity for gas to keep an upwards pressure on energy prices – at least until China has meet its ambition of blue skies for the winter Olympics in February. Moreover, recent data shows that Russia has kept gas supply to Europe limited not allocating any additional capacity to Germany. The shortage of gas in Europe will add to the demand picture and the potential of a colder than usual winter possess a tail risks.
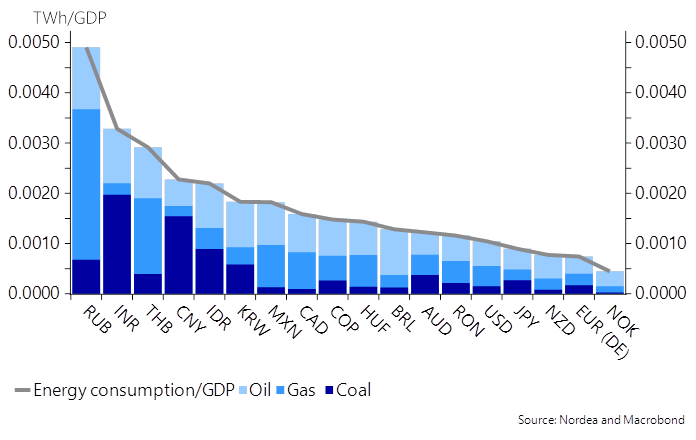
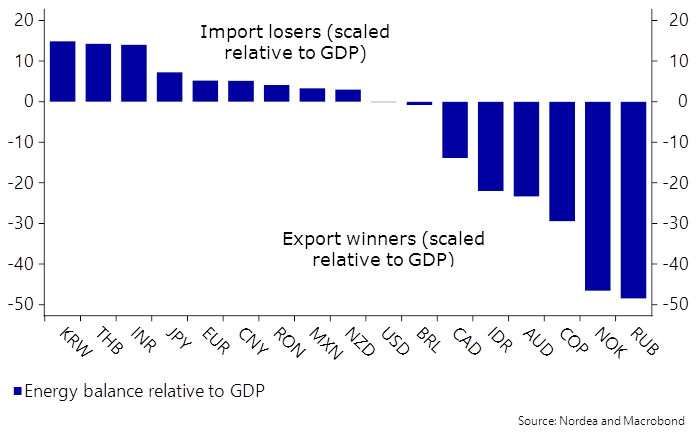
Naturally, the repercussions are global. We have constructed an energy playbook to deduce winners and losers in the current energy crunch. The course of action will unsurprisingly depend on economies’ relative energy balance as well as their energy intensity. To assess the relative impact we put energy measures relative to GDP in dollar terms.
Chart 3. Energy intense economies
Our findings reveal elevated risks in India, Thailand, China and South Korea, who are all energy intensive and dependent upon energy imports. On the other side of the spectrum Russia, Norway, Colombia, Australia and Indonesia are all set to be winners as they are self-sufficient and relatively speaking stand to gain the most from exporting energy.
Chart 4. Relative winners and losers in energy trading
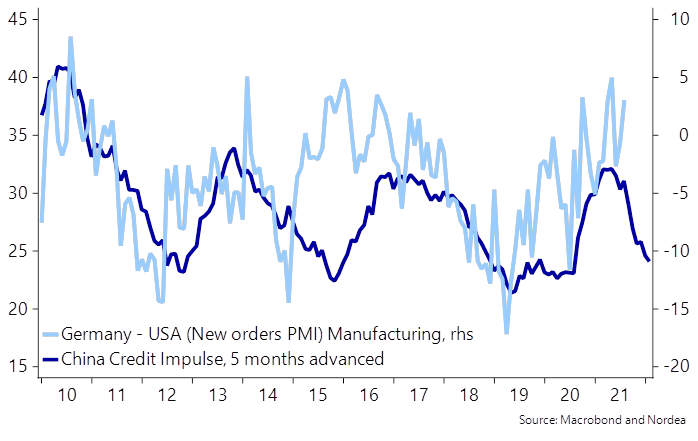
The above heatmaps also reveal that Europe (and the EUR) has more to lose from a sticky energy price crisis than the US, while China is placed somewhere in the middle. Especially German key figures will likely take a substantial beating on the combination of higher energy prices and lagged spill-overs from a slowing activity in China.
Chart 5. Chinas slowing economy a bigger issue for Germany than for the US
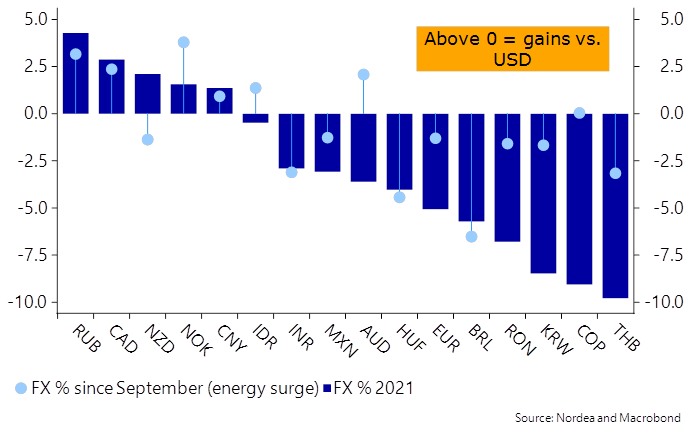
At the current stage of the energy crunch, the majority of energy trades are to some extend already priced in and warrant caution. Considering positioning and FX movements we see room for further appreciation for COP and AUD as positioning is less stretched.
While AUD usually exhibits a larger sensitivity to China the current energy crunch has contributed to a rebound in AUD compared to the KRW, why the AUD/USD and USD/KRW correlation has broken down. The potential is likely a bit smaller for the relatively more crowded energy trades such as long NOK and RUB. Needless to say, the latter two will remain resilient with elevated energy prices.
Chart 6. Relative FX winners and losers during the energy surge
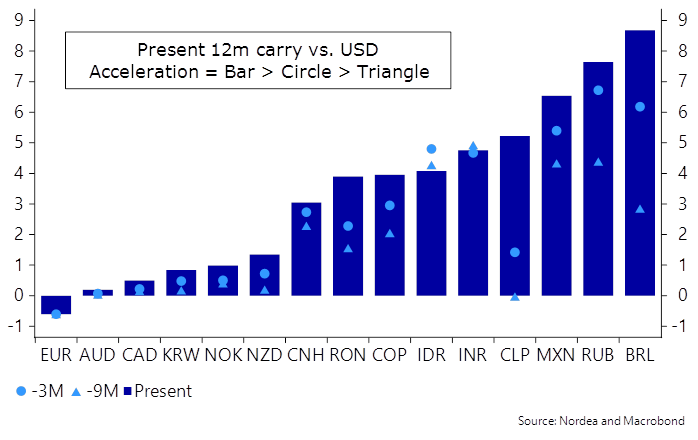
Considering the underperformance in KRW and THB we see little room for further FX deprecation, rather we see higher odds, that INR is next line for a beating if energy prices remain elevated. Looking forward we see a rationale in fading the energy trade via a long KRW but its yet too early to say with KRW being highly sensitive to the Chinese growth and global demand. In case of THB we remain pessimistic since sentiment is likely to remain sour given the outlook on tourism. For the time being we continue to see value in our short EUR/AUD and remain confident in our short CNH/RUB in both spot and carry terms.
Chart 7. We continue to like RUB as a energy carry trade
Front-end pricing of central banks is going bananas at the moment as everyone is throwing in the towel on the “transitory” inflation story as we have warned about since January this year. The energy crisis is currently exaggerating these trends, and we find that it makes sense to frontload inflation and rates expectations even more (5s30s to continue flattening in major curves).
The front-end repricing in USD and GBP are among the quickest since 2008 as 2yr rates in USD have moved faster than during the 2013 taper tantrum, while 2yr rates in GBP have moved the most on a monthly basis since 2009. We tend to tend think that it makes sense to front-load these expectations even more (e.g via clearly flatter 2s5s) as upside inflation surprises are going to continue during Q4 due to the energy crunch.

