
Nordea analyserer den såkaldte Credit Impulse, som er blevet særdeles lav, dvs. at nye kreditter som andel af den samlede produktion i de tre vigtigste økonomiske blokke – USA, EU og Kina – er blevet særdeles lav og negativ. Hvilken virkning har det på økonomien og markederne? Credit Impulse er blevet den bedste indikator for den globale produktion siden 2008. Der bliver altså mindre damp på produktionen (PMI). De cykliske elementer i væksten drives næsten udelukkende af kreditgivningen. En svag Credit Impulse styrker typisk defensive aktier, og der er en tendens til, at dollaren styrkes.
Global: How to position for a (clearly) weaker credit impulse?
The credit impulse has received a lot of attention as an asset allocation variable over the past years, and as the credit impulse is now clearly weakening, we go through how to position yourself for weaker credit growth.
The credit impulse variable has been widely debated as a global asset allocation variable in recent years due to the decently strong correlation to cross asset moves seen since 2011. It probably doesn’t come as a surprise to many of you that the impulse is now weakening (fast), as it almost couldn’t turn hotter than in the beginning of this year after cascades of combined monetary and fiscal support.
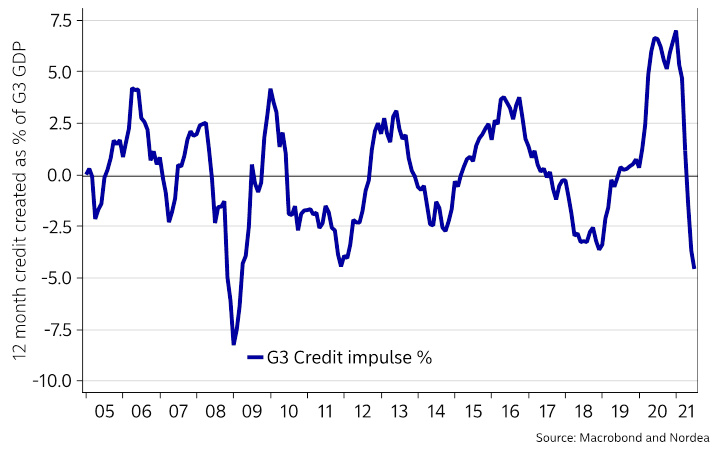
New credit as % of the gross domestic product in the G3 (China, US and Europe) peaked at almost 7%, which is clearly the biggest credit impulse provided to the economy on data since 2005.
What goes up, ultimately must come down (just ask Powell on inflation), and so goes for the credit impulse. The interesting thing is that the impulse is now clearly negative (a contraction of credit on the second derivate) likely as a result of a voluntary drawdown on the revolving facilities that were widely utilized during Q2/Q3-2020. In other words, credit growth is slowing fast as 1) liquidity facilities are not as needed now and 2) the impulse from the fiscal and monetary side is weakening in YoY terms. Gravity pulls.
The big question is if this is something to worry about. We think it warrants a shift in asset allocation trends.
Chart 1. The Credit Impulse is the weakest since 2008/2009 – should we worry?
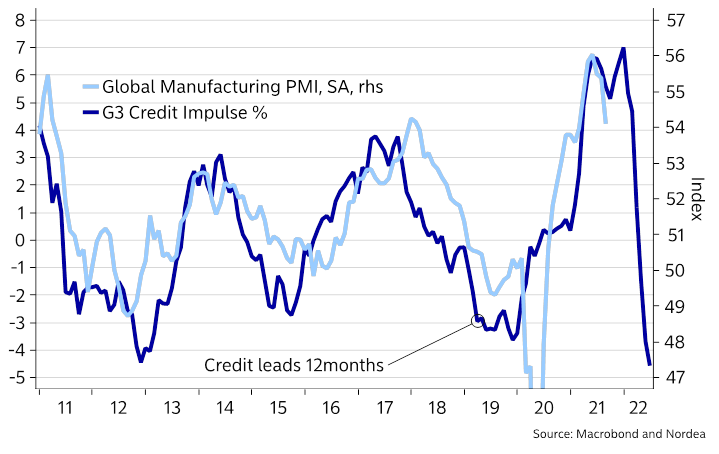
Why do we at all care about discussing the credit impulse from an allocation perspective? Well, first of all the impulse has been THE best leading indicator of the Global Manufacturing PMI since 2008, why it matters from a growth momentum perspective. In other words, the cyclical elements of the economy are driven almost solely by credit growth. This is in itself enough to care about the credit impulse as an allocation variable. A second layer of analysis is though needed.
Chart 2. The Credit Impulse leads the global manufacturing cycle
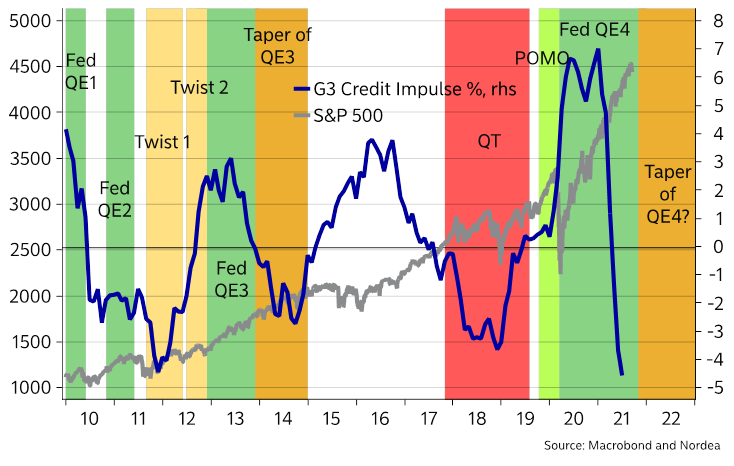
When the credit impulse weakens while central banks continue to ease, it need not be a negative scenario (for index levels of risk assets), while the true risk scenario is when the big central banks tighten during a decelerating credit creation such as during the QT period of 2018/2019.
That ultimately ended in a dash for cash risk meltdown event, while a credit deceleration that is paired with continued monetary easing (as currently) is more likely to create more orderly asset allocation shifts from value back to growth stocks, with moves out of EM and highly cyclical commodities/stocks.
Let’s have a look at how various assets usually perform in a credit deceleration paired with continued QE easing. Do note that this is a credit impulse stand alone analysis and there may be reasons why this time is different.
Chart 3. A credit contraction paired with monetary tightening (red area) is critical for risk assets, while it is clearly less frightening when paired with continued QE (green/orange areas)
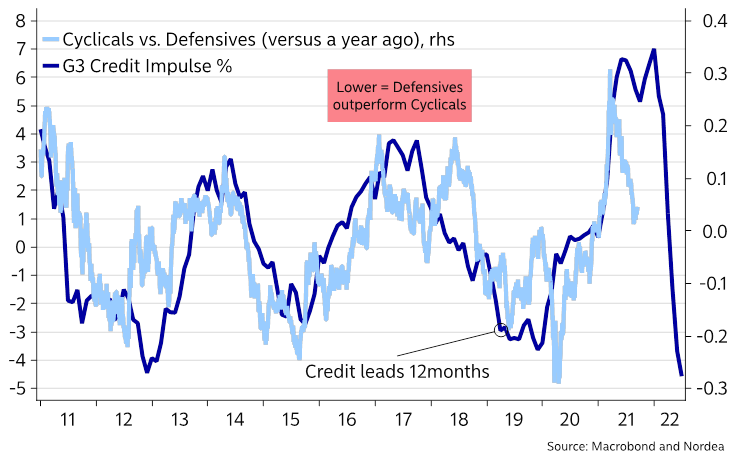
Overall, the credit impulse currently tells you to overweight defensives versus cyclicals and/or growth versus value, re-add a bit of duration exposure in Fixed Income space and to be long USD versus peers.
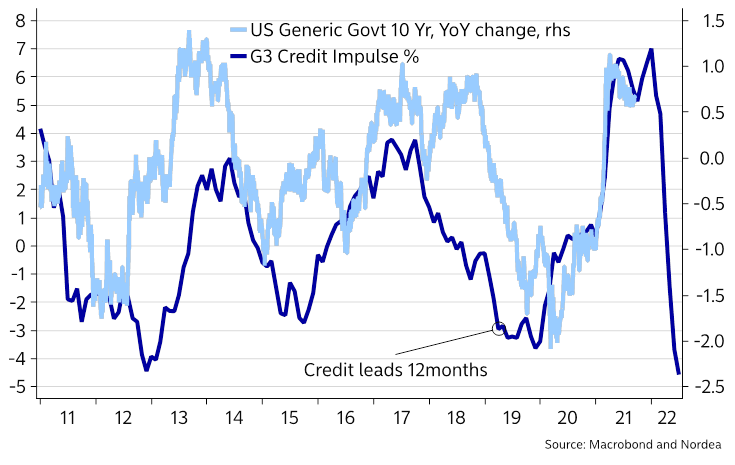
A slowing credit impulse tends to make Fixed Income instruments a better bet than in times of rapid credit creation. A slowing impulse is usually correspondent with a flattening yield curve, and decent longer-dated govie/credit performance, likely as the fading growth impulse often leads to a repricing of growth and inflation expectations.
Chart 4. Will a fading credit impulse lead to bond performance again?
Cyclically linked assets such as commodities (industrials) and energy/banking stocks tend to underperform a while after a weakening credit impulse, as the credit impulse is THE driver of the cyclical elements of the economy.
Chart 5. Weaker credit impulse -> lower commodities

Chart 6. Weaker credit impulse -> overweight defensives versus cyclicals
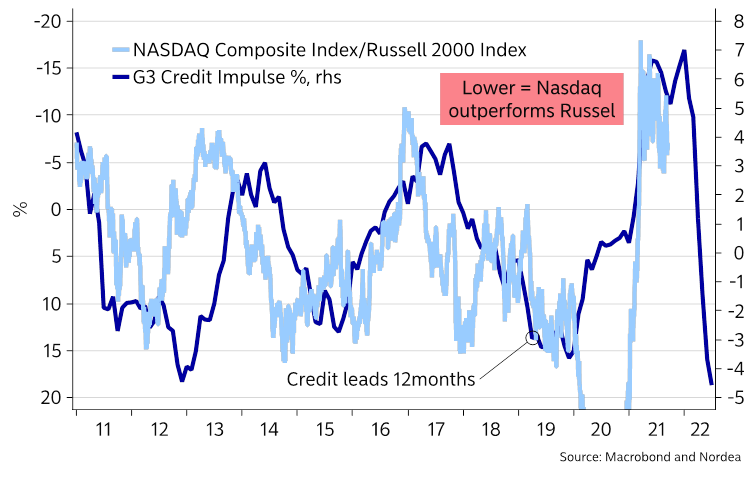
A weaker credit impulse also tends to be bad news for smaller cap versus large cap, and maybe more specifically good news for tech vs. the “old” economy. Nasdaq tends to outperform Russel 2000.
Chart 7. Russel underperforms versus Nasdaq when the credit impulse weakens
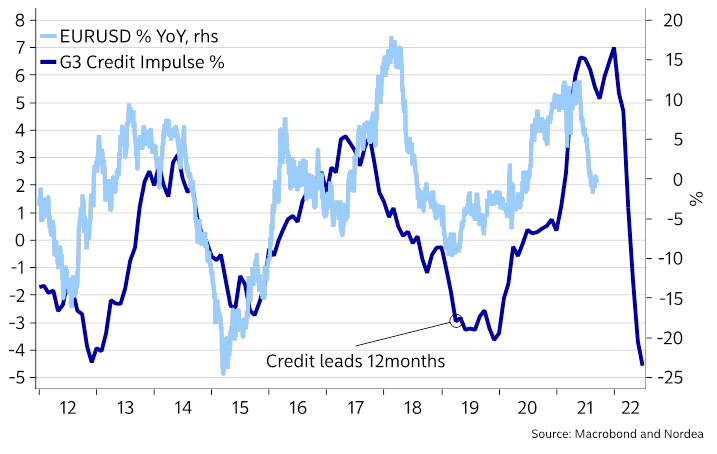
In FX space, the USD tends to gain when the impulse weakens, likely as USD is an anti-cyclical bet. We consider it likely that the USD will gain into the early parts of 2022, also as there is no real policy resistance from the Fed and the ECB to this view. Both central banks can live with a lower EURUSD reading currently.
Chart 8. Weaker credit impulse -> lower EUR/USD
The USD also tends to get more expensive in the FX basis during a credit deceleration, likely as a weaker credit impulse increases the risk of a dash for USD cash, why the market needs to reprice the risk of lacking USD liquidity via the FX basis.
Chart 9. A slowing credit impulse tends to make the USD more expensive in the xCcy basis
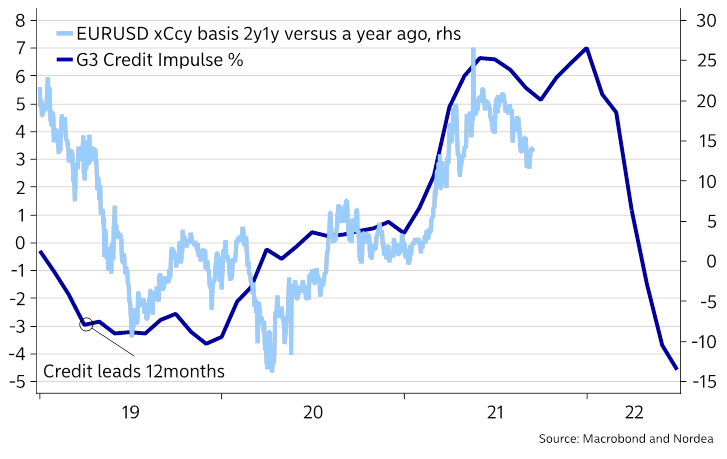
EM is also broadly speaking likely to underperform into a slowing credit creation as the USD richens and liquidity premias on the USD in the xCcy basis increase.