Nordea gennemgår risikoen for stigende renter i USA i de kommende måneder. Det er en temmelig langhåret analyse, men Nordea pointerer, at der er en reel risiko for stigende renter i løbet af få måneder, bl.a. på grund af centralbankens reduktion af T-bonds. Nordea sammenligner situationen med 2013, hvor centralbankchefen Bernanke tog fat på en gradvis nedtrapning af opkøbsprogrammet QE – kaldet taper tantrum i slangsproget – og det bankede renten i vejret. En tilsvarende udvikling kan komme nu, og Nordea kalder det taper tantrum 2.0. Det skal også ses i relation til en stigende inflation og den økonomiske genstart efter coronakrisen.
Global: Taper tantrum 2.0? Here is how to trade it in rates…
Inflationary vibes have led to a duration scare but how far are we from a 2013-like tantrum? We argue that risks are elevated and recommend paying the -belly of the USD-curve as a consequence. USD-EUR spreads will likely increase further.
Most of us recall the taper tantrum and how it began with Chair Bernanke hinting of tapering QE3 purchases in May 2013. The markets responded by pricing a swifter Fed lift-off of more than 125 basis points over the next 3 years.
In September 2013, the Fed ended the taper tantrum by delivering a huge dovish surprise in which it postponed its taper process, thereby regaining control of the short-to-medium term Fed funds expectations, but it was not without a major scare first.
The million USD question is then, how far are we from a similar duration scare or taper tantrum this year? Probably closer than you think! We will try to convince you why in this piece, while looking at the lessons learned from 2013 and how to trade it!
Chart 1. Taper Tantrum led to swifter lift-off expectations
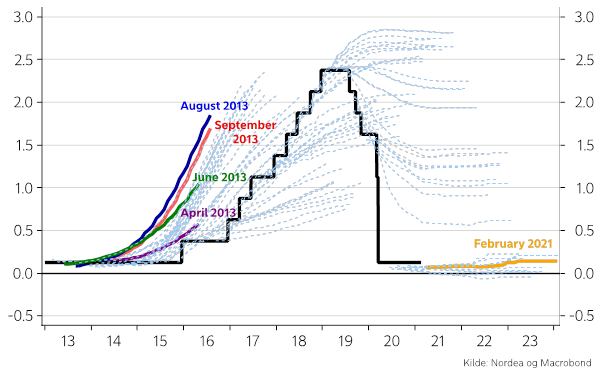
In short, 2013 tells us that the Fed struggles to separate tapering of asset purchases and lift-off expectations. What is clearly different today is the Feds introduction of Average Inflation Targeting.
So far this has kept lift-off expectations muted despite an increase in term premiums and long-term rates/inflation expectations, but, and that is a big but, the average inflation targeting regime (with vague mechanics and no actual proposal of a mathematical reaction function) has yet to be tested. This is likely to happen during Q2 2021.
Chart 2. Inflation outlook is starting to look HOT ahead of Q2
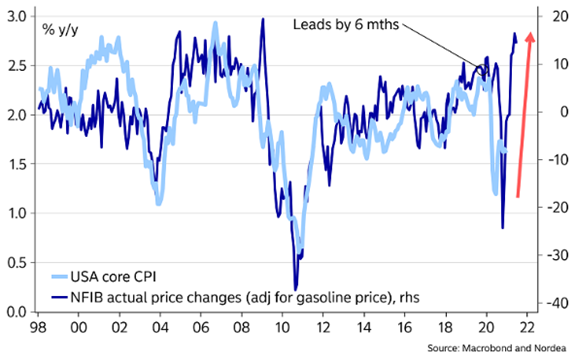
We see several interesting similarities to the fundamental backdrop ahead of the taper tantrum in 2013, why we find 2.0 taper tantrum risks elevated. Back in 2013, positive data surprises during 2013, in combination with the proposed tapering from the Fed, gave rise to a huge bond market sell-off. Today, the upcoming reopening of the economy thanks to wide-spread vaccinations coupled with leading indicators pointing towards a strong growth and inflation rebound increases the likelihood of a similar bond sell-off.
Markets will likely again find it hard differentiate between tapering and a quicker future lift-off, should the Fed be “forced” into debating the balance sheet during Q2 due to elevated CORE inflation.
How to trade a tantrum 2.0? Pay the USD-belly or pay 4y1y USD – EUR spreads
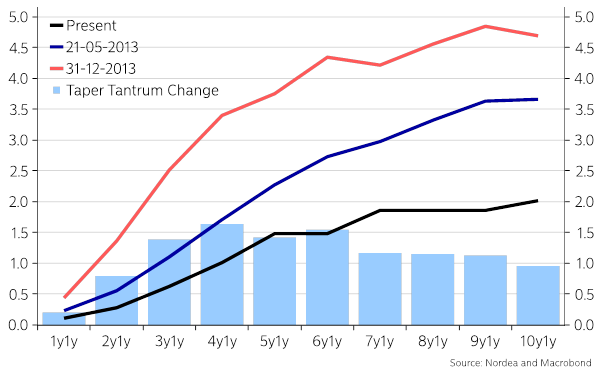
Using 2013 as our playbook, we expect a 2.0 taper tantrum to move rate markets significantly around the belly of the USD forward curve as medium-term lift-off expectations gather pace. In 2013 the belly moved some 150 bps (in the 4Y1Y-6Y1Y sector), while e.g. 1Y1Y or 10Y1Y moved substantially less. 1Y1Y vs. 4Y1Y steepeners or paying 6Y1Y while receiving 1Y1Y and 10Y1Y may be bets that are well equipped to tackle a tantrum 2.0.
Chart 3. Taper bloats the belly of the curve
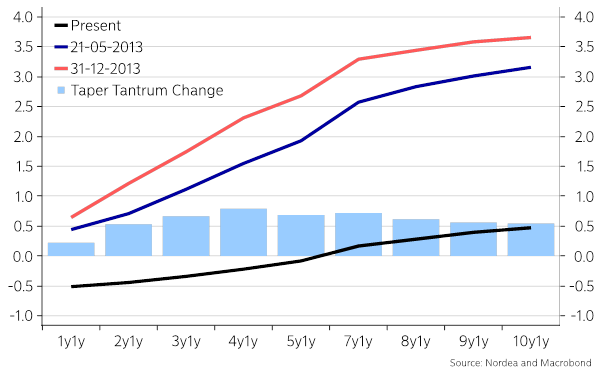
Naturally, the changes in the rate expectations in the USD forward curve carry spill-over effects to EUR curve. Zeroing in on the EUR forward curve in 2013, however, reveals moderate increments in the ratio of 1:2 compared to the USD curve, and the EUR curve sensitivity to USD-curve developments has likely not increased since; rather the contrary.
We see two reasons for a more material relative widening of the USD-EUR forward curve in the case of a 2.0 taper tantrum: First, the EUR curve was more alive and kicking back in 2013 as the ECB didn’t launch its QE program until 2015. Second, the ECB and the Fed’s QE programs are not even close to being in sync and the growth rebound and inflation expectations are on different planets in the Euro area and in the US.
This argues for increasing maturities on existing FX hedges of USD assets and/or spread-trades betting on wider 4y1y USD-EUR spreads.
Chart 4. Tantrum spill-overs to the EUR curve but with less sensitivity
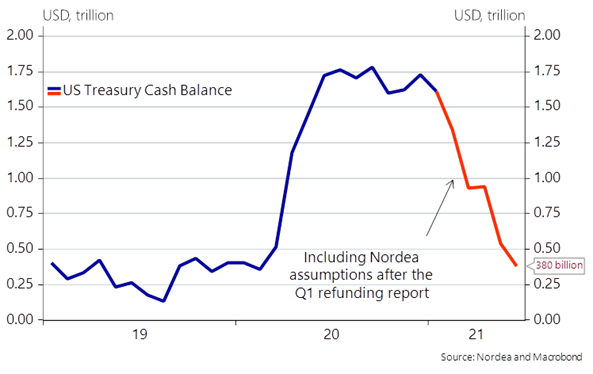
On top of the tantrum risks, we also envisage a possible melt-up in USD liquidity as the US Treasury now intends to bring down the Treasury General Account (TGA) swiftly over the coming months (Global: Brace yourself.. USD liquidity is coming).
We estimate a funding need of >$1400bn for the coming two quarters, which means that the US Treasury cash account will be taken more than >$1000 bn lower (due to a very low issuance pace dictated in the most recent quarterly refunding report) and the commercial banking system will be on the receiving end of the liquidity.
This will lead to a drawdown (read underfunding) on the TGA by >$250bn in February, >$400 bn in March and >$400bn again in May, in turn leading the TGA towards sub $500bn territory by the end of June. This is marked game changer for the USD liquidity outlook as commercial banks will be on the receiving end of the liquidity addition.
Chart 5. The TGA will likely fall to sub $500bn levels by summer
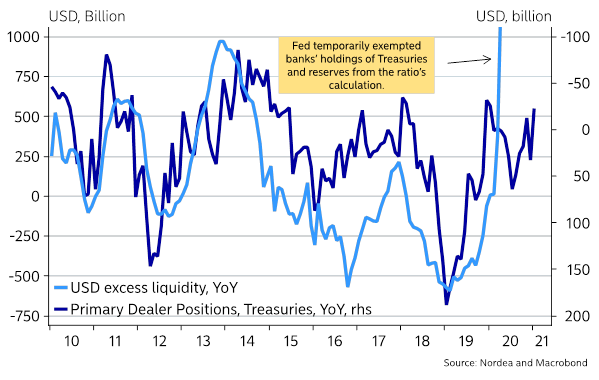
The huge increase in excess reserves in commercial banks may end up impairing banks willingness to hold Treasury positions, and we see a strong reverse relationship between reserves and primary dealer positions in US Treasuries since 2010. The correlation broke down when the Fed temporarily exempted banks’ holdings of Treasuries in the leverage ratio.
This exemption is due to run out 31st of March pending on further decisions taken by the Fed, which may influence banks Treasury holdings due to the influx of reserves stemming from the drawdown of the TGA. This could be potential big negative news for bonds on top of the rising inflation and risk of a tantrum scare.
Buckle up!