Nordea tager en kritisk og lettere ironisk indgang til den herskende optimisme på markederne, og især til den meget optimistiske tone fra den amerikanske centralbankchef Jerome Powell, der ikke er bekymret for en stigning i inflationen, som han betragter som et forbigående fænomen. Ja, til sidst dør vi alle, som Nordea udtrykker det. Solen slukkes også om 7,5 milliarder år. Men i mellemtiden kan det gå anderledes, end de fleste og centralbankernes ypperstepræst mener, og det tager Nordea under vingerne i en række grafer og kommentarer.
Uddrag fra Nordea:
Powell is right, in the end we are all going to die!
We find risks of very substantial inflation this summer when we summon our inner doom-mongers, but everything is transitory for Powell, it seems. Perhaps volatility is simply priced too cheaply given the yuuuge outcome space?
In our sister product, the week ahead, we mulled, if we are not experiencing something akin to a crack-up boom as the Austrian’s (Mises, Rothbard, …) describe it. The latest FOMC decision at least did nothing to assuage such fears – everything is transitory for Powell, it seems. From what we gather he’s kind-of right. At some point the sun will kill all life on Earth (7.5bn years into the future – unless Elon moves the planet…), but beyond that there’s likely heat-death of the Universe (we’re not as sure Musk can “fix” that).
Chart 1. Buy lumber, wear diamonds?(!)
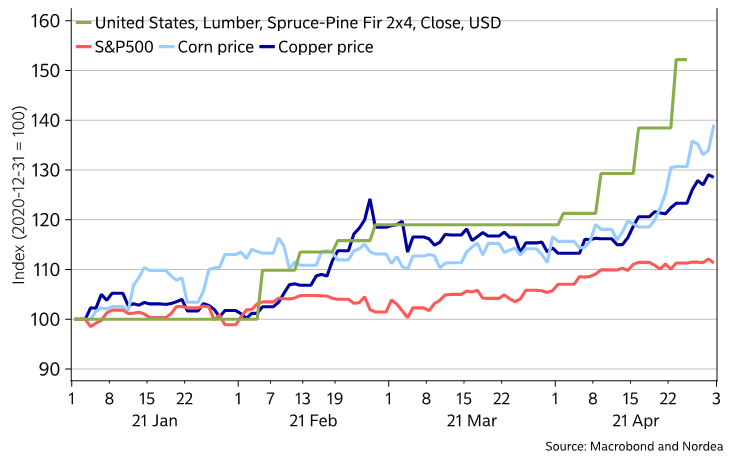
Anyway, if we are in for such a boom (or doom-loop), then being long equities and short duration is likely to remain a good idea (to protect wealth in real terms if policy makers then keep on creating too much nominal smoke). Perhaps even some other assets that must not be mentioned are worth being long, as we are sure the “good luck staying poor”-crowd will be quick to remind us of…
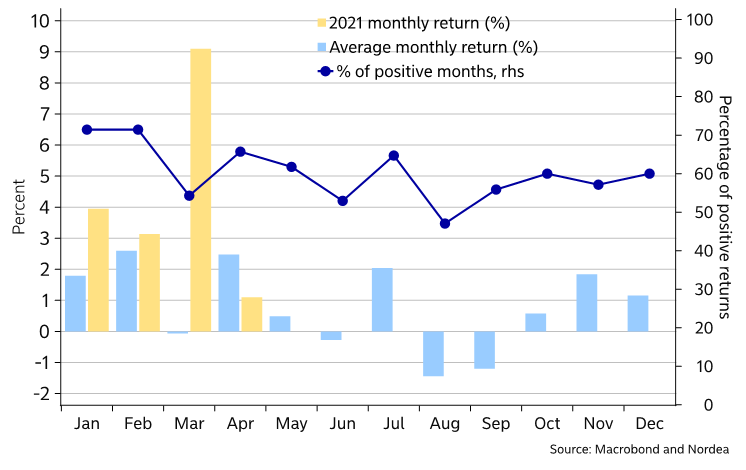
If on the other hand this is all business as usual, then at some point frothy markets will correct (nominally) lower. The only thing we know is that no one knows when the music stops… What we do know is that equities historically behave less benign (for stock-holders in the June to September period), which lies behind the “sell in May and go away”-meme.
Chart 2. S&P500 seasonality (1951-2021 data)
We would also like to remind our readers of the ongoing IPO boom, Global: could the IPO boom smash risk appetite?. The below chart is a new one, looking at market-cap weighted expirations of non-SPAC IPOs. This is potentially another wall to worry about come September as the lock-up expiration volume is material!
Chart 3. Nasdaq composite vs the end of lockup periods after “normal” IPOs
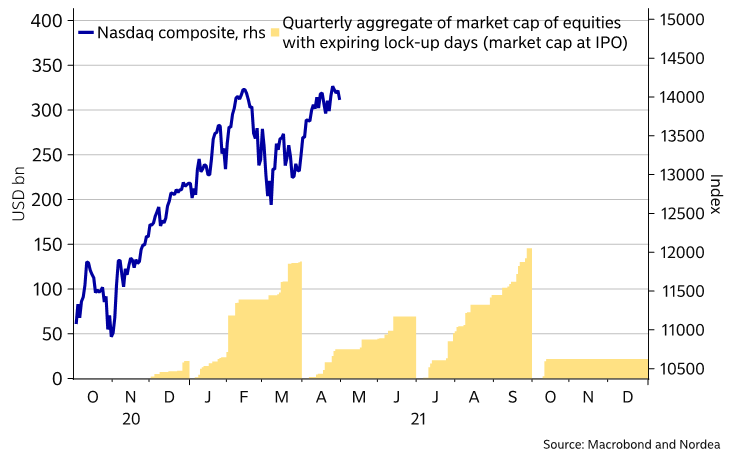
While the rise in US yields was likely the main reason behind a shakier Nasdaq index in the first quarter – as Gordon’s formula implies, the weakness did coincide with plenty of lock-ups ending for IPO insiders. The chart actually suggests that the second quarter should be fairly smooth sailing compared to the first quarter, if potential insider selling matters – and assuming yields remain stableish. The wall of Q3 looks more worrying.
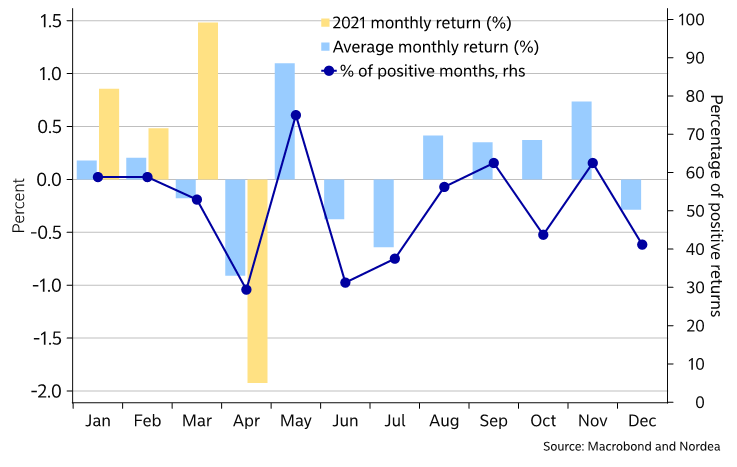
Chart 4. OMXS30 seasonality (1986-2021 data)
While in the US there’s the “sell in May and go away” meme, In Sweden there’s a slightly different saying: “buy for the herring and sell for the crayfish”. Perhaps it should read say sell for the surströmming? The historical seasonality in the main Swedish equity index OMXS30 is slightly different to that of the S&P500’s. July is the fourth best month of the year for equities, perhaps as local market participants genereally spend their time elsewhere than ahead of their trading terminals. Still, the May to September period still looks weaker than the other more wintery period – much akin the US pattern.
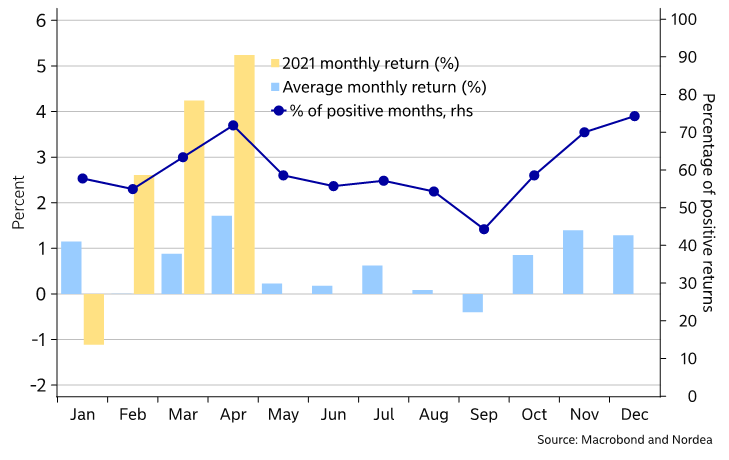
Chart 5. BBDXY seasonality (2005-2021 data)
While on the topic of seasonality, we’ll include a chart on the dollar. April is historically the worst month of the year for the dollar, while May is, again, the best month of the year – both when looking at hit ratios (% of positive months) and at the average monthly return. We remain proxy-short EUR/USD via our USD/SEK longs, and we still hold on to those ahead of a better season for the USD.
Chart 6. Core inflation surprises likely
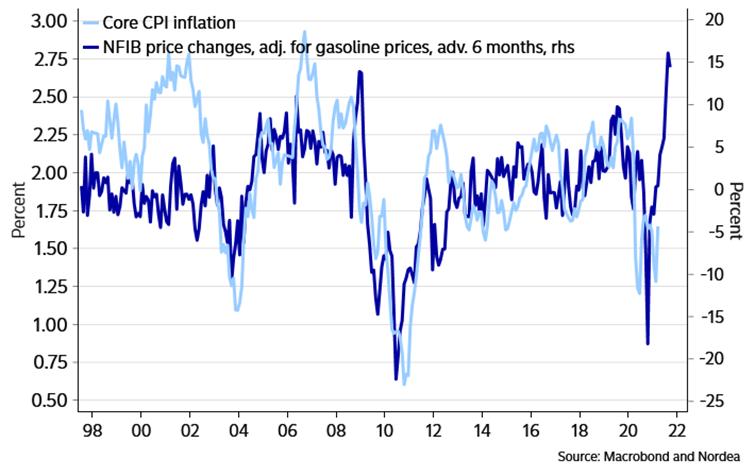
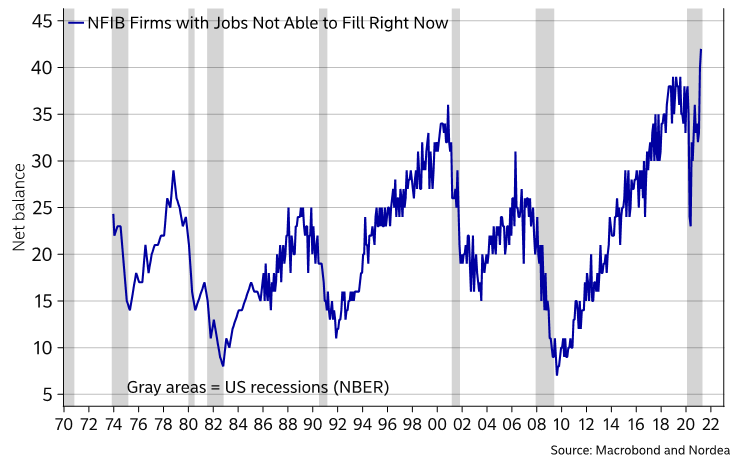
We suspect that core inflation could surprise positively in May, when the April reading is due. The same applies for near-term US employment growth, which might be helpful for the dollar in May. The small business survey NFIB has reported two months in a row with record-high difficulties to fill jobs (on data since 1973). Perhaps this might even augur some surprising wage growth? Workers haven’t been in a better negotiation position in decades.
When was the last time you heard about fast-food chains offering sign-on bonuses for cashiers? This is now happening in e.g. Florida with 400$ sign-ons being offered in low skilled service sector jobs. Maybe it’s just much harder to compete with Biden-nomics for employers than anticipated, but Powell will surely deem that this is a “transitory” phenomenon for now.
Chart 7. NFIB jobs not able to fill has been record high two months in a row
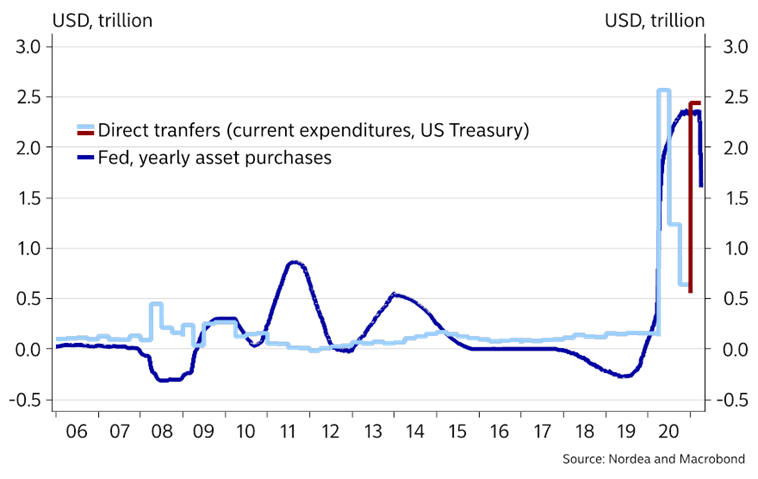
The big wage inflationary game-changer is the direct transfers, as it works as a smooth redistribution mechanism of all of the USDs printed by the Federal Reserve during 2020. This is a big change compared to the asset swap QE1, 2 and 3, which were not paired with a fiscal redistribution mechanism and therefore only ended up inflating financial assets. Direct transfers may significantly alter that conclusion as BOTH real and financial assets seem to inflate this time.
Chart 8. Direct transfers = QE size – the perfect redistribution loop
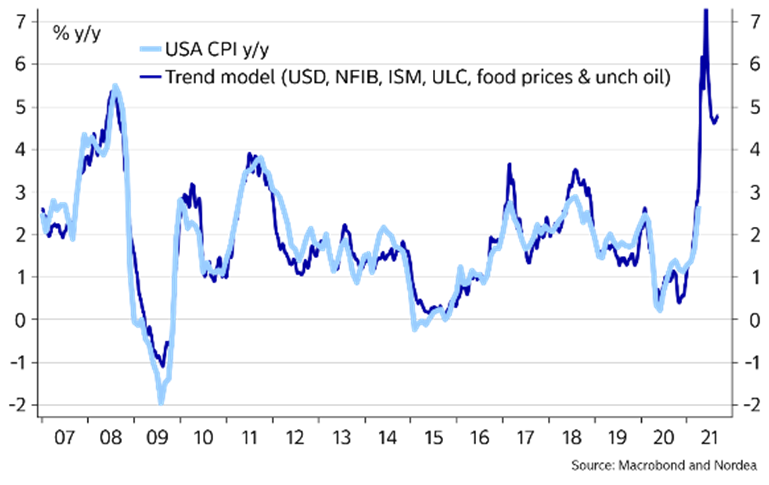
When we summon our inner doom-mongers (Steno dons that hat more often than Enlund), then we could even envisage >6% inflation by late summer. Our trend model that, among other variables, includes the USD, NFIB, ISM prices and food prices hints of >7% this summer. It looks too bad to be true, but if everything is in a bottle-neck at the same time, then price pressures can turn fairly violent.
We know how e.g. lumber, oil and food prices have risen markedly, and there is anecdotal evidence of substantial bottle-necks ín other sectors as well. It will be tough to explain such inflation readings away for Powell, but he will probably do his best to find arbitrary transitory explanations.