Nordea mener, at præsident Trump vil gøre Kina til hovedtemaet i valgkampen. Derfor venter Nordea mere “China bashing” i den kommend tid med en stadig mere intenst spænding mellem de to supermagter – eventuelt med flere konsulatlukninger. De geopolitiske spændinger er steget den seneste tid. Det vil normalt styrke dollaren, men det sker ikke nødvendigvis denne gang.
Houston, we have a problem
Alas, the happy days of geopolitics proved to be short-lived. A whole cascade of confrontational news thus arrived with an unproductive fifth round of Brexit negotiation talks, China and UK fighting over Hong Kong’s security laws (even banning Premier League broadcasting right before the last match of the season!) and the US ordering the Chinese consulate in Houston to close for stealing intellectual property.
The US is now also pondering on whether to close the US consulate in – surprise, surprise – the hometown of the “China Virus”, Wuhan. It is safe to say that The Donald is warming up to the November election. We suspect his hope is to make China THE number one topic at the election, why we should expect more China bashing ahead.
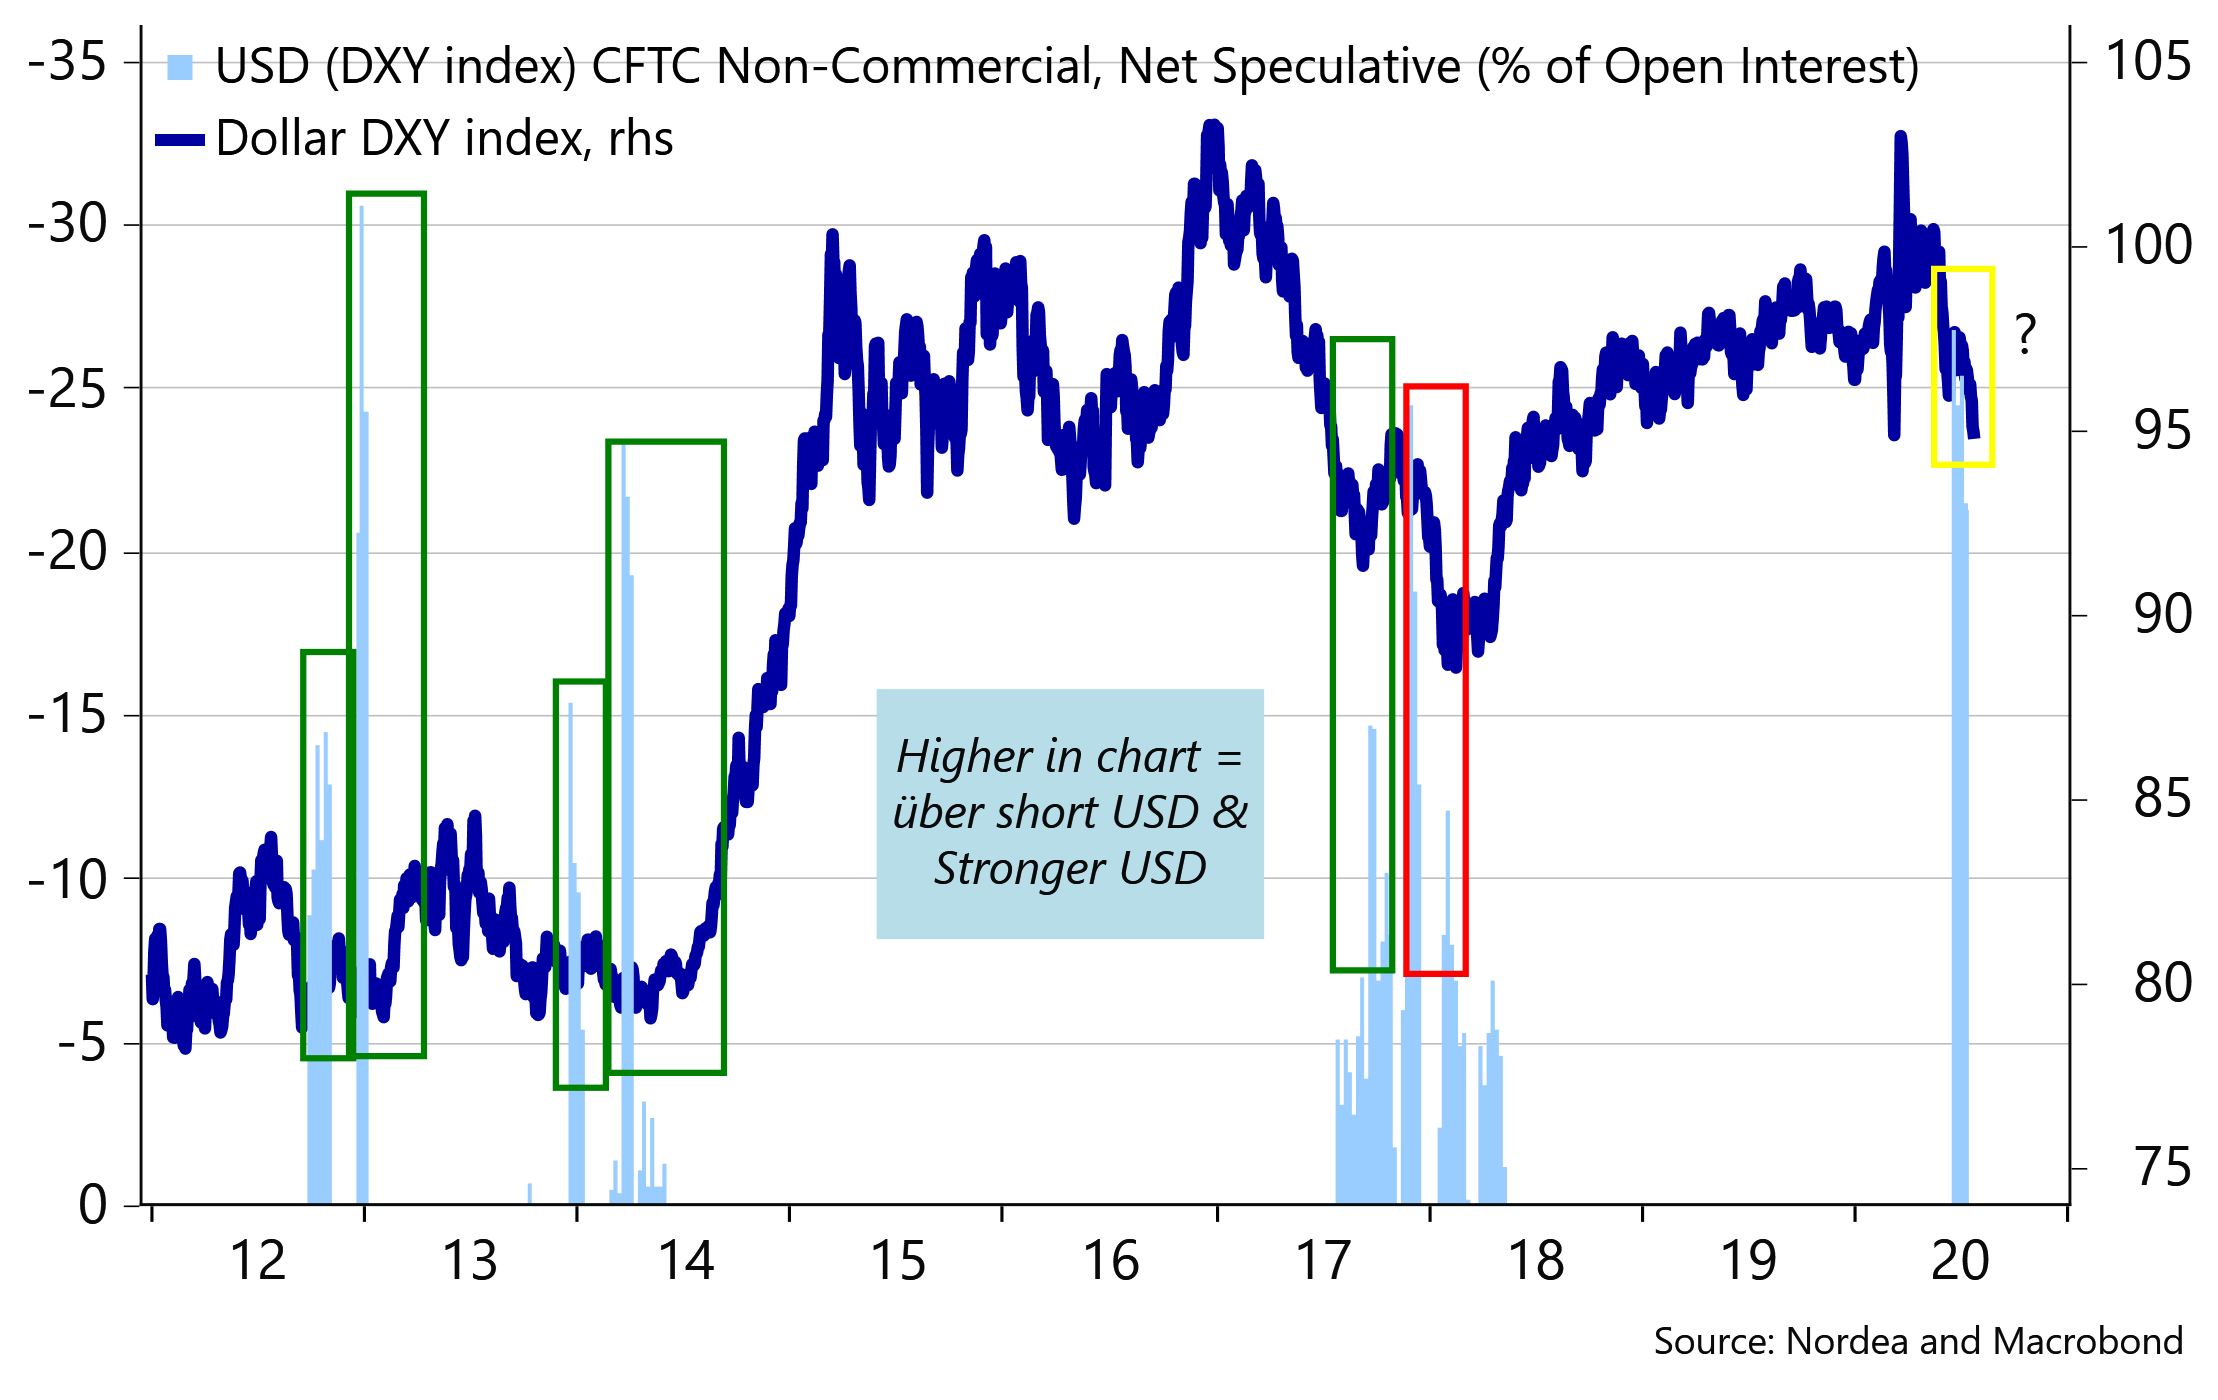
What is bad for geopolitics is usually good for the dollar, but apparently not this time around. The broad dollar index DXY is approaching year-to-date lows, while also being one of the most shorted in G10. Our inner contrarian does, however, suspect the dollar could find its footing in the very short run (although we still have a strategic mid-term higher EUR/USD forecast). Hence, such stretched short speculative dollar positioning has in four out of five cases over the past eight years been followed by a stronger dollar.
Chart 1. Four out of the last five times since 2012 – when short USD positioning was also super stretched – the USD gained. Will markets be wrong-footed again?
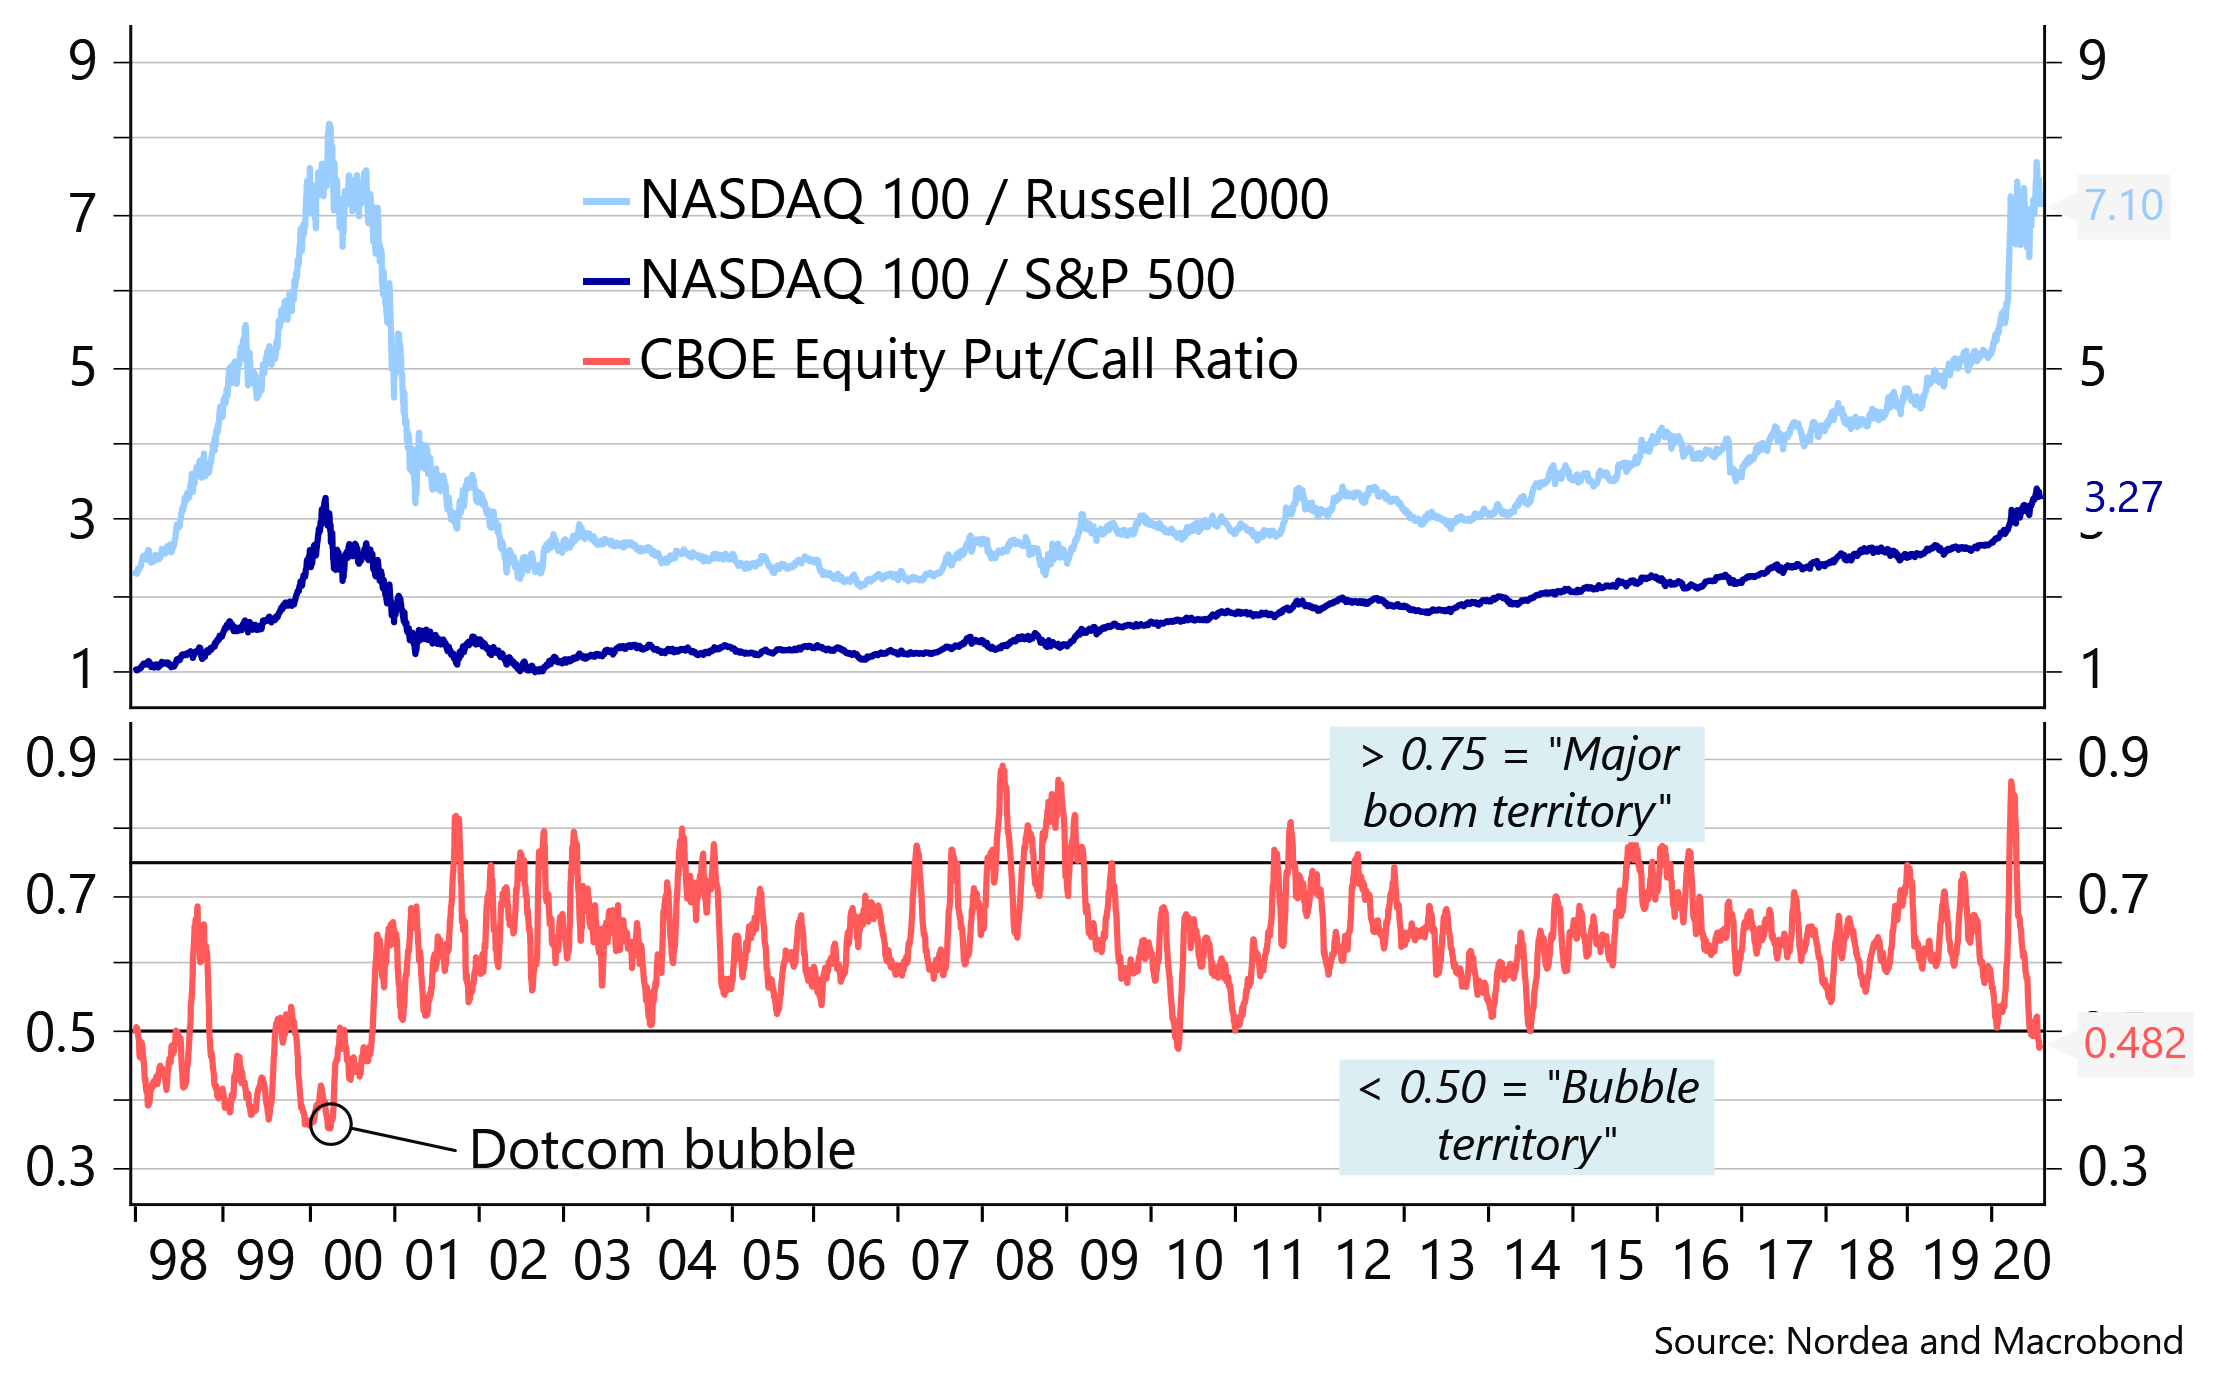
Equity markets also appear so far to be fairly complacent about the rising geopolitical risks. Nasdaq 100 posted new records this week (before the small setback Thursday evening) as tech stocks continue to (literally) party as if it was 1999 (see Chart 2). Various bubble measures such as put/call ratios, fear and greed indices and market caps relative to GDP are all beginning to flare up, but for now markets are fully committed to the narrative of the Fed’s printing press and credit-Oprahnomics saving everyone and their mother.
Chart 2. Nasdaq posting new records this week, while various bubble measures are on the rise
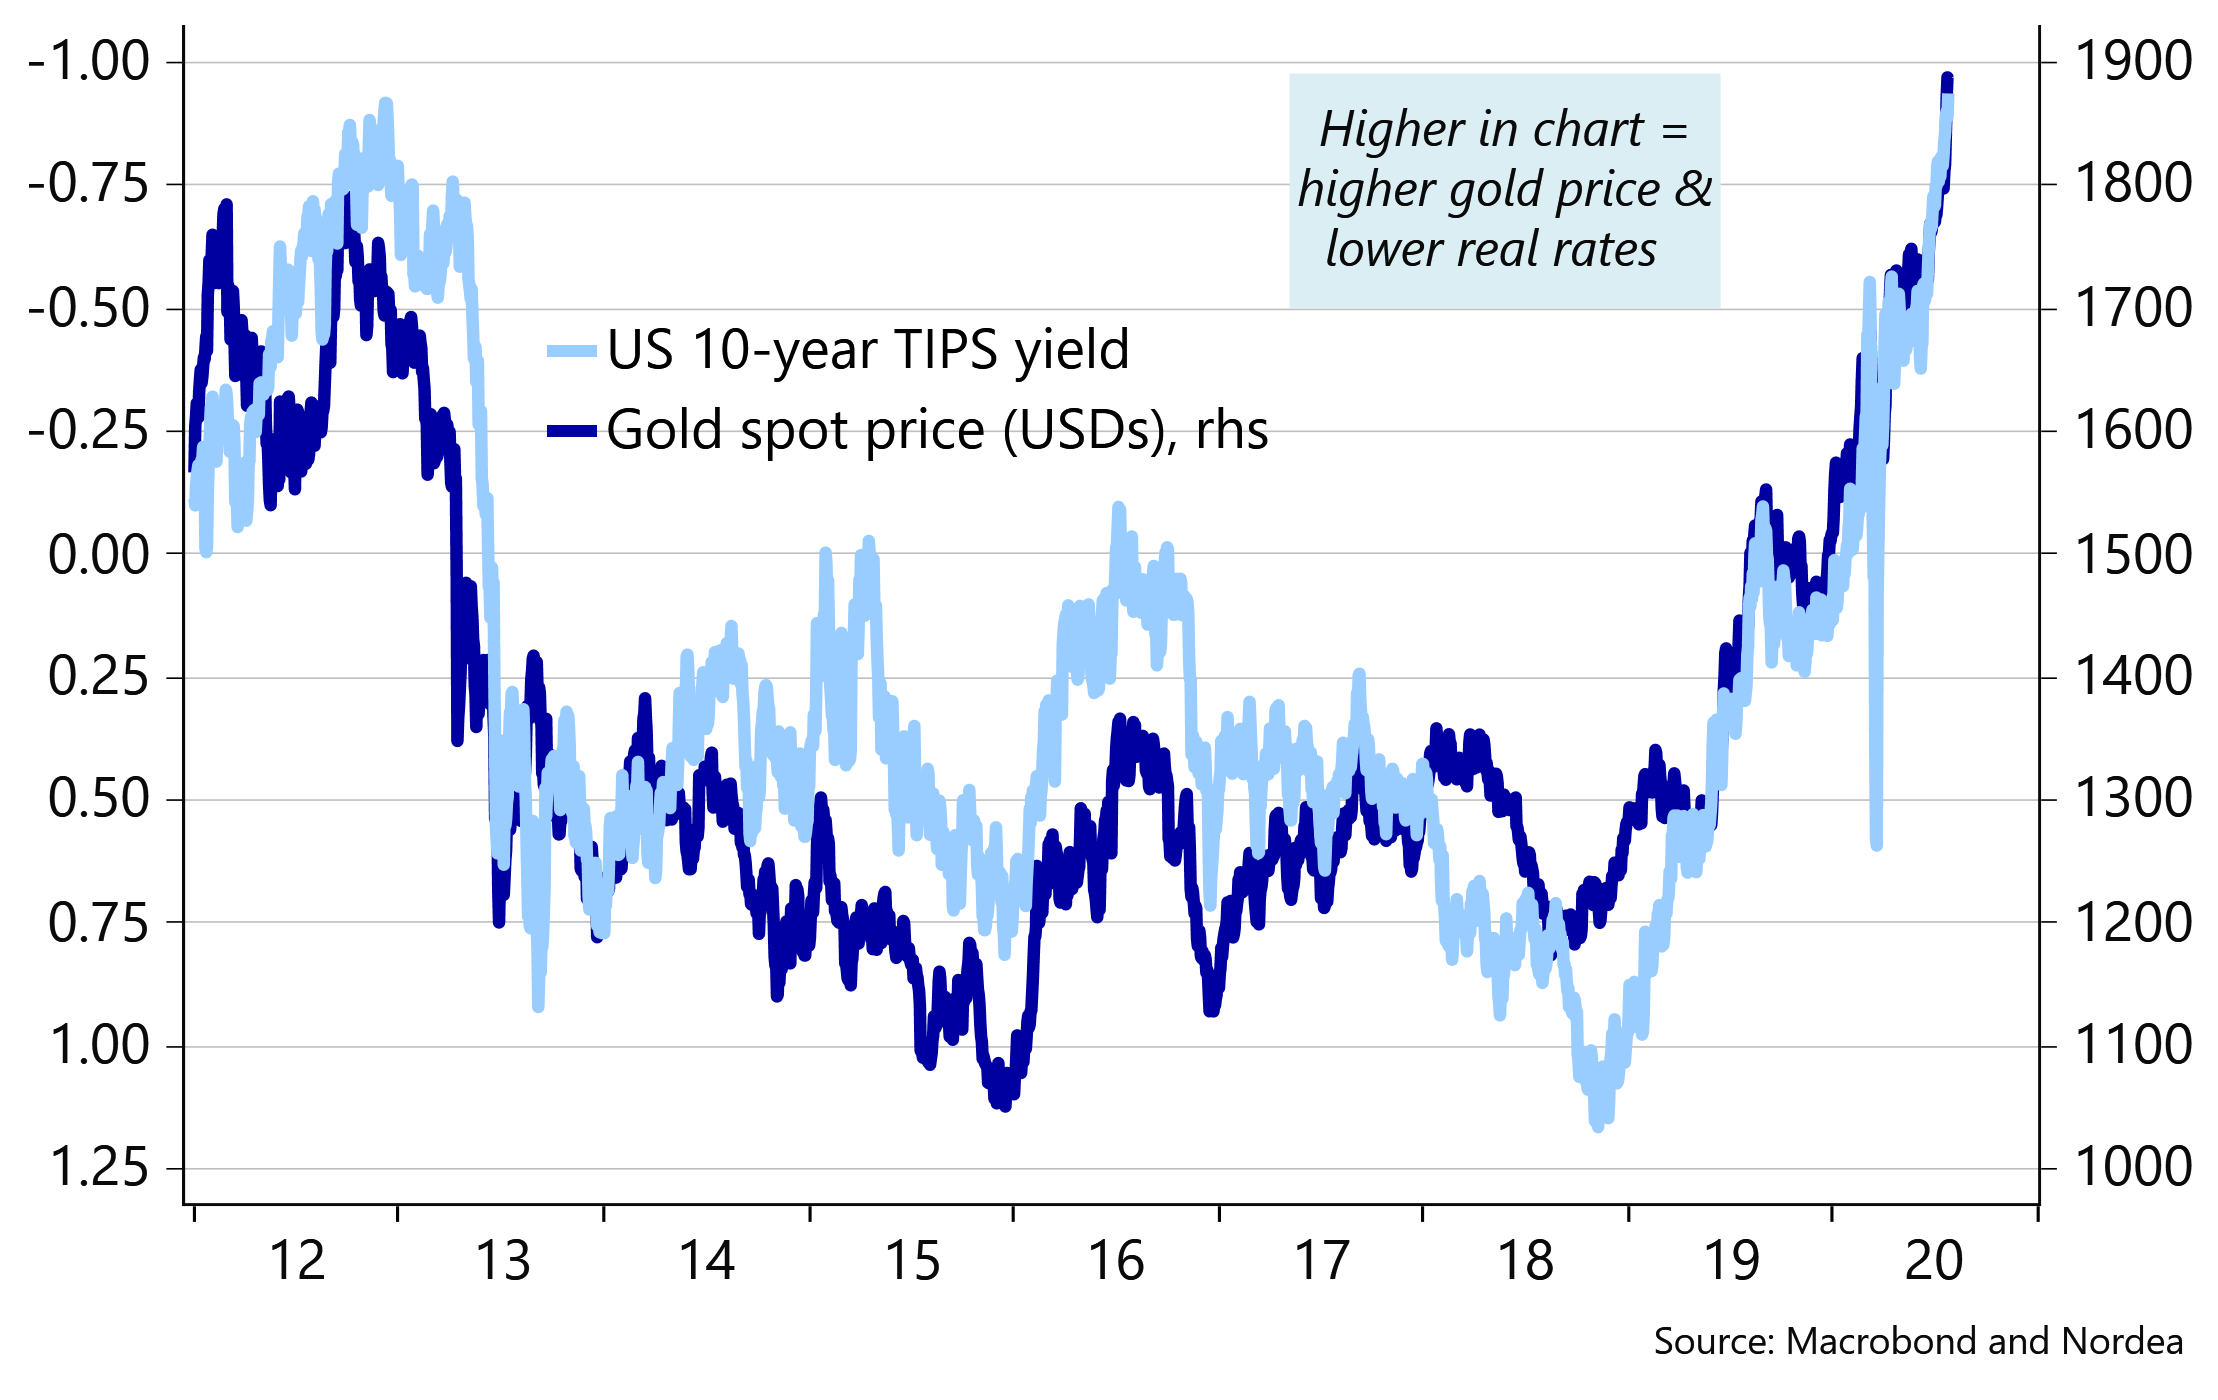
Staying on the subject of breaking records, the US 10-year TIPS yield reached its lowest point ever on Thursday as investors continue to increase their long-term inflation expectation bets. In turn, the cocktail of low real yields, a weak dollar and rising geopolitical risks has put a bid on precious metals, with gold prices trading close to all-time highs. Perhaps it is finally time for the US to return to the gold standard as this week’s Senate Banking Committee-approved Fed nominee Judy Shelton has once argued (read: NOT!)
Chart 3. Low real yields are pushing gold higher
It seems as if investors have decided to just be long everything possible (equities, credits, bonds, gold, oil etc) and forgotten about normal correlations. We are, however, a bit sceptical about whether this is truly a good strategy. Perhaps it is time for equities to stop defying gravity and “give a call to Houston”?
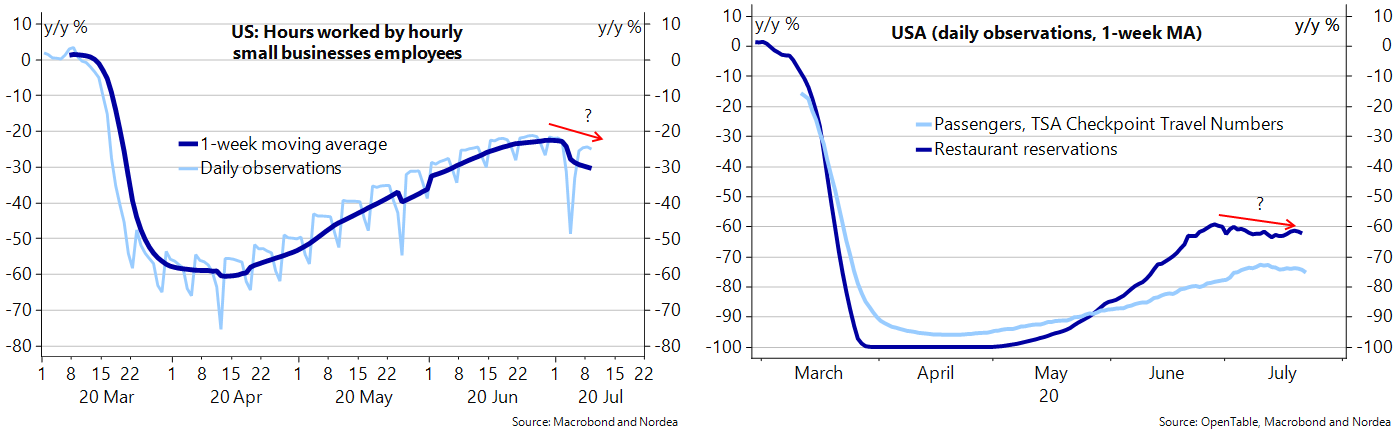
The rallying in equity markets has thus not only been the doing of the Fed, but also due to a sequential improvement of economic data – a story which may soon face some headwinds. Hence, several high-frequency data have begun to stall or even turned worse over the past couple of weeks (initial jobless claims, NY Fed WEI, Main Street hours worked, small business openings etc.).
In other words, the coming weeks could challenge the view among the V-shape believers as negative data surprises may pop up, meaning that economic surprise indices will finally mean-reverting from all-time high levels. This is usually a risk-off signal.
Charts 4 and 5. High-frequency data – hiccups or the start of a W?
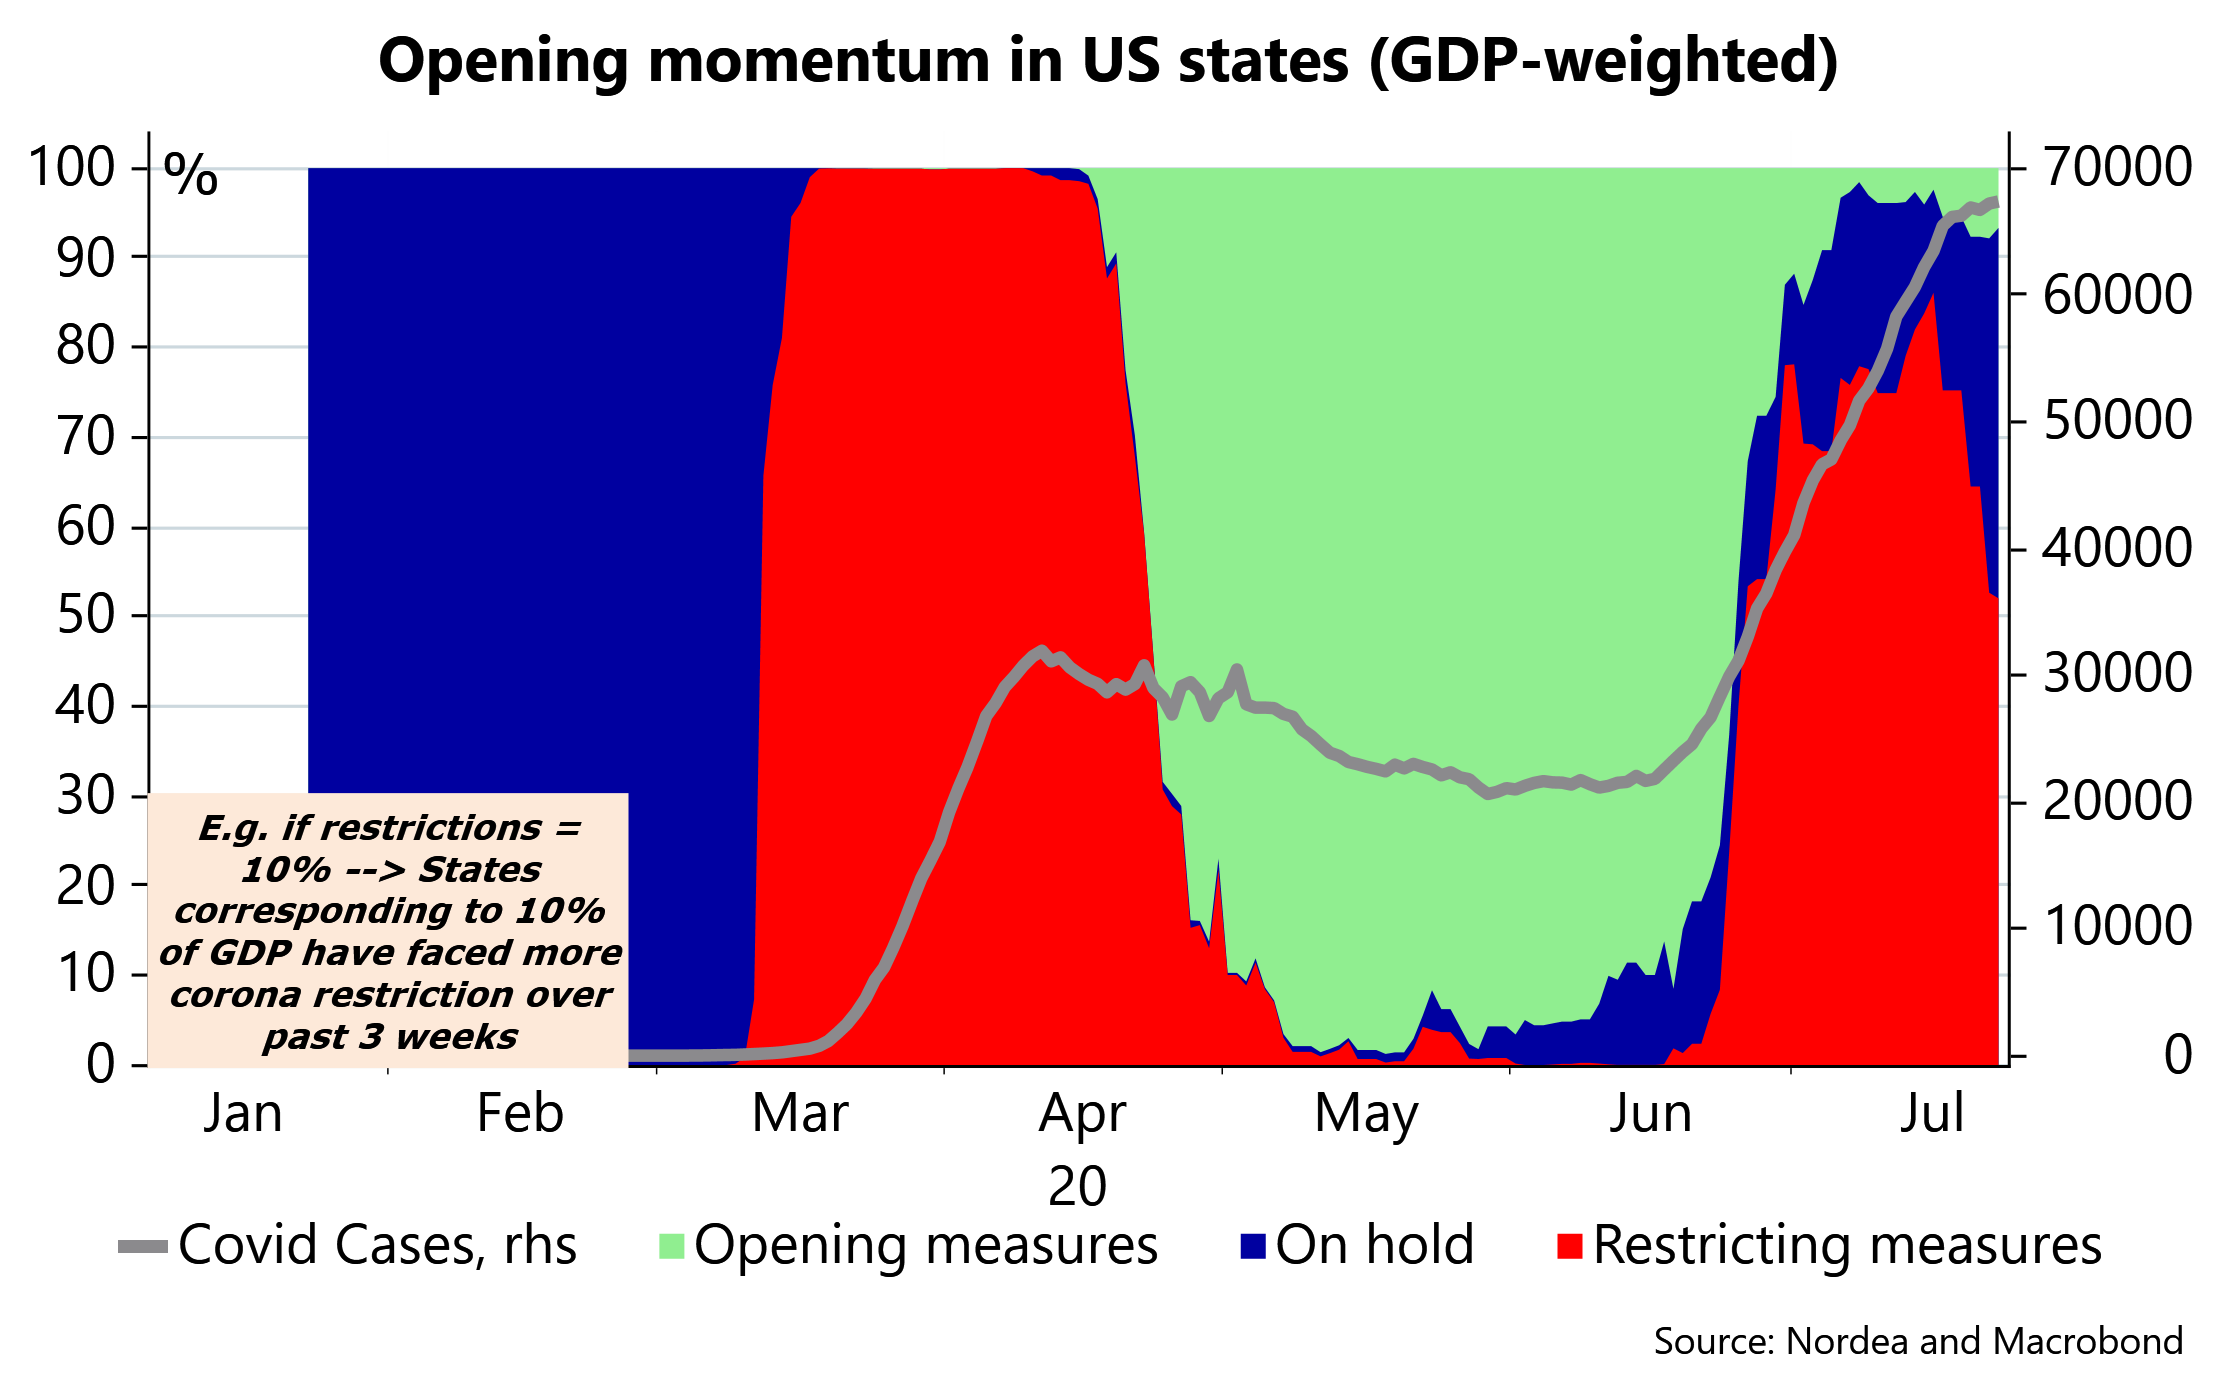
The obvious reason for the weaker high-frequency data can unsurprisingly be linked to a less benign reopening momentum as coronavirus cases have spiked in recent weeks. According to our newly developed coronavirus restriction gauge, states corresponding to a total of 84% of US GDP have thus faced increased restriction measures during July, while almost no states are in the midst of opening up more. This should have a negative lagging effect on the macro momentum.
Charts 6. States corresponding to 84% of US GDP have faced increasing coronavirus restrictions during July
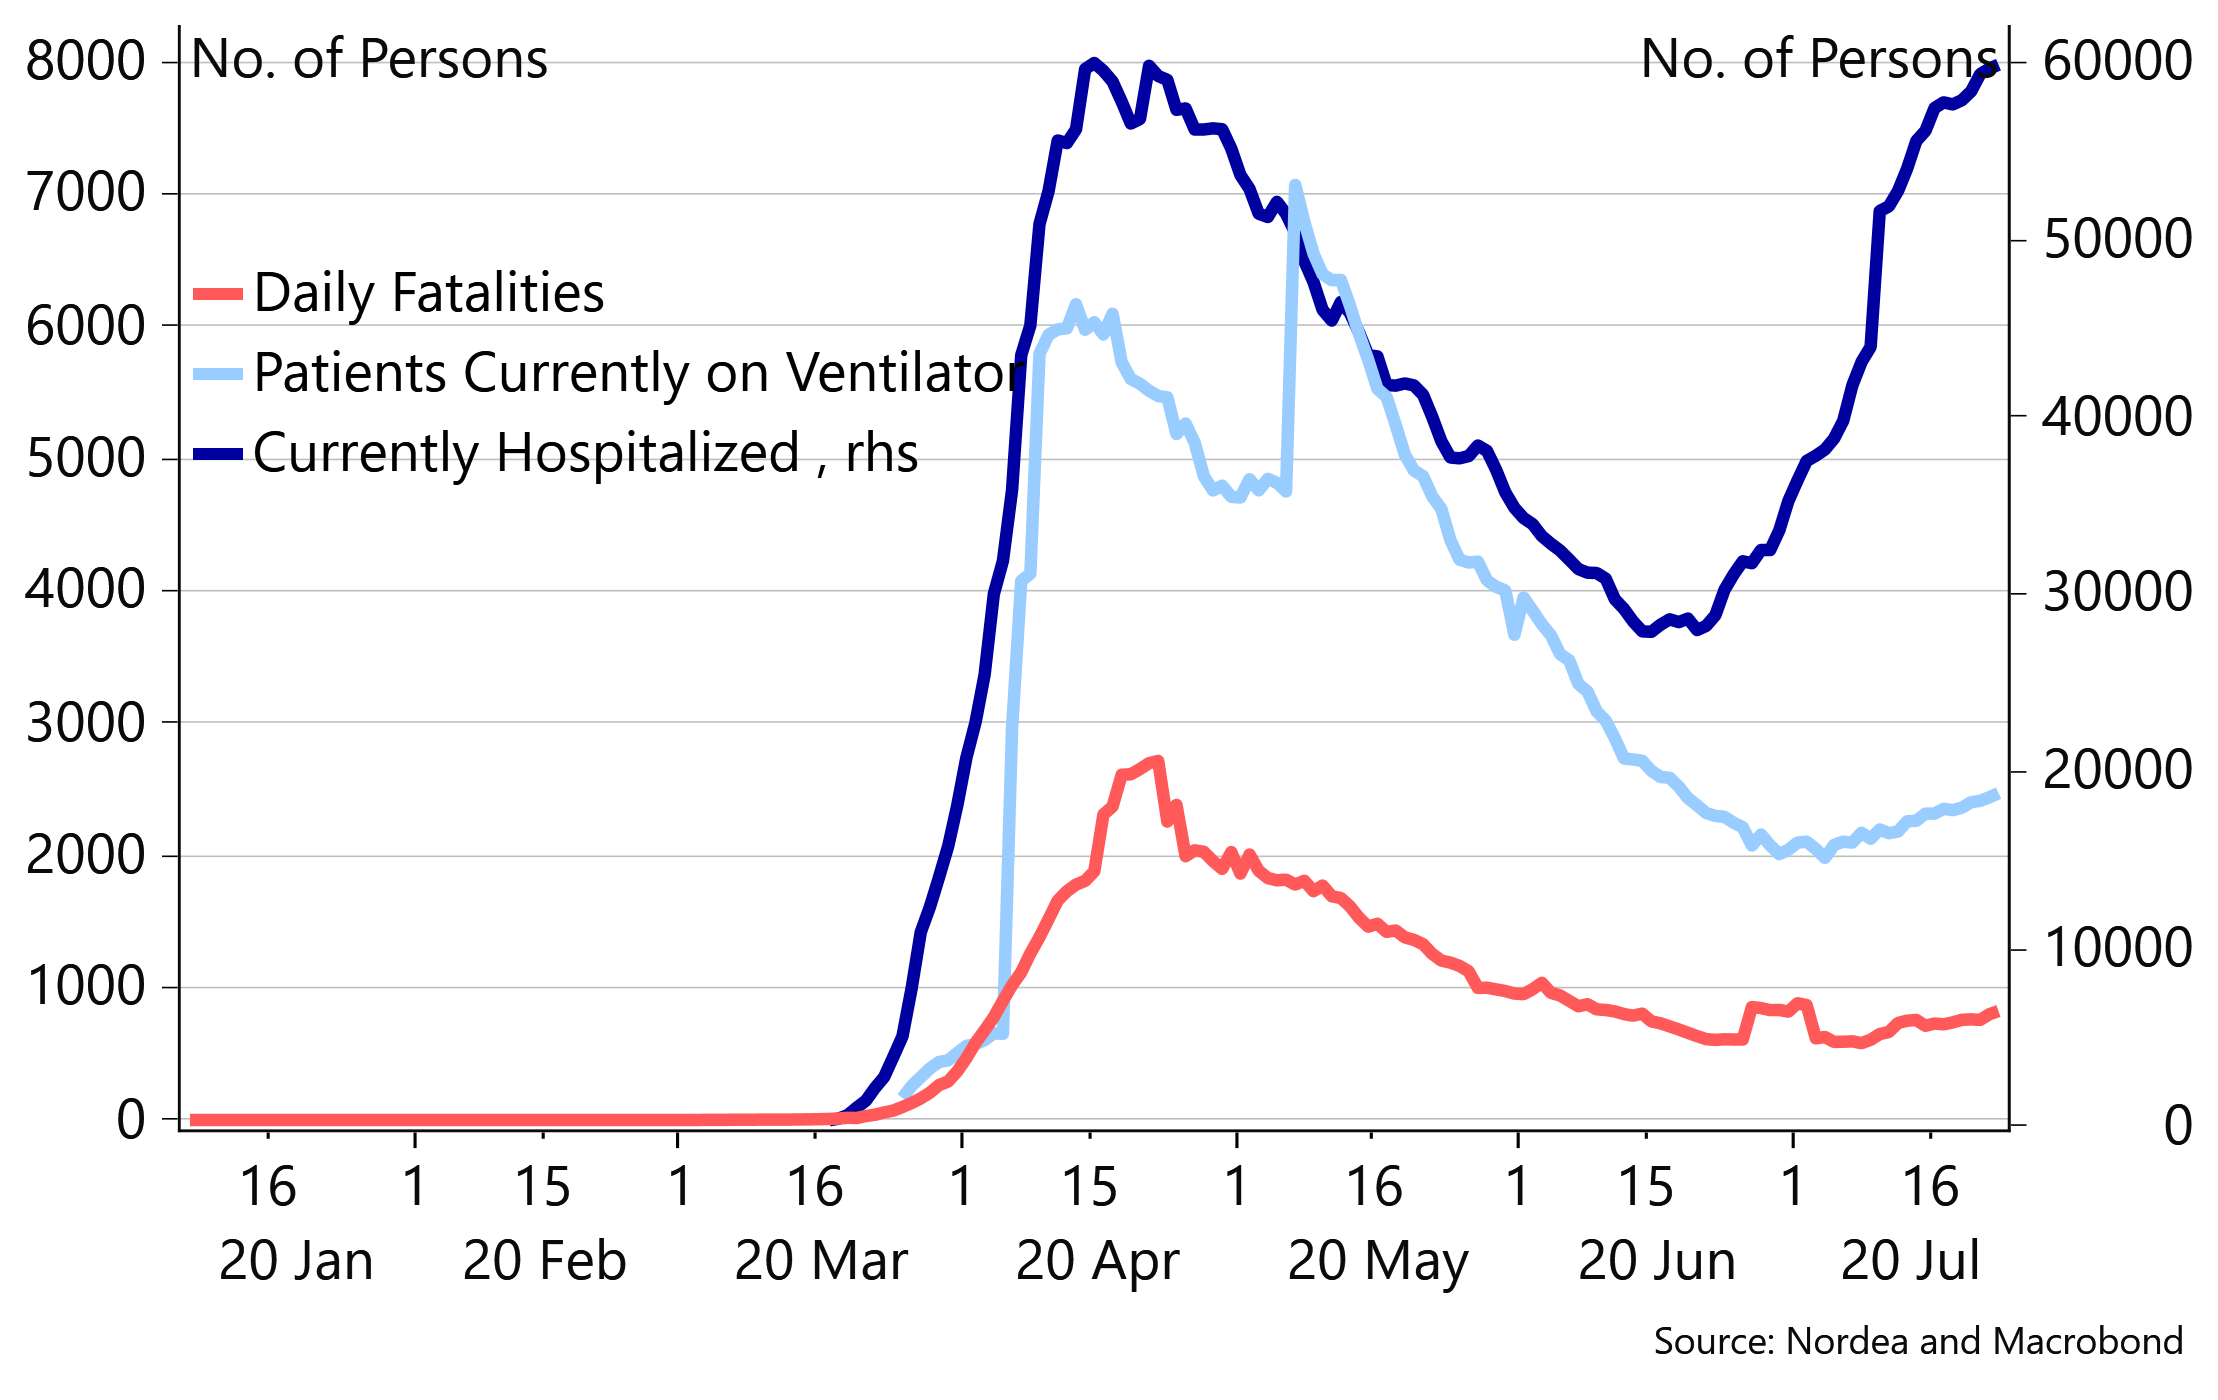
Otherwise, we still get mixed “coronavirus indications” with an unpleasant re-increase in cases and persons hospitalised, while on the other hand the number of persons needing intensive care as well as the fatality rate are moving lower (hopefully reflecting a more effective treatment). We think the jury is still out on whether a larger second coronavirus wave is unfolding.
Earlier this week Trump struck a much more conservative tone, suggesting that things may “get worse before they get better”. Although The Donald probably is not the most reliable “coronavirus forecaster”, he was actually right the last time he spoke such gloomy words, so perhaps we should listen to him (admittedly, it was also back then in March when the severity of the coronavirus was obvious to everyone).
Charts 7. Mixed coronavirus signals. The jury is still out on whether a larger second coronavirus wave is unfolding
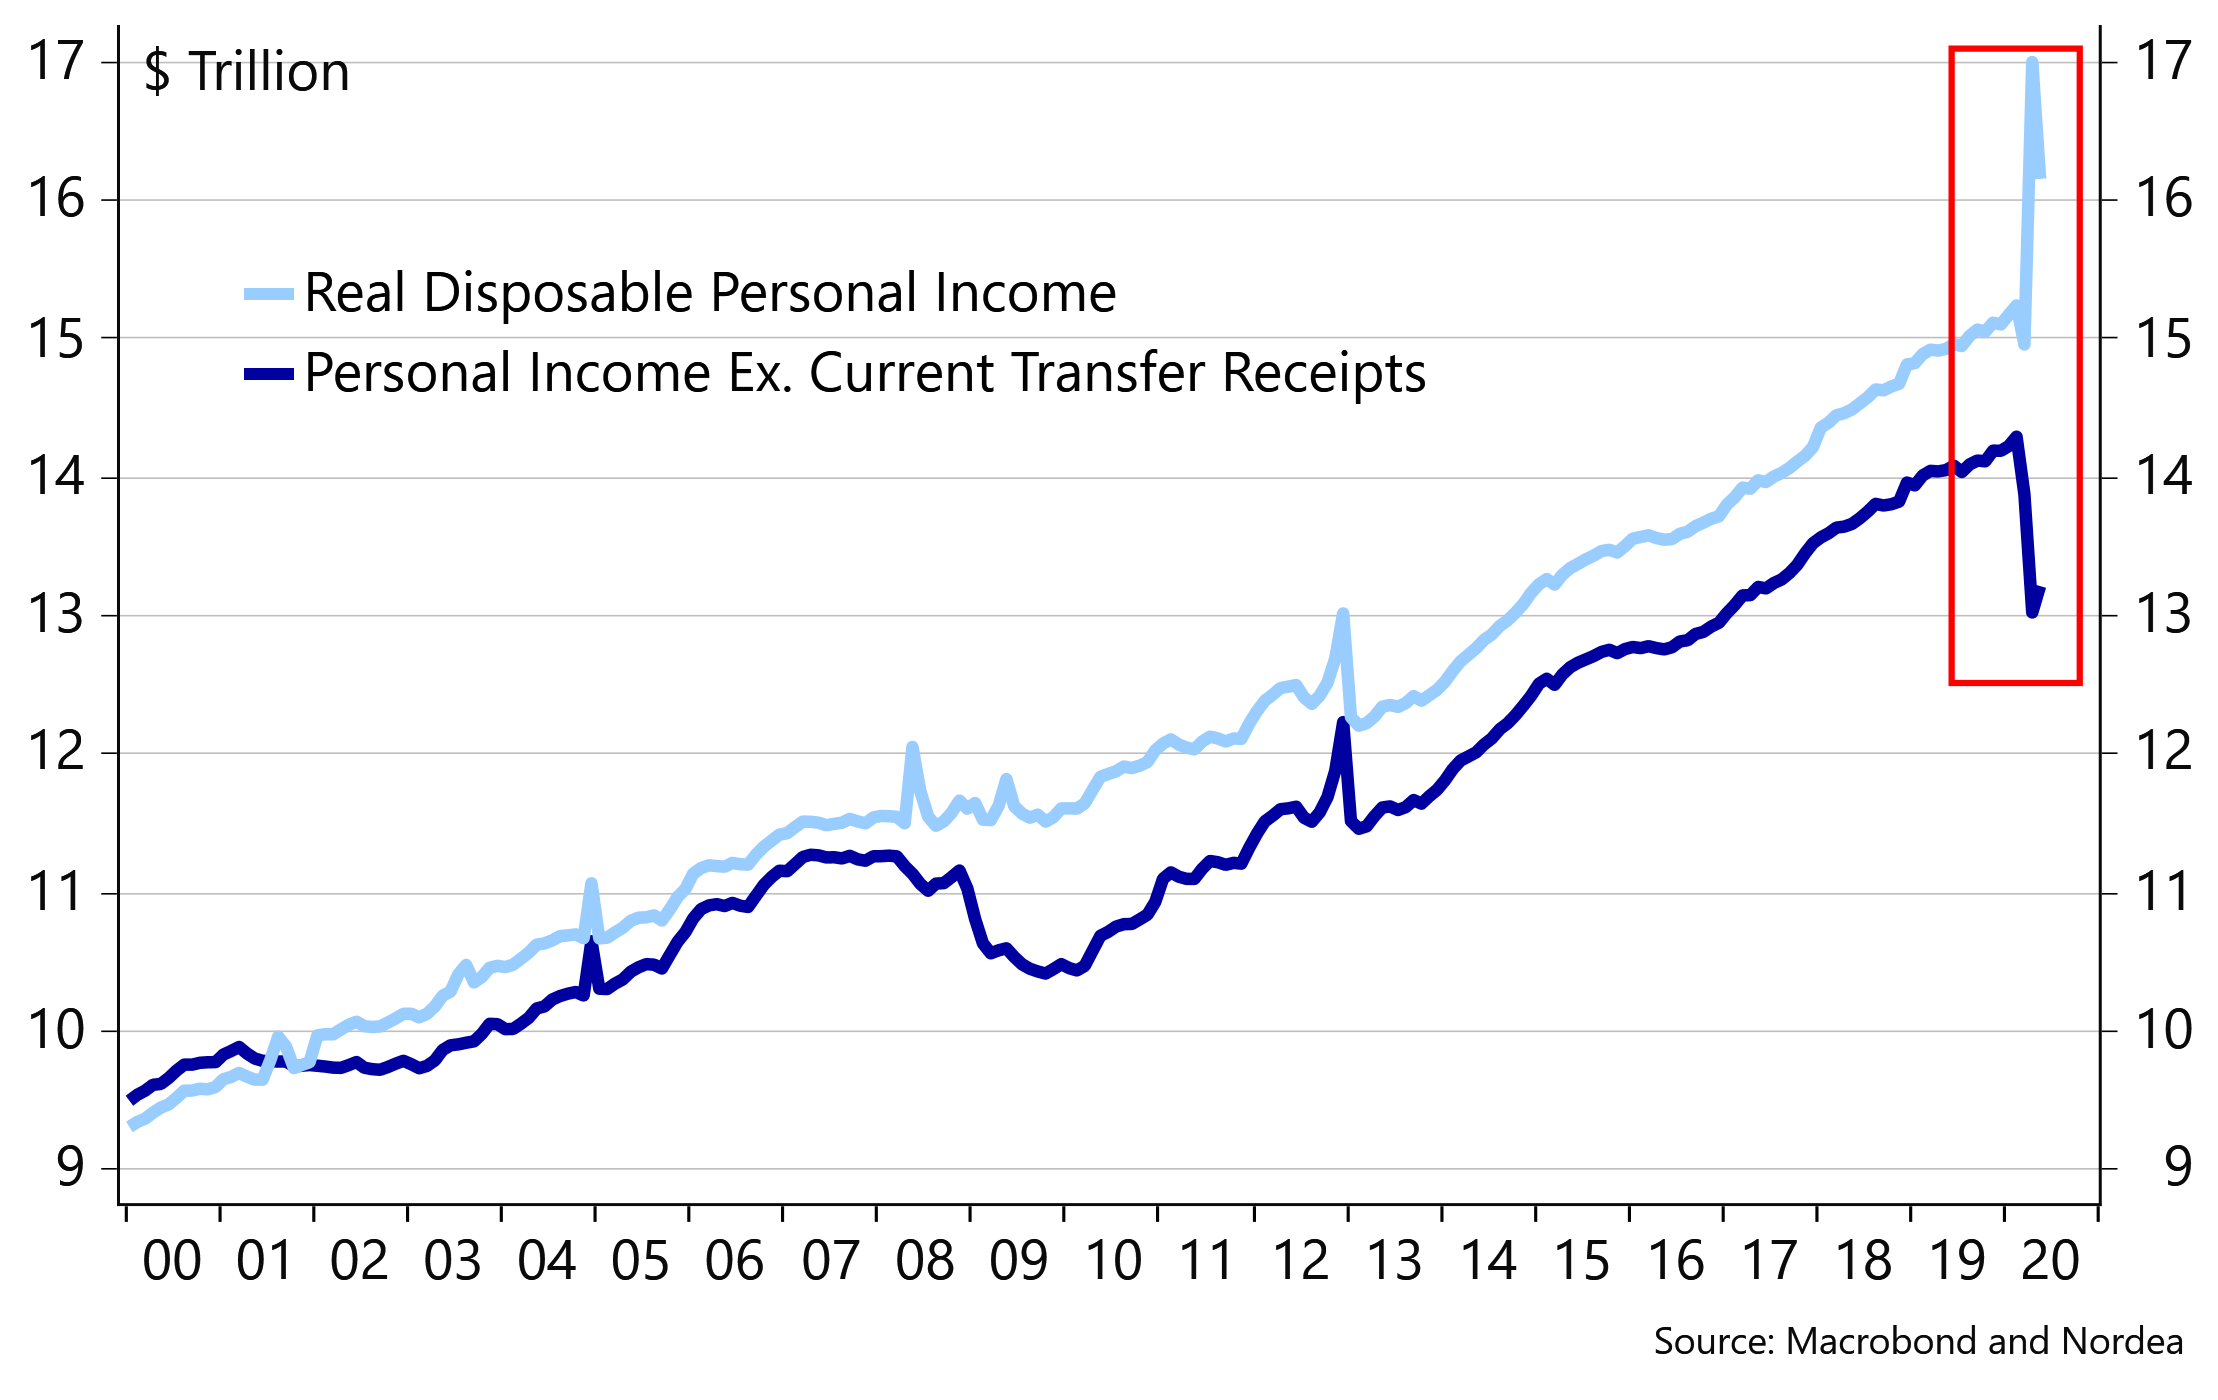
Besides the uncertainty of a second coronavirus wave and subsequent lockdowns, fiscal policy constitutes a big negative wild card, in our view. The USD 600 a week in extra unemployment benefits is thus set to expire on 31 July, which along with the cheques sent to households has almost solely been the driver of consumer spending, picking up since mid-April. However, reports from Congress on the negotiations are not that promising as not even the GOP senators and the Trump Administration can find common ground.
If the politicians do not come together, US consumers will face a large negative income shock, while investors will likely be wrong-footed (given that a deal before 31 July is a big consensus story).
Chart 8. What happens if the USD 600 a week in unemployment benefits is not extended beyond 31 July?
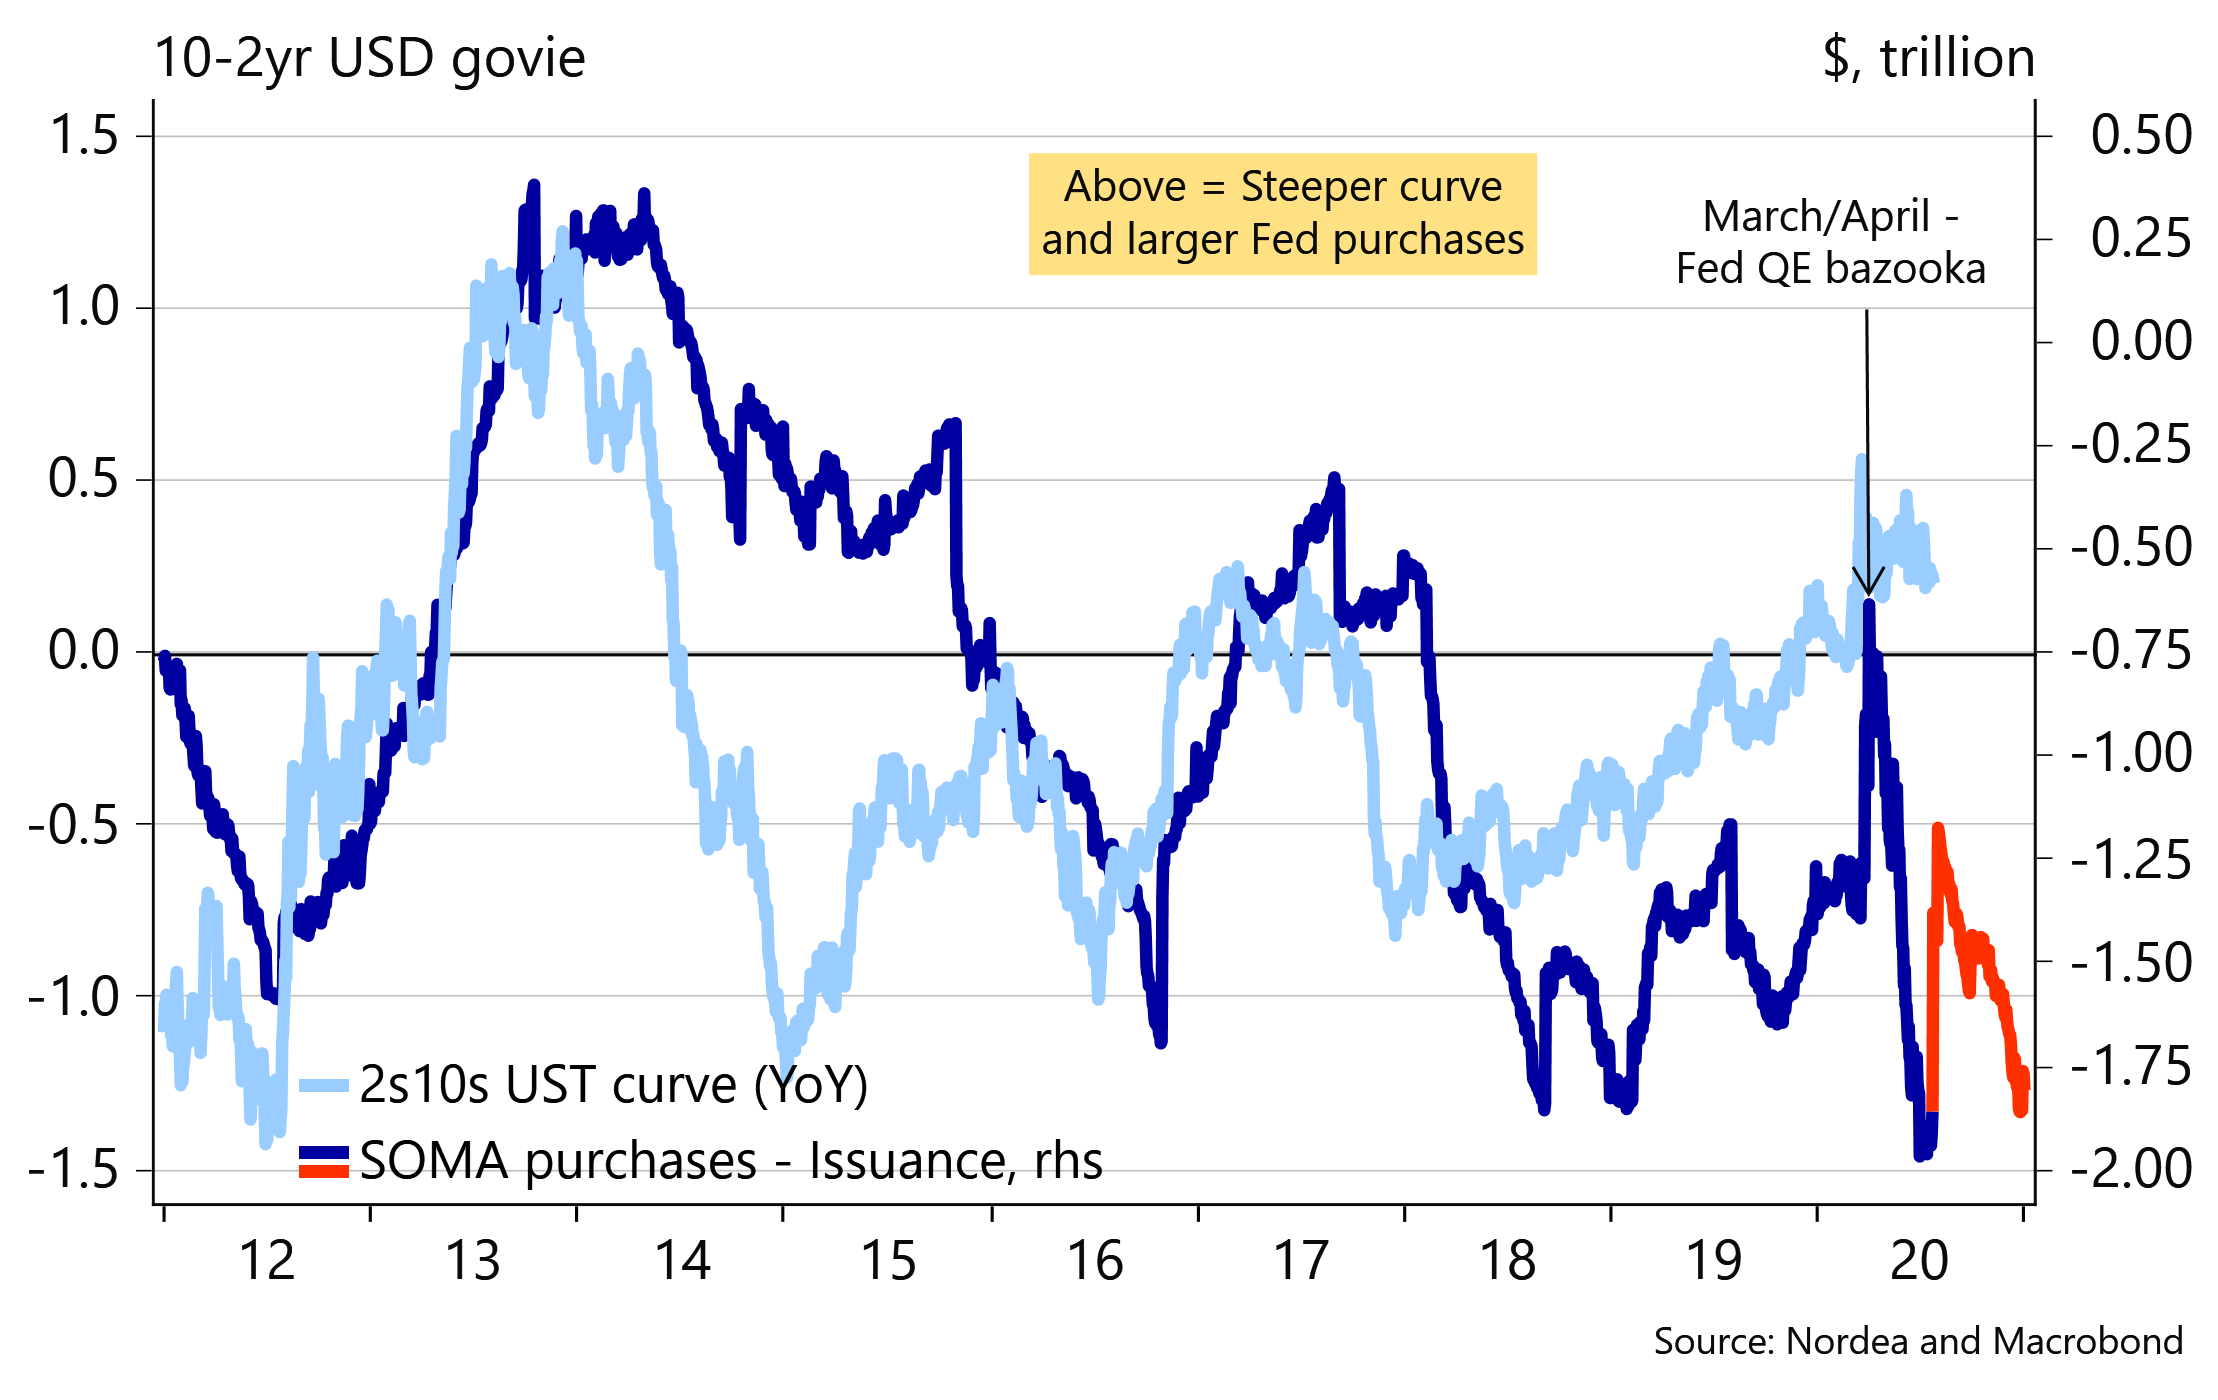
On top of this, the USD liquidity momentum has worsened over the past week with the Treasury Cash Account spiking yet again and Mnuchin seemingly unlikely to unleash his liquidity bazooka in the very near-term. The disinflationary environment also persists while geopolitics shenanigans constitute an underlying negative factor. In sum, while we do not think the coming weeks will be anywhere near the dash for cash environment like in March, we do think it makes sense to remove some chips off the risk bowl. In the FI space, we still think this could be played with the curve flattener case.
Chart 9. The USD liquidity momentum makes the case for a flatter curve
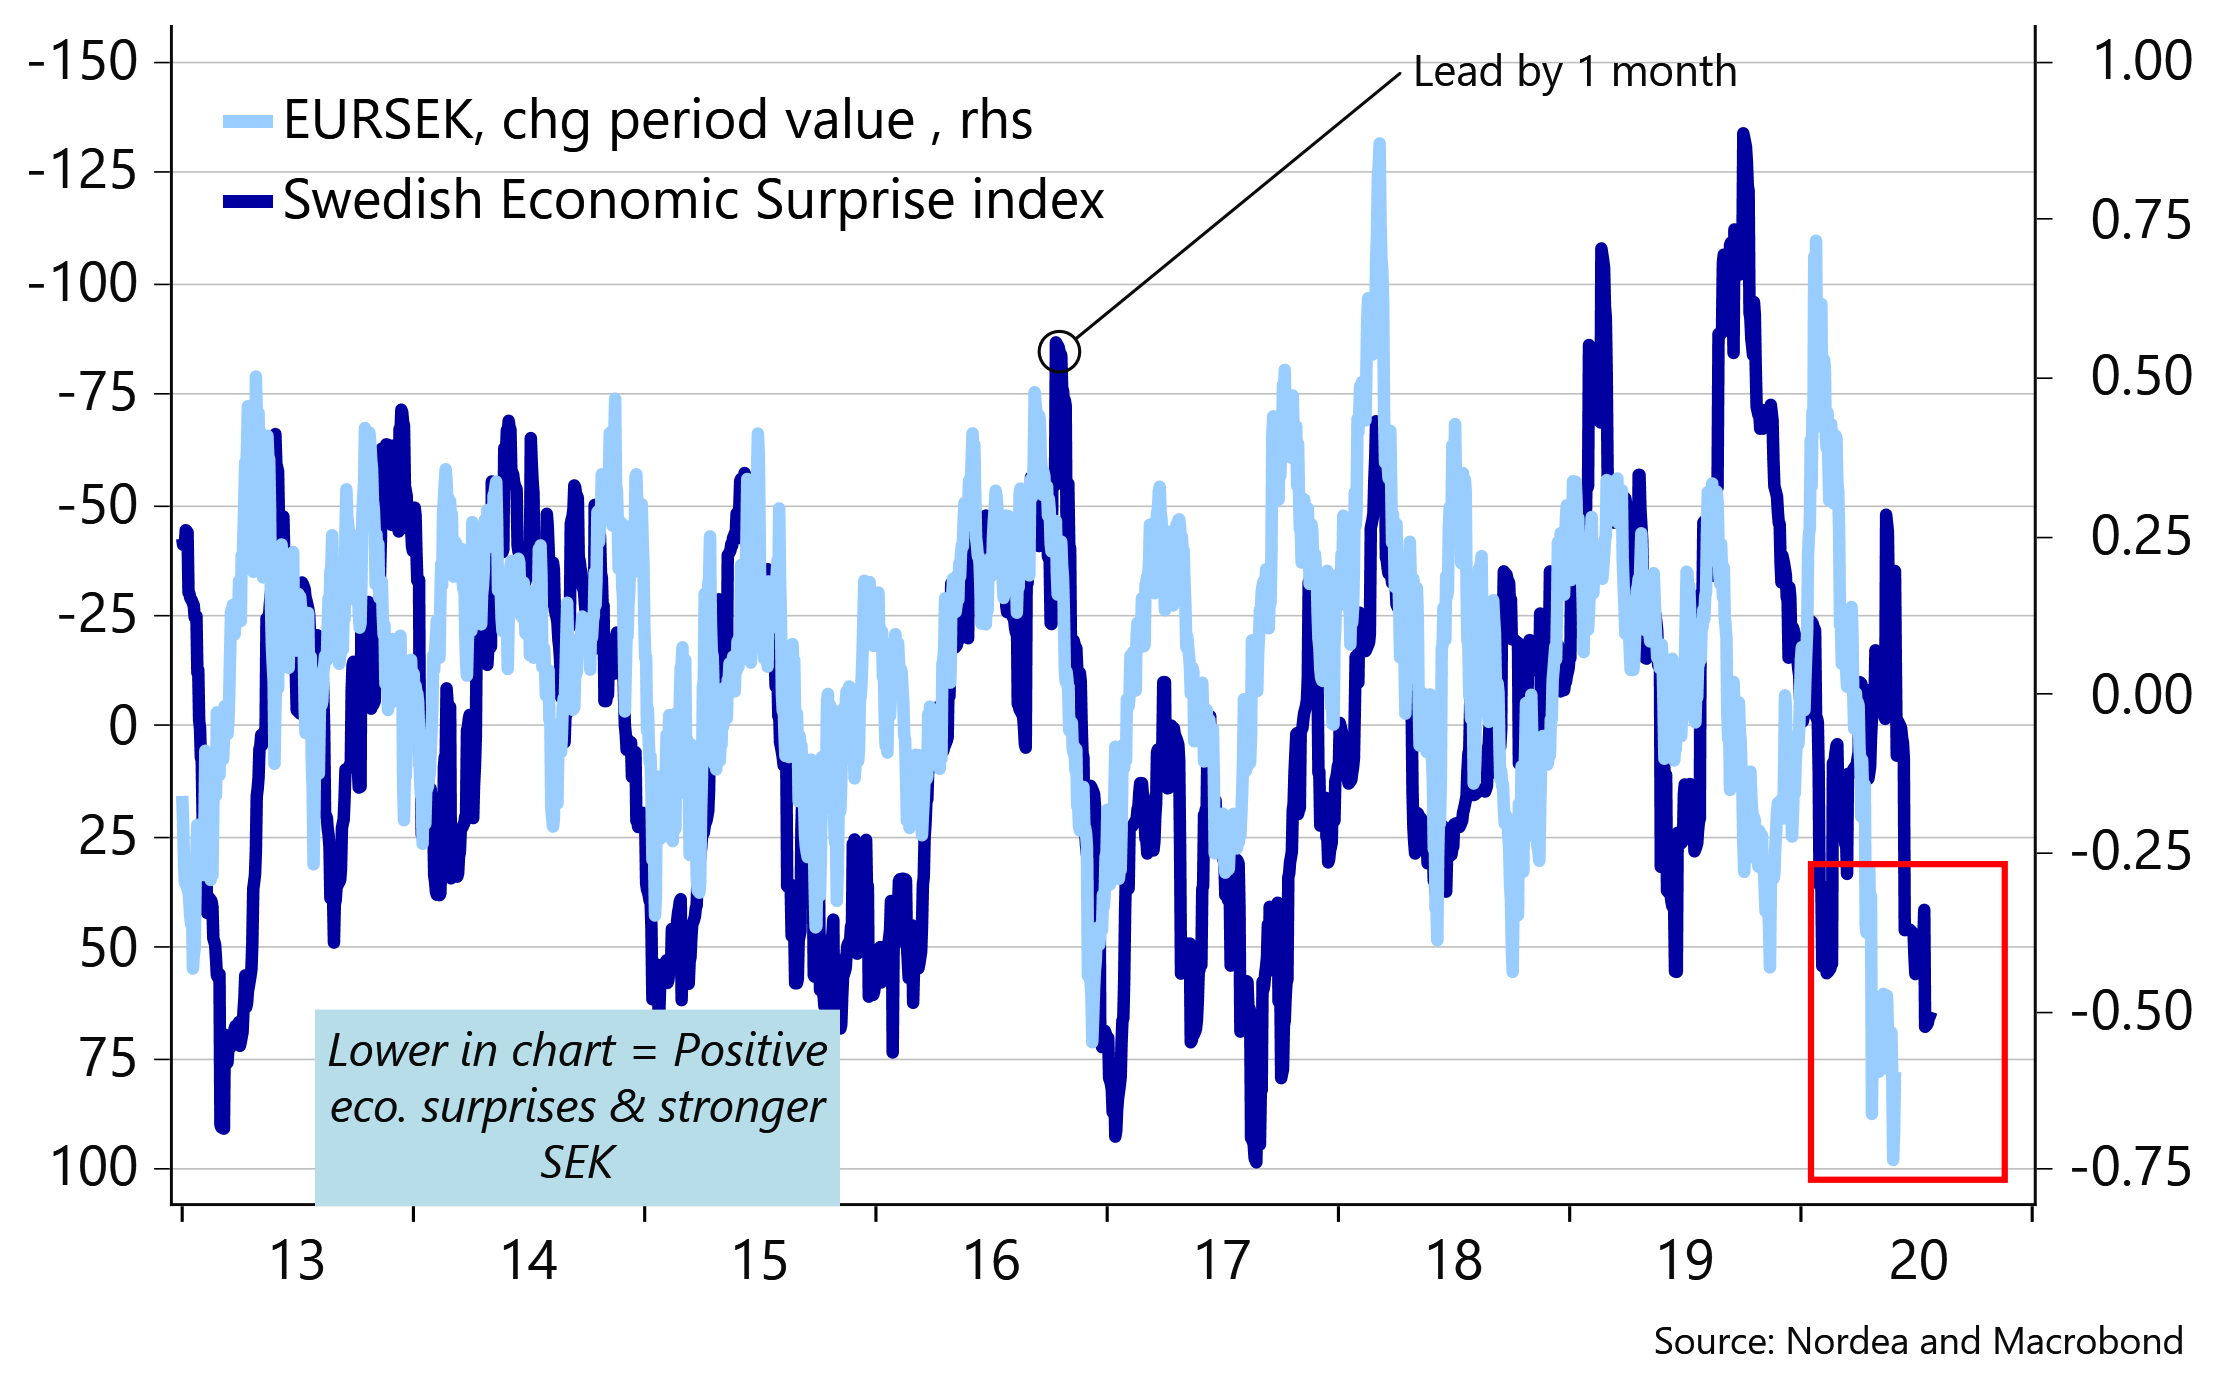
In Scandiland it has been a quiet week macro data-wise. Only the Swedish Labour Force Survey has drawn some attention as the unemployment rate for June surprised negatively with a jump to 9.2%, while the number of hours worked dropped by 8.4% y/y. Although the numbers should be taken with a large pinch of salt given seasonality uncertainties, they may prove interesting in a broader perspective as the numbers could mark the beginning of a wave of negative macro surprises.
The Swedish economic surprise index has thus been trading at elevated levels for a while – which btw is one of the reasons why EUR/SEK reached year-to-date lows this week – and given the mean-reverting nature of the ESI index, we could be in for some less benign key figures in the upcoming month.
Chart 10. Negative Swedish data surprises coming up? We prefer buying the dip in EUR/SEK at the moment
What’s most important in the week ahead?
We suspect many of this week’s market themes such as geopolitics, a second coronavirus wave, US Congress deadlock and stretched equity positions will linger on into the coming week. However, other drivers will likely emerge as next week is much more interesting from a key data and event perspective.
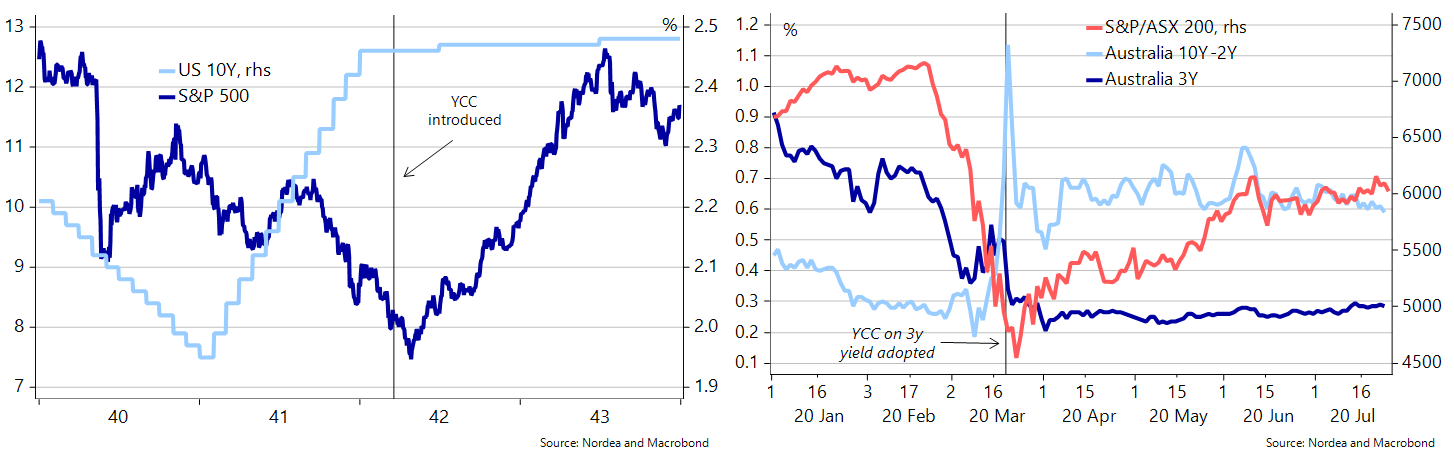
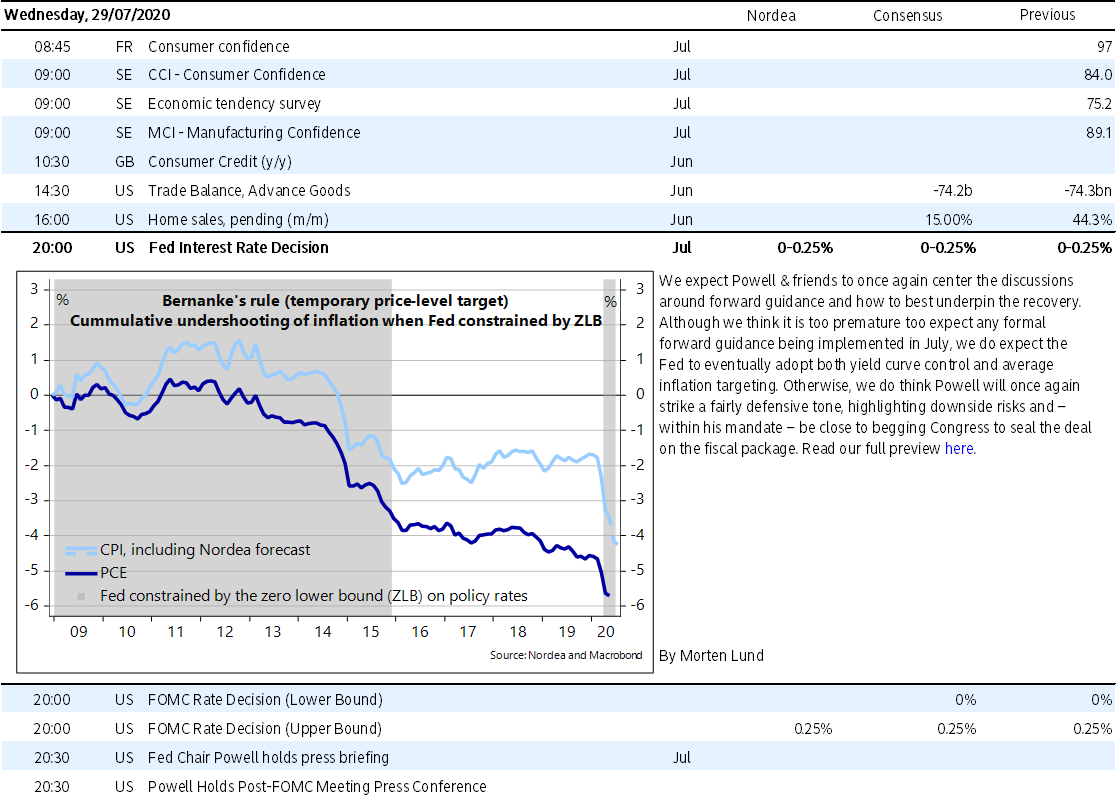
The key event is the Fed meeting on Wednesday when we expect Powell & friends to once again centre their discussions around forward guidance and how best to underpin the recovery (Fed Preview: From stabilization to accommodation). Although we think it is too premature to expect any formal forward guidance being implemented in July, we do expect the Fed to eventually adopt both yield curve control and average inflation targeting. Otherwise, we do think Powell will once again strike a fairly defensive tone, highlighting downside risks and – within his mandate – be close to begging Congress to seal the deal on the fiscal package.
Charts 11 and 12. When the Fed adopted YCC during WW2, it was a major bullish signal. The same has so far been the case in Australia
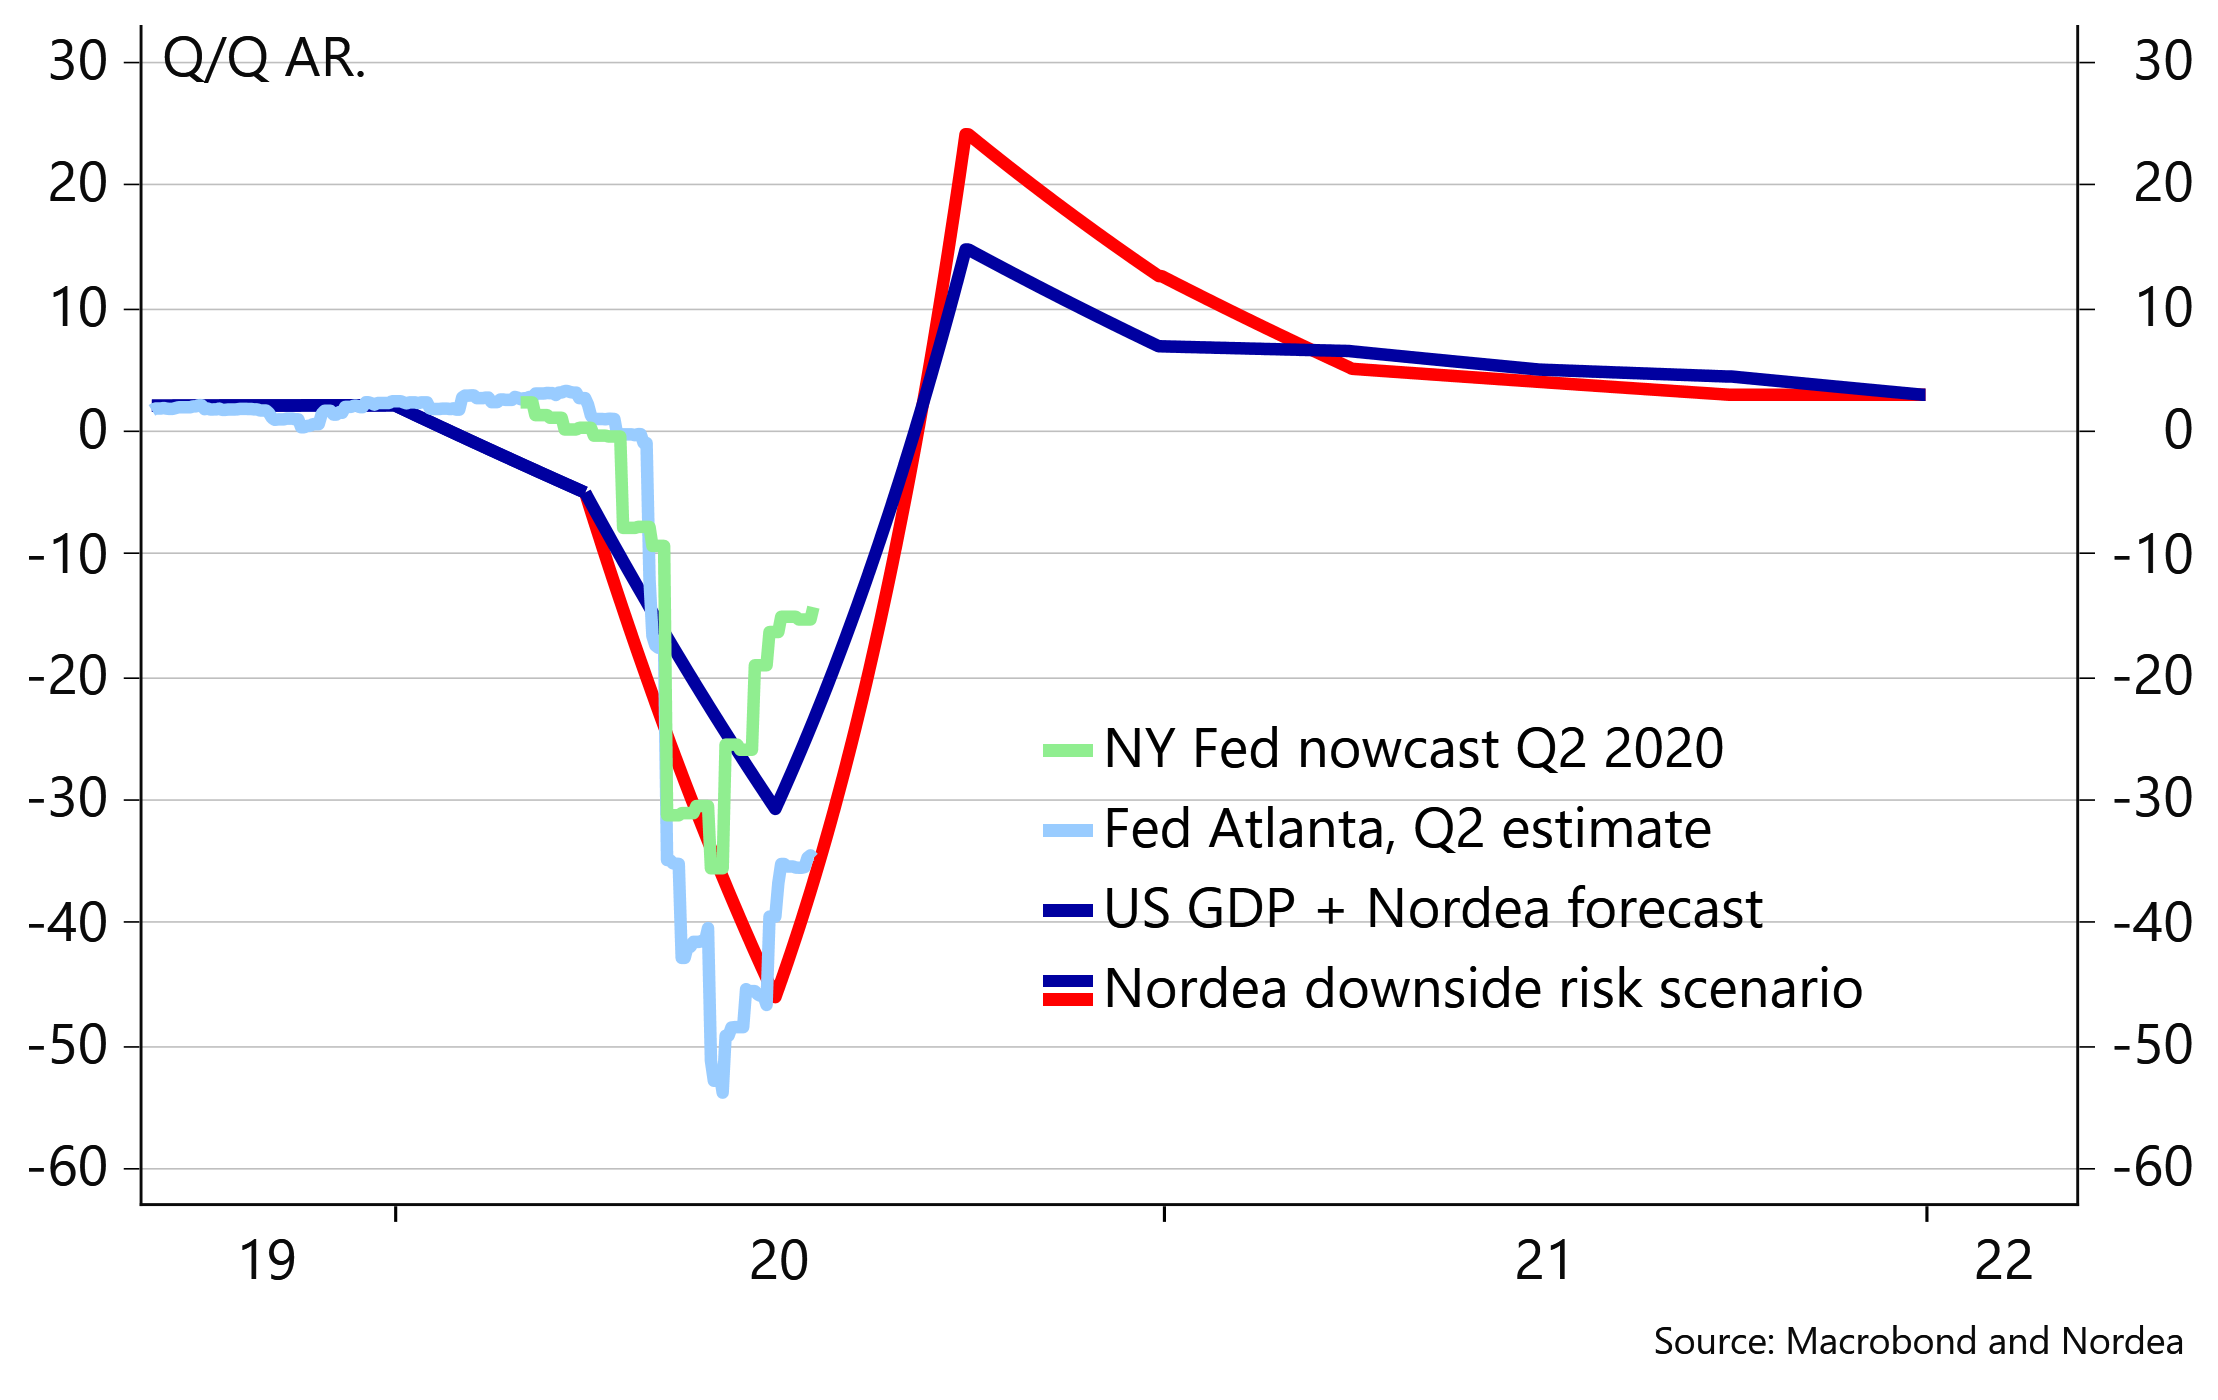
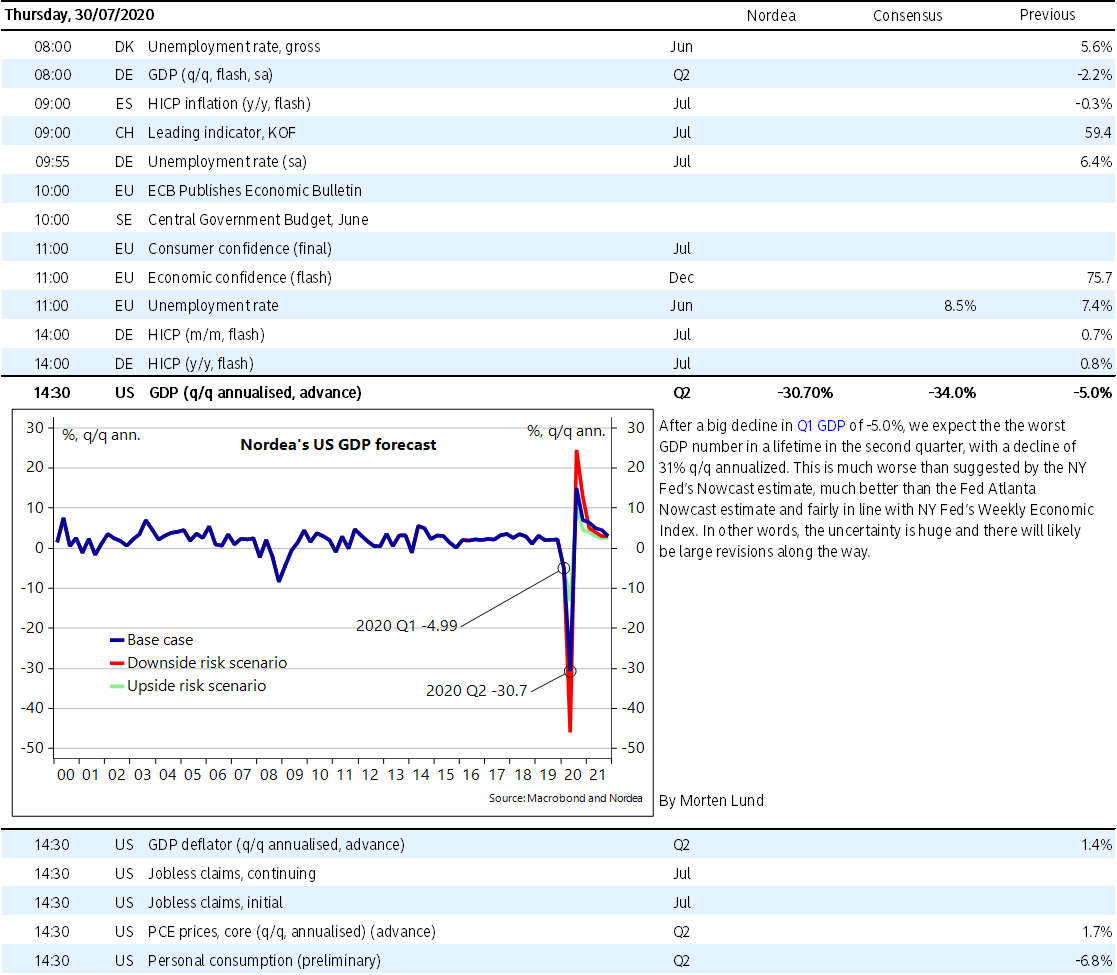
On the data front, we get Q2 GDP numbers from both the US and the Euro area, which we can already promise now will be the worst in a lifetime. For the US we stick to our call back in April that GDP will have declined by -31% q/q annualised in the second quarter. This is much worse than suggested by the NY Fed’s Nowcast estimate, much better than the Fed Atlanta Nowcast estimate and fairly in line with NY Fed’s Weekly Economic Index. In other words, the uncertainty is huge and there will likely be large revisions along the way. In terms of the market impact, large deviations from consensus are needed for the figure to be a market mover (markets usually don’t care about the lagging GDP numbers).
Chart 13. US Q2 GDP will be the worst in history
For the Euro area the GDP numbers should be worse than in the US with a decline of around -13.5% q/q (corresponding to -44% q/q annualised for US comparison – sorry, it is apparently an economics law that US GDP numbers must be announced annualised in contrast to all other countries).
Inflation data are also out from the Euro area, which could prove more interesting from a market perspective. We expect zero inflation for July, down from 0.3% y/y in June, driven by significantly lower German VAT. This negative German drag will likely also lead to deflation in the months ahead.
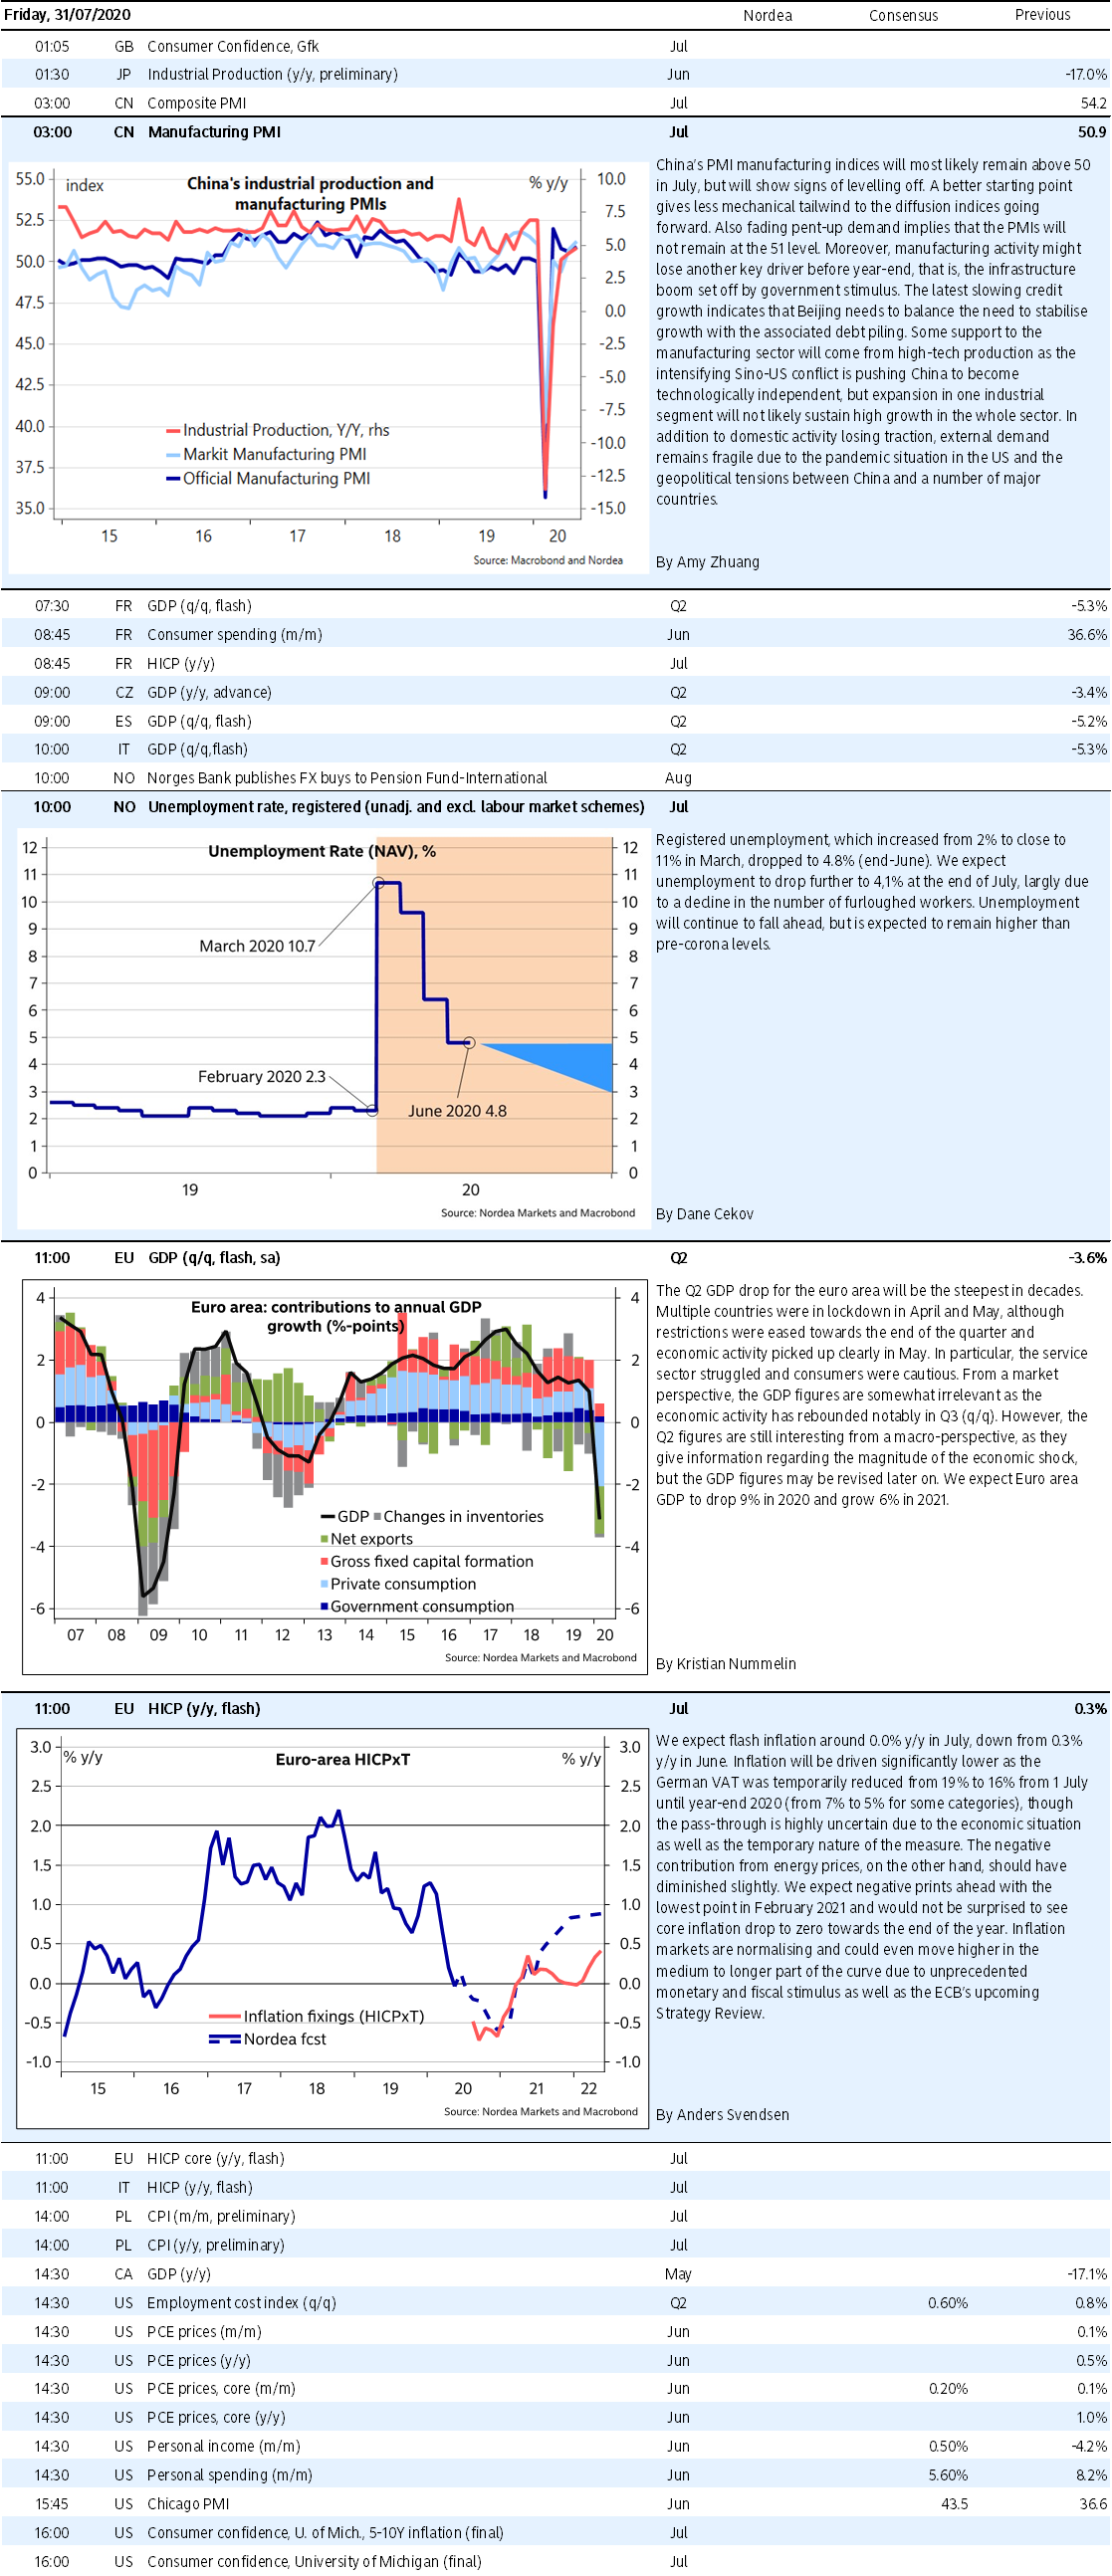
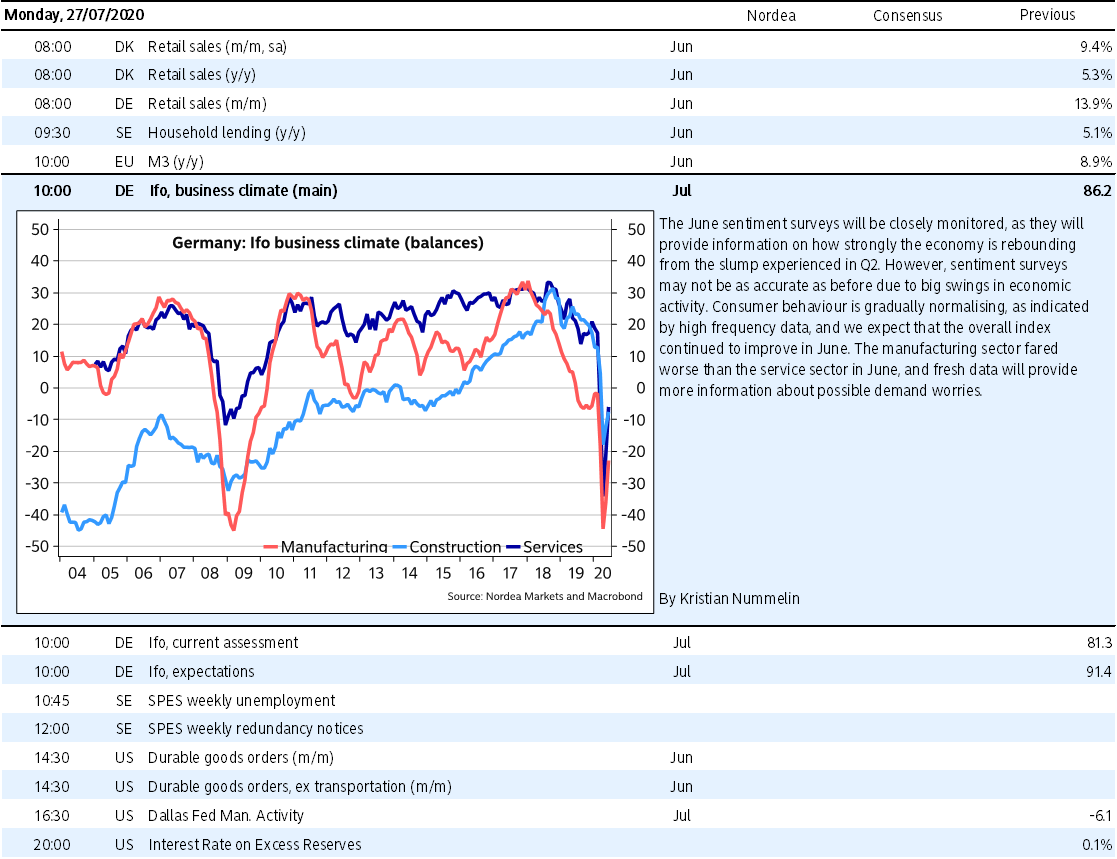
The German Ifo numbers will also draw some attention, likely showing another uptick in July, while official PMI numbers out of China should stay above the 50 mark. As we have discussed on several occasions in this publication, we do, however, not think that highly of the PMI diffusion indices as a growth indicator during these coronavirus times. The numbers should therefore be taken with a pinch of salt.
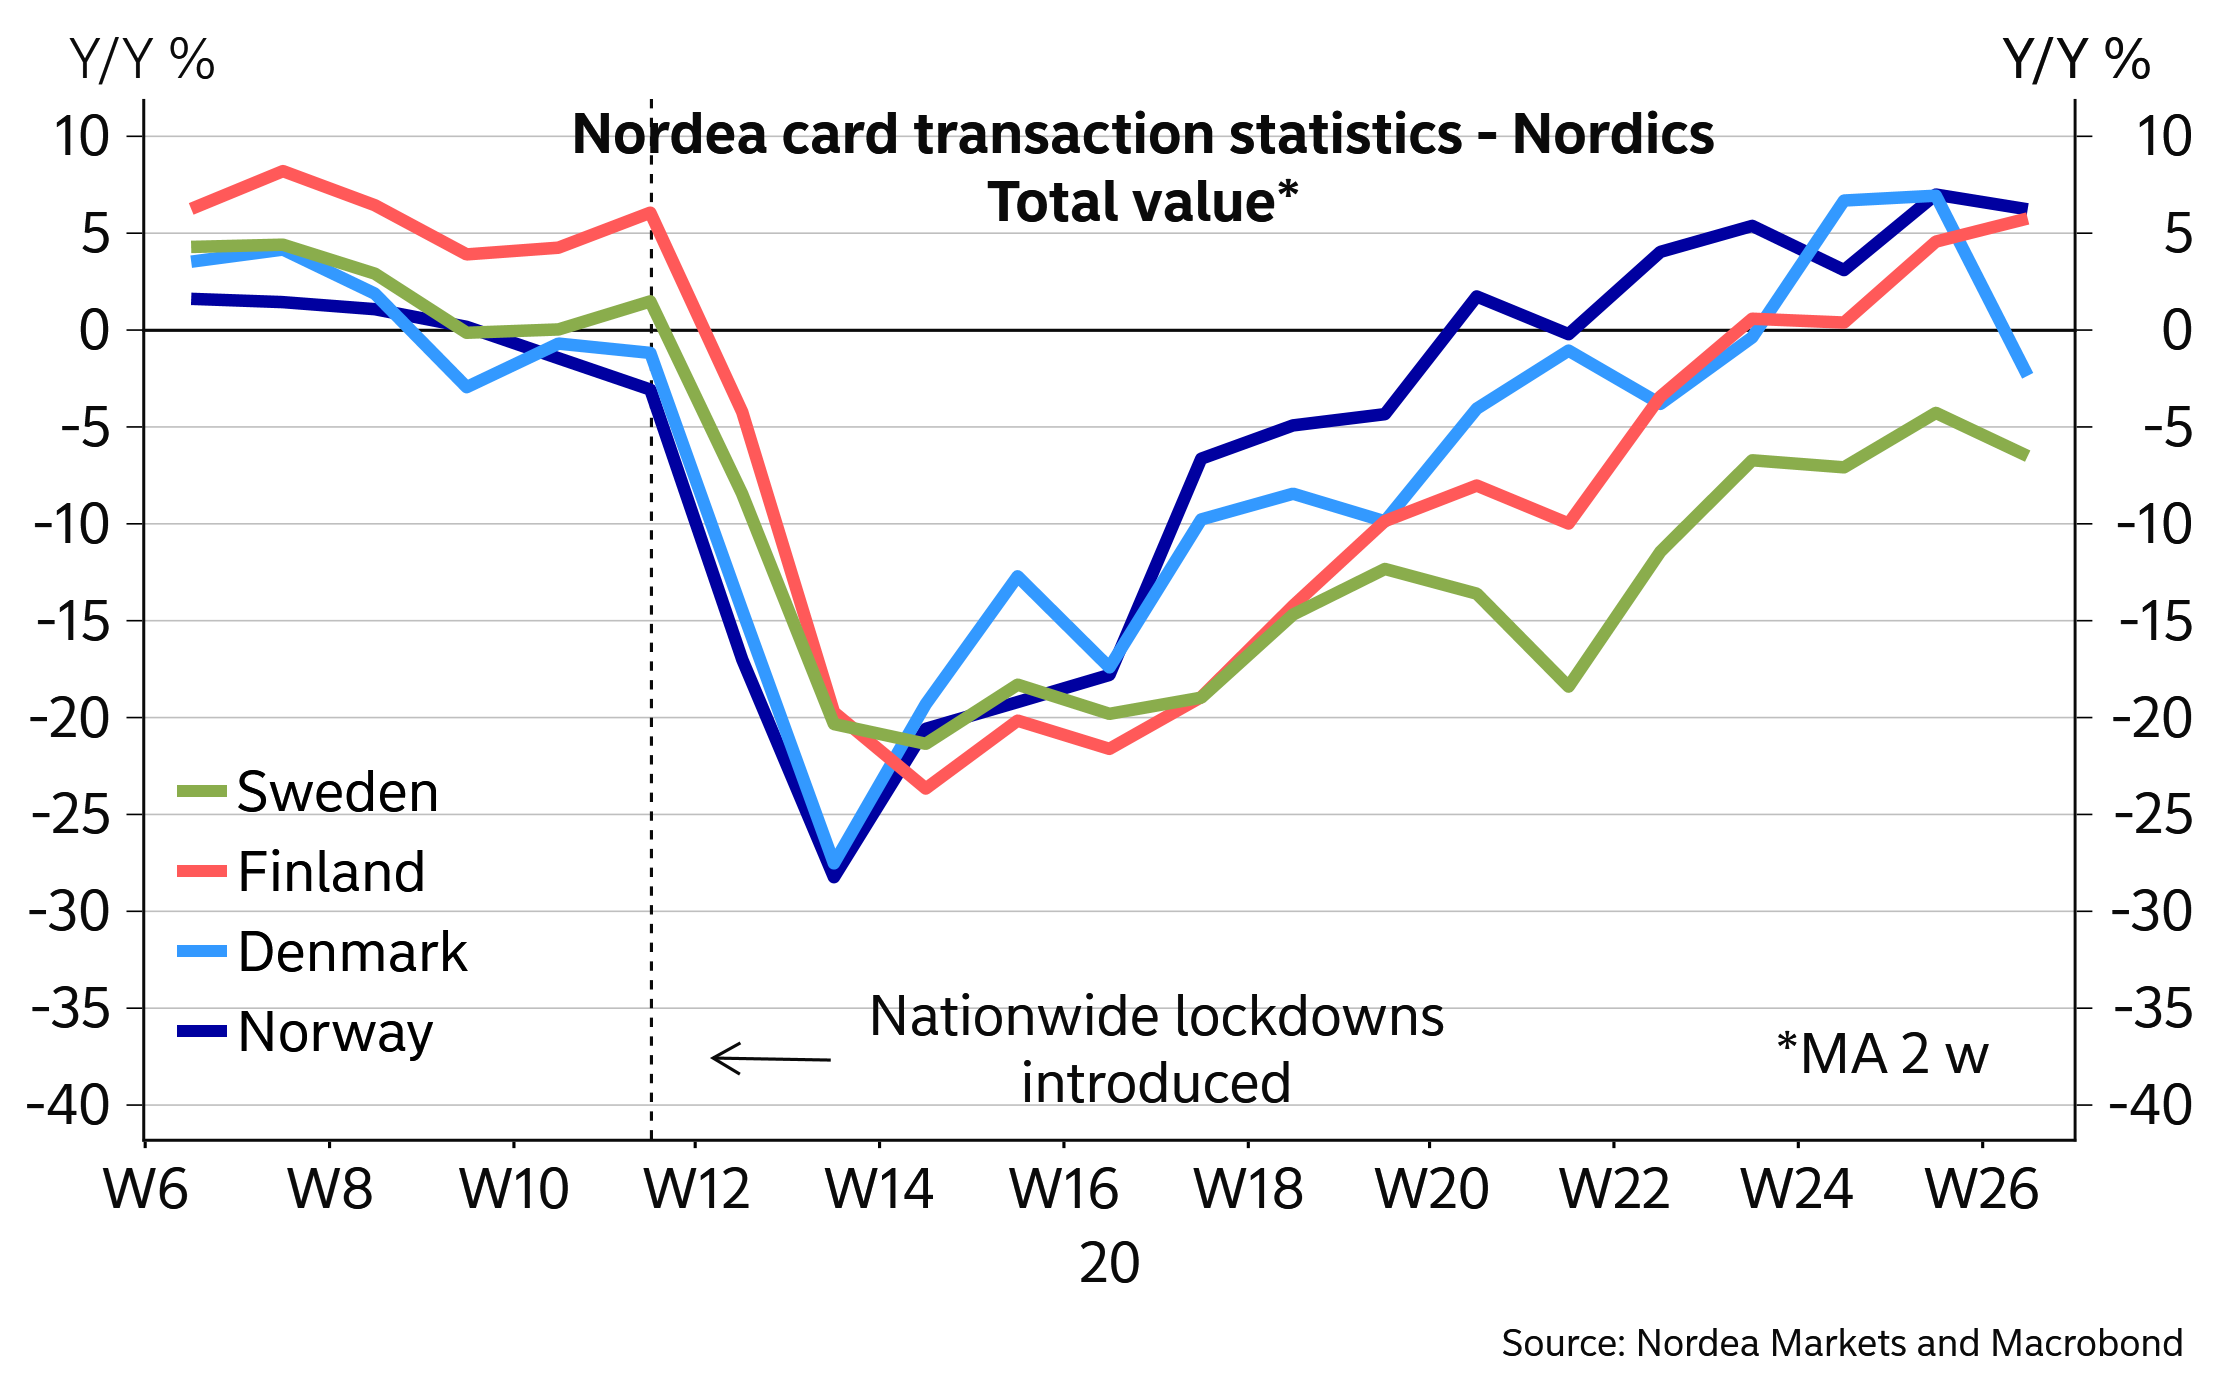
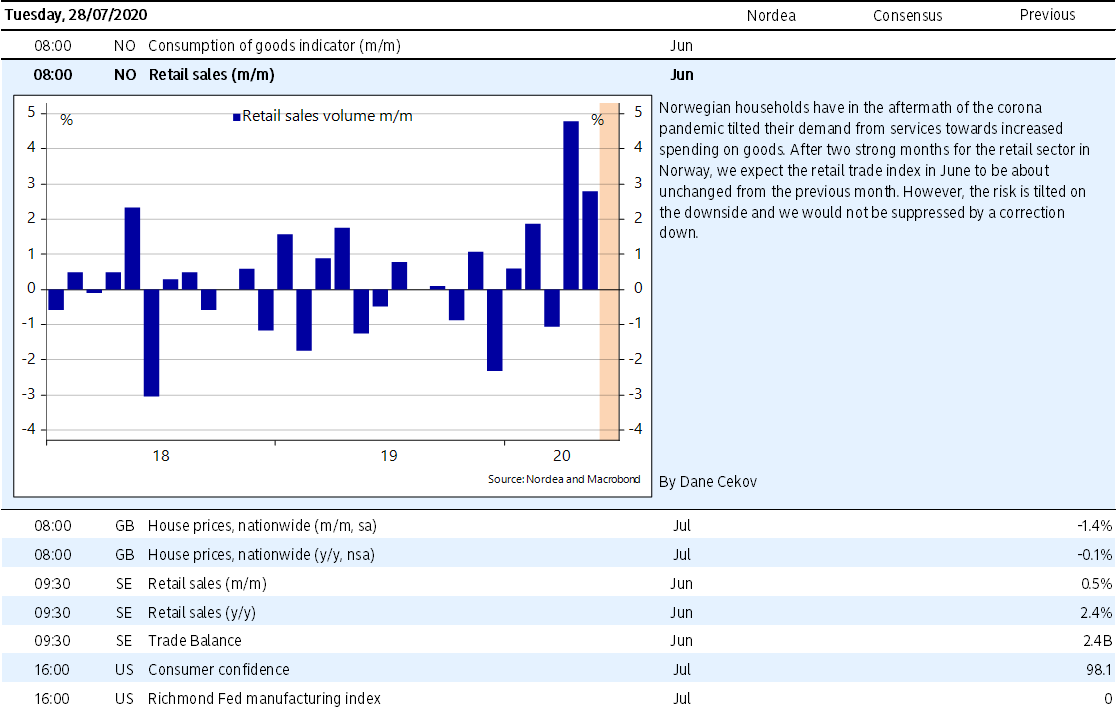
Finally, we also have a more interesting calendar coming out of Scandinavia with retails sales from both Norway and Sweden, while Norges Bank’s preferred unemployment measure NAV is also on the cards. Regarding retail sales, Nordea’s latest transaction data indicate a continued recovery for both countries in June, but Norway appears to be the relative winner.
Chart 14. Nordea’s transaction data for June indicate that Norway is furthest ahead with the recovery
// Editorial by Morten Lund
Key research pieces
Fed Preview: From stabilization to accommodation (23 Jul)
Monday 27/7
The week opens with the important German survey indicator, the Ifo index, gauging economic developments in Germany. Later on Monday, the US core durable goods orders figures will be released.
Tuesday 28/7
Tuesday features the latest retail figures from Sweden and Norway as well as the US CB consumer confidence survey results.
Wednesday 29/7
On Wednesday all eyes will be on the US Fed as they make their policy rate announcement. In Sweden the NIER economic tendency survey will be published, including business and consumer confidence measures.
Thursday 30/7
On Thursday GDP data are on the agenda; the first preliminary GDP estimates for Q2 will be released in the US and Germany. Further, the US will release weekly initial jobless claims figures and German preliminary inflation figures are published.
Friday 31/7
On Friday, European GDP data for Q2 and preliminary inflation figures are published. The week rounds off with the important PMIs from China.