
En af analytikerne hos Nordea har lavet en personlig analyse af udsigten for dette år – med forventning om en højere rente og højere inflation end forventet, fordi opsvinget kan blive langt kraftigere end ventet. Denne krise er ikke som andre kriser, og i modsætning til andre kriser er der ophobet en enorm købekraft hos borgerne. Når den kommer til udløsning, kan det – sammen med de gigantiske stimuli – føre til den perfekte storm.
A perfect storm brewing (part 2)
Our view since mid-August about steeper curves and higher long-end yields has been correct. As long US forward rates have reached 3.2% the question is if it’s enough? Explosive growth and higher inflation risks than normal indicate that it’s not.
Mikael Sarwe, Nordea: Note! These are personal reflections and not necessarily consistent with Nordea’s forecasts.
After having warned about new lows in US treasury yields ahead of the summer of 2020, our view since mid-August has been that long-end yields would be heading markedly higher and yield curves steeper initially in the US, but that this would also eventually imply the same trend in Europe. This view was based on the assumption that the fixed income world would look completely different before and after COVID-19 vaccines.
As very positive news on the effectiveness of vaccines surfaced in November, I wrote an in-depth update to our fixed income view, Global fixed income: A perfect storm brewing?, where I concluded that our out-of-consensus case for higher bond yields had strengthened. Since then the US 10-year yield has jumped to 1.75%, which is a reasonable move according to us.
Today’s article was supposed to be a “let’s take profit” kind of piece but the more I wrote, even though bond markets look technically oversold, the harder it was to stick to that idea from a macro perspective.
I will start by warning you that this text will be much longer and include a lot more charts than our normal publications, but I found it difficult not to try to turn almost every stone. Let’s start by revisiting why we became bond bearish to start with.
Chart 1. Imagine a world with an effective vaccine – where would the 30-year go?
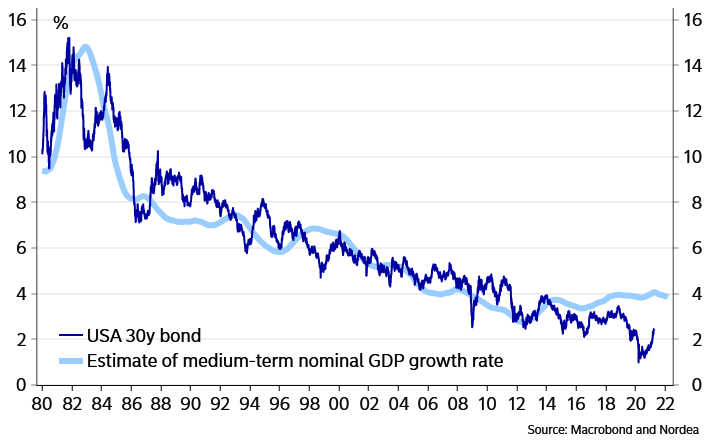
The main thesis we formulated was that the recession was a supply shock and that there was no reason for the market to discount that monetary policy would remain in MEGA stimulus mode forever once we got an effective vaccine to remedy that shock.
How far has the re-pricing come?
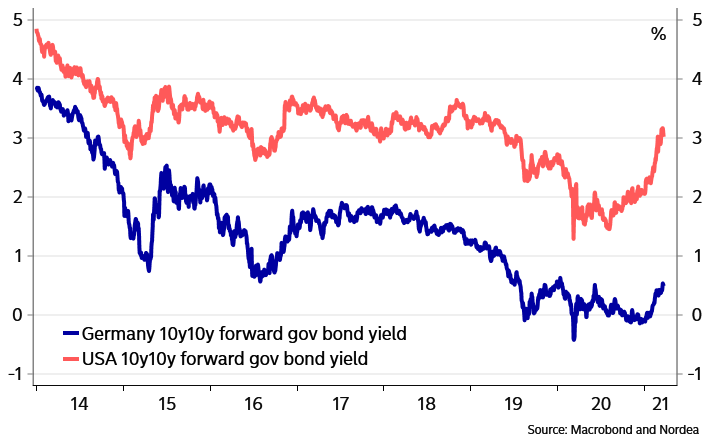
Spot rates are still low, but I have to admit that at least long-end forwards for US bonds are at reasonable levels. A 10-year US government bond in ten years traded at 3.2% last week. Of course, nobody can really tell what a reasonable level is but the Fed sees a neutral funds rate at 2.5% and nominal GDP growth has trended slightly below 4% y/y so 3.2% is pretty much in the middle of those anchors. Also, the US 1-month in 5 years rate traded at 2.2% and has in the past not been able to push higher than the Fed governors’ joint estimate of a neutral funds rate.
Chart 2. 10y10y forward rate starting to look normal in the US
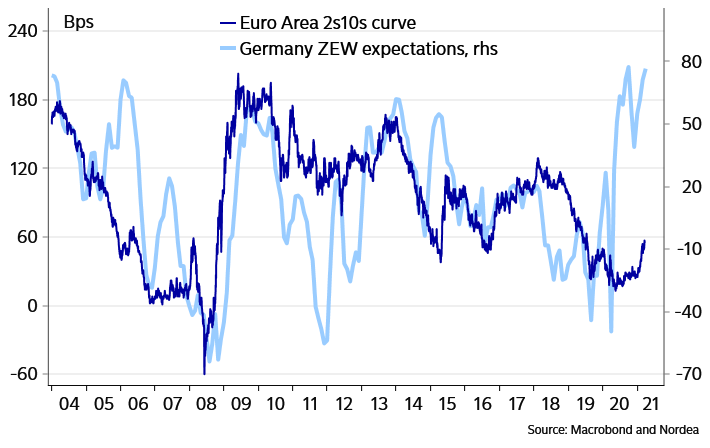
Further in on the curve, a first 25bp Fed hike is now discounted in late 2022, with an additional three in 2023. To us that is a reasonable scenario. In the Euro area there is a 25bp hike of the depo rate in the autumn of 2024. Maybe it will be difficult to push those rate hike expectations earlier, but cyclically I would still argue that 2s10s curves have room to steepen somewhat more. But we need to see a combination of very strong growth and inflation staying elevated into 2022 to continue pushing long-end yields higher. Will we get that?
The business cycle storyline 2021
Nordea, and basically everyone else, expects very strong global GDP growth during the course of 2021. Yield curves are still lagging that development, particularly since central banks won’t be willing to hike policy rates anytime soon. This should be true also for the Euro area even though, hilarious as it is, Christine Lagarde seems to think a German 10-year yield of -0.25% is perhaps moving too fast.
Chart 3. ZEW points to a steeper yield curve
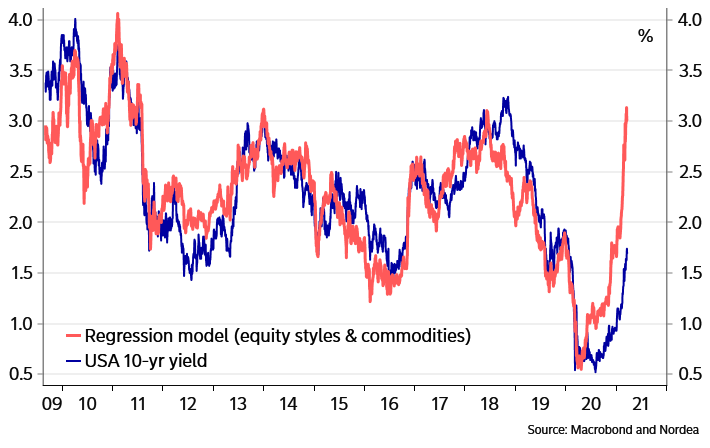
Our simple model of the US 10-year yield, based on global PMI, core inflation and the fed funds rate, indicates that 2+% is within reach. Also, a regression of other market prices within the commodities and equity space points to an even higher yield.
Chart 4. US 10-year should be heading to 2% …
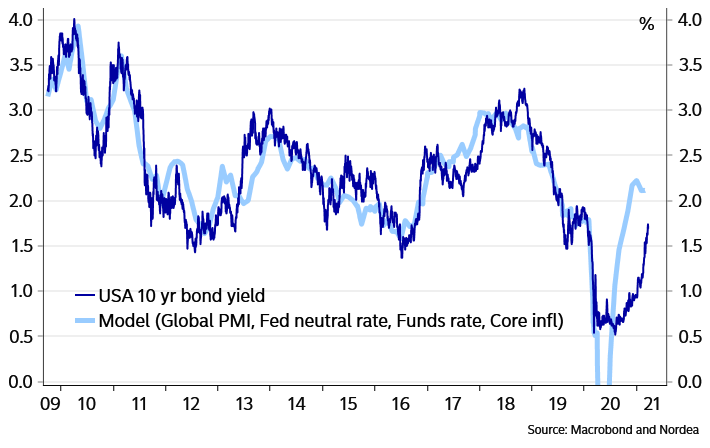
Chart 5. … or higher if other markets are consulted
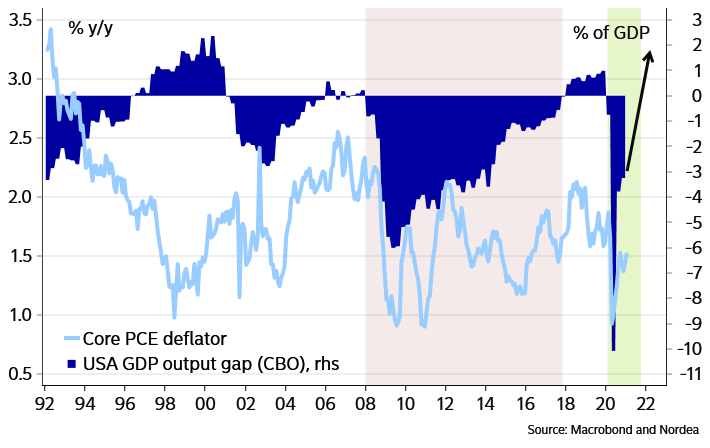
It is important to understand that the slump of 2020 was a disease-driven supply shock and not a recession where economic imbalances got laid bare as central banks tightened policy by hiking rates. From a macro perspective, 2020 was nothing like the financial crisis, after which it took 10 years to close the output gaps created by the crisis. This time, as soon as the root cause of the supply shock is cured, which will be very soon, the economies can be expected to get back to the starting point very quickly.
Chart 6. The US output gap
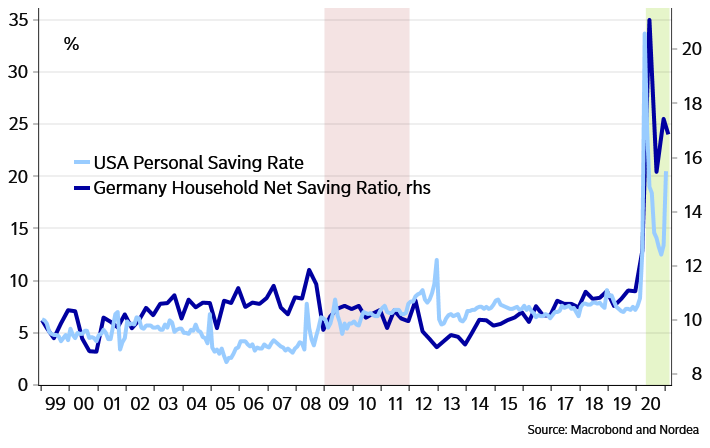
It is also important to stress the fact that the stimulus measures have been gigantic compared with previous recessions, both on the monetary and fiscal side. It has basically never happened before that the world exits a recession with a huge pile of cash in households’ hands. This was true already before Biden’s new stimulus checks. It is thus not only reasonable to believe that output gaps will close quickly, but also that we could see the most positive output gaps for decades.
Chart 8. A huge pile of cash to spend
Once the economies open up towards mid-2021, whichever way I look at it, it should become an epic period in terms of consumption-driven growth but also inflation.
The growing inflation case
Central banks are clearly worried that inflation indeed has died. In some sense that means that the final doubters of the disinflation train now are on board – talk about a crowded train (or trade …). Traditional inflation analysis supports their doubt about a return of inflation since hard employment/unemployment data indicate low wage pressures. I have such models too but I doubt they will be accurate this time.
Chart 9. Traditional models indicate low wage inflation pressure
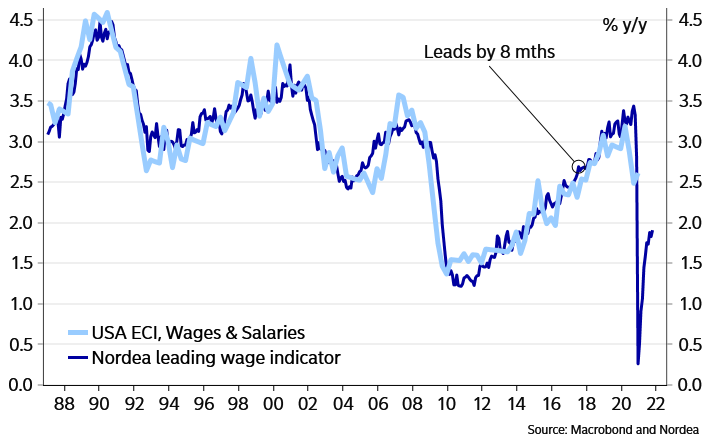
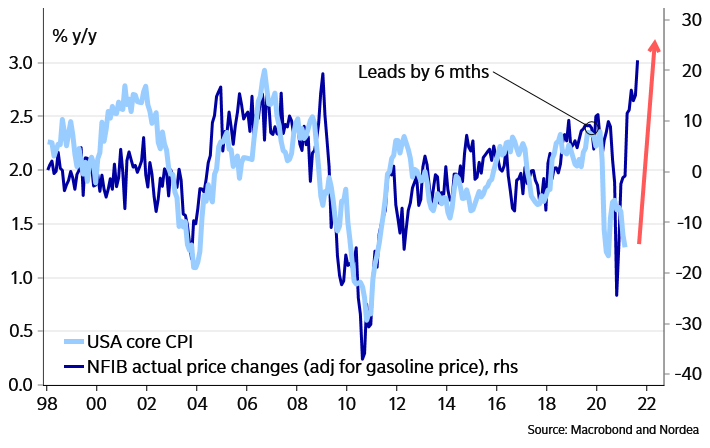
Circumstances aren’t exactly traditional. Although wage pressures aren’t there now, they should return faster than normal, as I argued above. And until then, we should see disposable income-driven, rather than wage cost-driven inflation. Companies need to restore profit margins and know there are record amounts of money on the side line. Once again, things simply look very different from the aftermath to the financial crisis. Already now, the share of small businesses in the US indicating price increases is at all-time highs.
Chart 10. Companies have a need to hike prices
The Fed, and others, remain quite convinced that we will see a brief inflation spike due to base effects and energy prices over the coming months but that inflation will drop back down. I think the spike will drag out at least to a wider hump, triggering among other things a tapering decision from the Fed late this year.
A few other reasons why inflation should drag out are global food prices up 20% the latest six months, skyrocketing transportation costs, a huge need to re-stock inventories, the easiest financial conditions ever, world records in fiscal and monetary stimulus and, in the case of the US, a major latent upward rent pressure. Rent pressures alone could mean over 1%-point higher core inflation during the latter part of 2021, as the economy goes back to normal.