Goldman Sachs bringer tit en enkelt graf, der i ét billede giver en historie om økonomien eller et emne på markedet. Nordea viser i fem grafer, hvorfor den amerikanske inflation endnu ikke har nået toppen. Det skyldes især de højere priser på energi, brugte biler samt de stigende renter. Derfor venter Nordea, at centralbanken vil stramme kursen næste år med tre rentestigninger. Besværet med at få vaccineret alle vil også forlænge forsyningsproblemerne og dermed skubbe inflationen i vejret.
US inflation: Five charts on why US inflation hasn’t peaked yet!
US inflation will likely take another sharp leg higher due to energy, used cars and rents. The broadening of inflation will also continue into 2022. There are good reasons to expect the Fed to firm up even more!
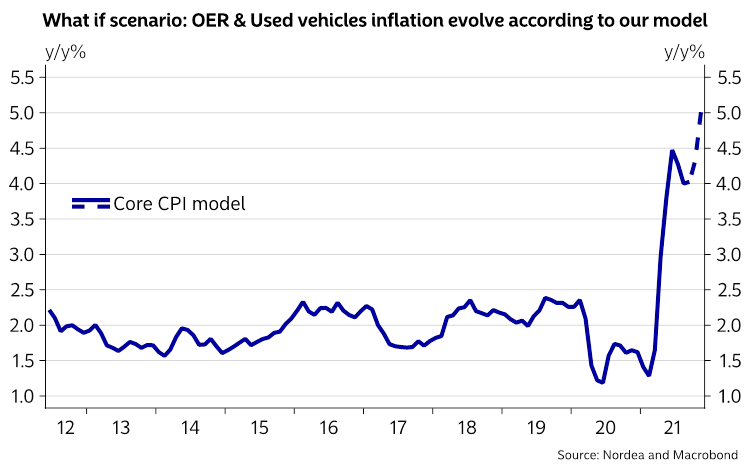
We expect US inflation to take another sharp leg higher with core inflation reaching >5% territory before New Years, while headline inflation is to exceed 6%. The broadening of the inflation picture continues into 2022 as wage growth tends to accelerate the price pressure at median terms, hence why the Fed will get increasing evidence of a broader price pick-up.
This supports our view of a swifter than currently projected taper path and three rate hikes in 2022. Here are five reasons why!
Chart 1: Our core inflation forecast takes us to >5% before New Years
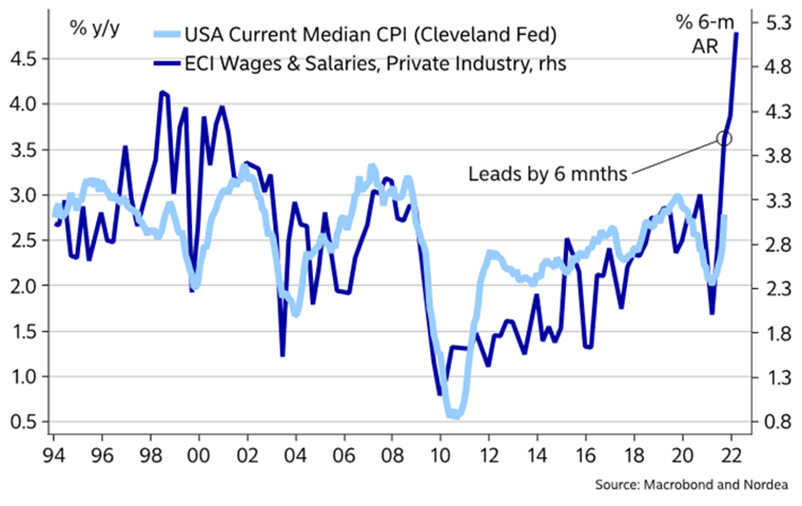
Reason 1: Broad wage growth leads to higher median prices…
Broad wage growth usually spills-over to a higher median CPI with a time-lag of 6-9 months, which will likely lead median prices higher through 2022. This is exactly the kind of inflation that the Fed fears the most.
Chart 2. Wage pressure spill-over to broader price pressure with a time-lag
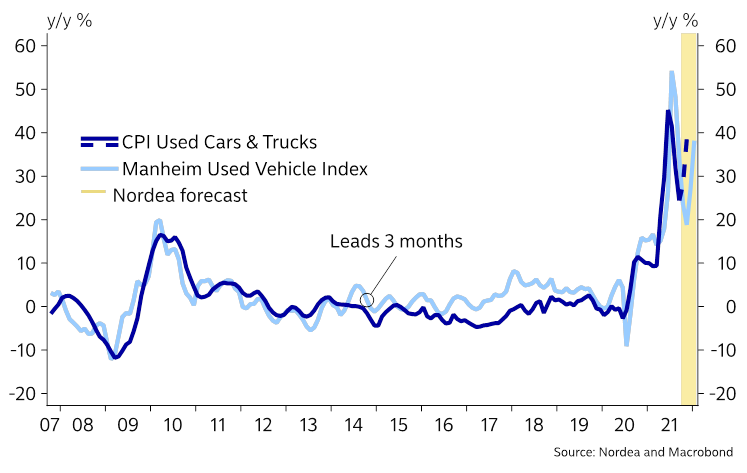
Reason 2: Prices on used cars are surging again..
The old culprit behind the higher core inflation during the early Summer is back in the limelight. The prices on used cars have started surging again and we need to pencil in material new spikes in the yearly pace of prices according to our model which also takes the Mainheim indicator intp consideration. We project that the used vehicle component will contribute with >1.5% by year-end, with risk to the upside.
Chart 3. Prices on used cars are re-accelerating
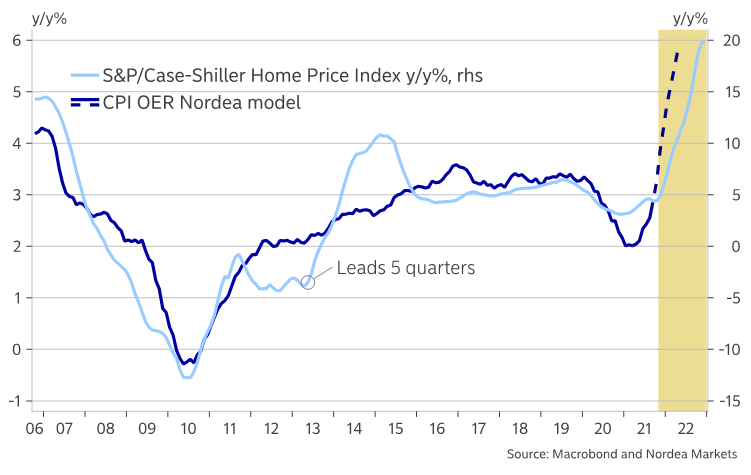
Reason 3: Rent of shelter inflation is picking up the pace
The rent of shelter component is also slowly but surely adapting to the new price level of the housing market. Our model predicts YoY price growth just below 6% in the owners equivalent rent of resident (OER) component over the coming two quarters. Given our model predictions, the yearly contribution to core inflation from the OER component could be as large as 1.7%.
Usually there is a time-lag between an increase in house sales prices before the effect shows in the rent of shelter component, and this lag-time has been prolonged by the eviction moratorium. Our findings are broadly in line with the findings of others, including Fannie Mae, who recently updated their home price growth forecast by 2.3%-points to 7.4% in 2022, as well as the Dallas Fed, whose economists project OER inflation to print at 6.9% by 2023, but the difference is that our models front-load this effect substantially compared to Fannie Mae and Dallas Fed. Also this category carries upside risk to the inflation print.
Chart 4. Our models hint of 5-6% rent of shelter inflation already during Q1-Q2 in 2022
Reason 4: The energy to food price feedback loop
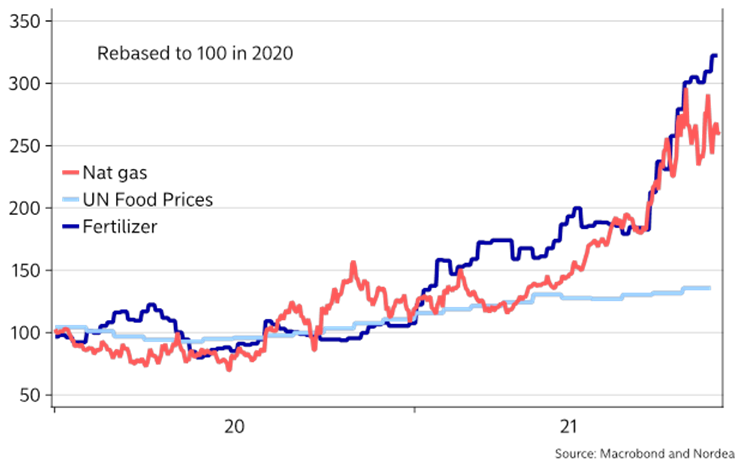
There is a negative feedback loop ongoing in food prices as higher energy prices lead to higher prices on fertilizers and ultimately higher prices on crops and food in general.
The energy crisis is far from being over as Russia is still not delivering any gas via the Mallnow station at the Polish/German border (or else Poland keeps it in Poland). This is the exact week Putin promised to start filling the German underground storages from. Can we take him at face value? We doubt it.
Chart 5. The negative price feedback loop from energy to food prices
Reason 5: Vaccine mandate and restrictions to prolong supply issues…
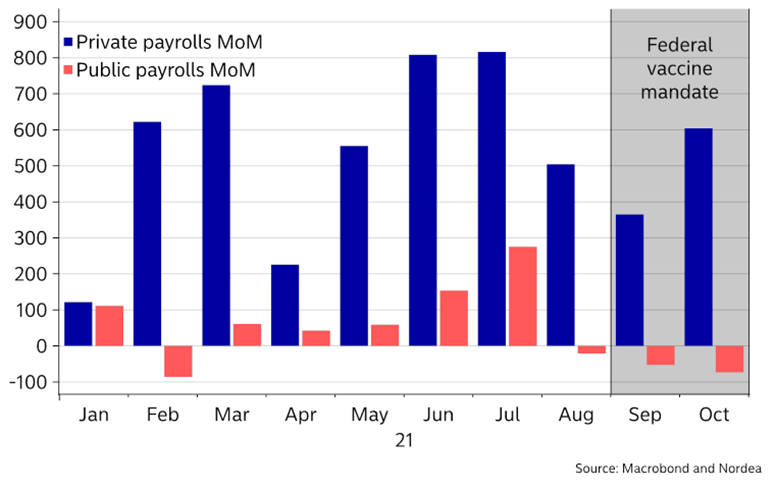
Vaccine mandates likely continue to distort the non-farm reports in the US as well. We have seen negative job growth in the public sector ever since the Federal vaccine mandate was implemented in early September, likely driven by homeschooling, restrictions in services, such as the leisure and hospitality serctors and a lack of labour supply due to vaccine mandates among other things.
This is wage inflationary, while continued restrictions in Europe and the US will keep consumption of goods elevated versus services, which is a key reason behind distressed supply chains.

