Nvidia lukker fredag i eftermarked lige på ‘make it or break it’- niveau
Morten W. Langer
lørdag 08. november 2025 kl. 9:20
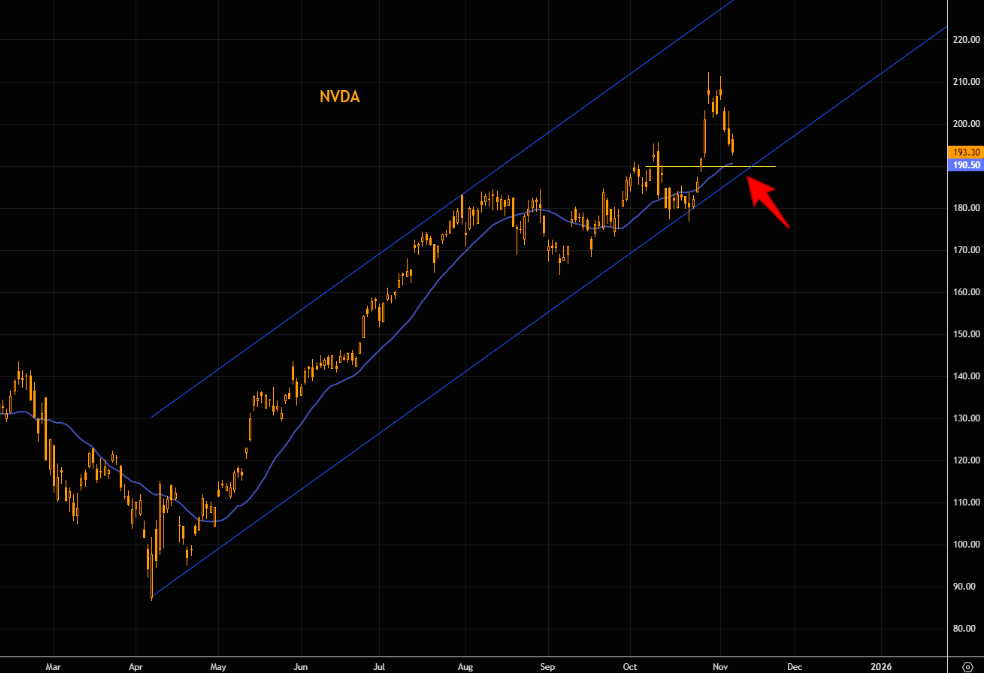
The most important level in markets
NVDA’s $190 area is huge and a must watch, irrespective if you trade the stock or not. 21 day and trend channel lows come in here. This is market’s make or break area.
LSEG Workspace
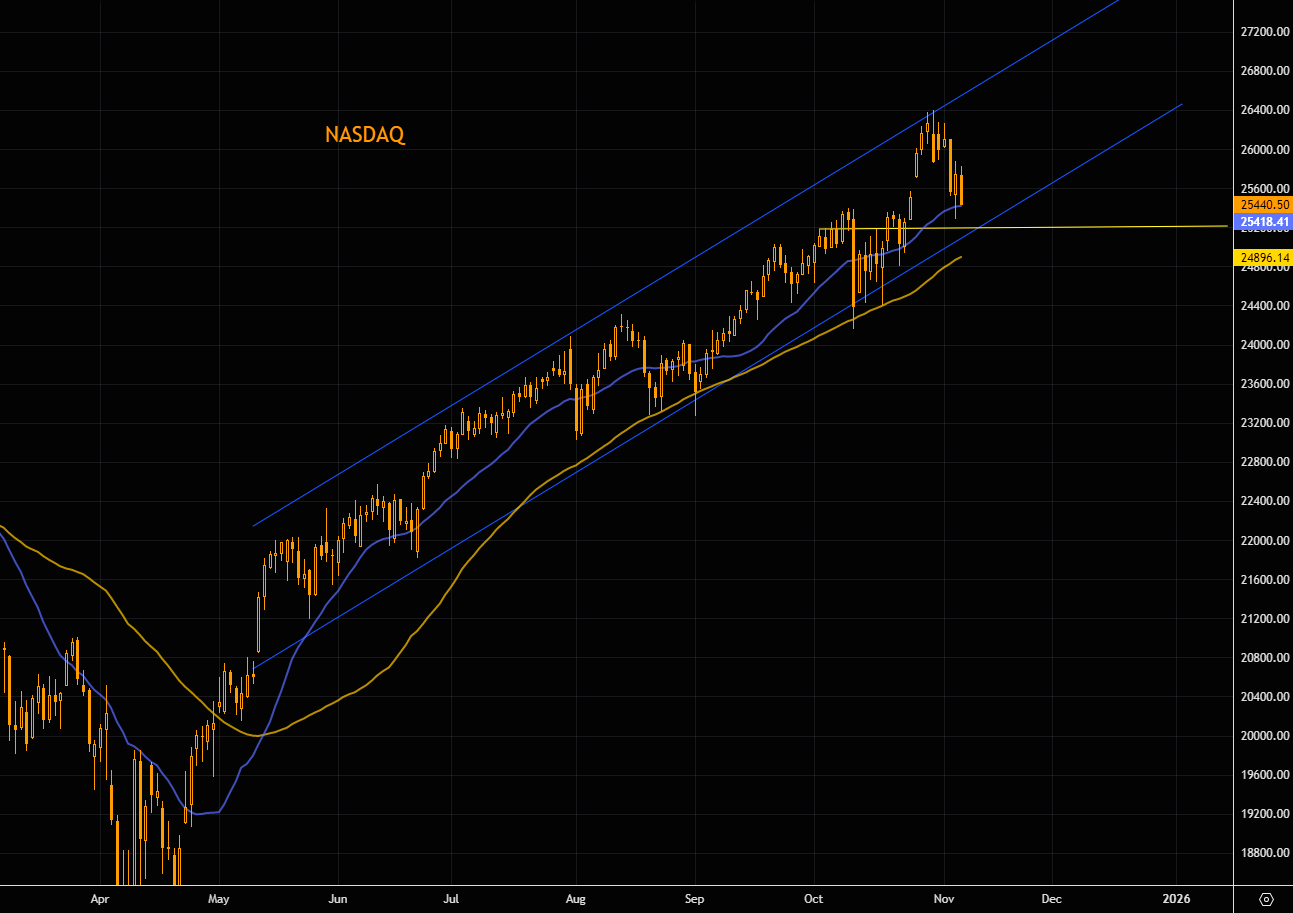
NASDAQ technicals
NASDAQ hitting the 21 day as well. Trend channel lows and the short term line in sand level at 25200 (futures). Below that we have the 50 day as the next support.
LSEG Workspace
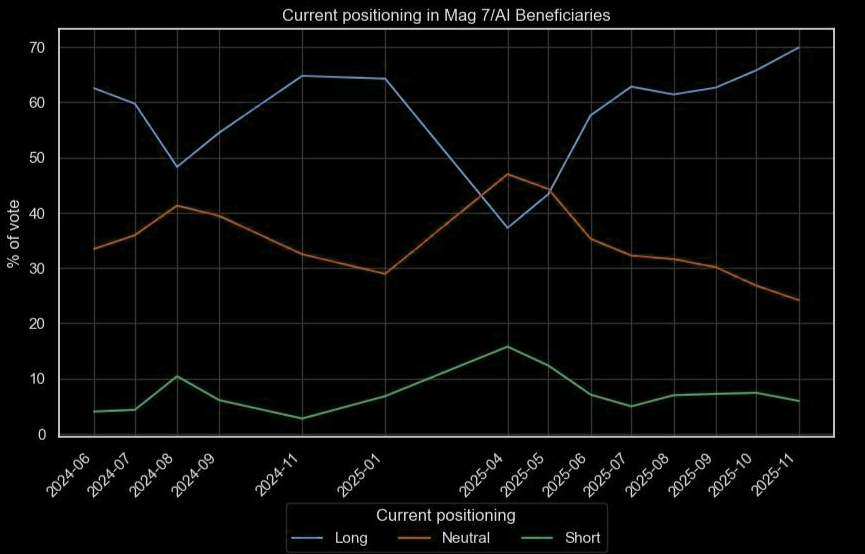
The AI long
Positioning is very long in the AI/Mag space.
GS
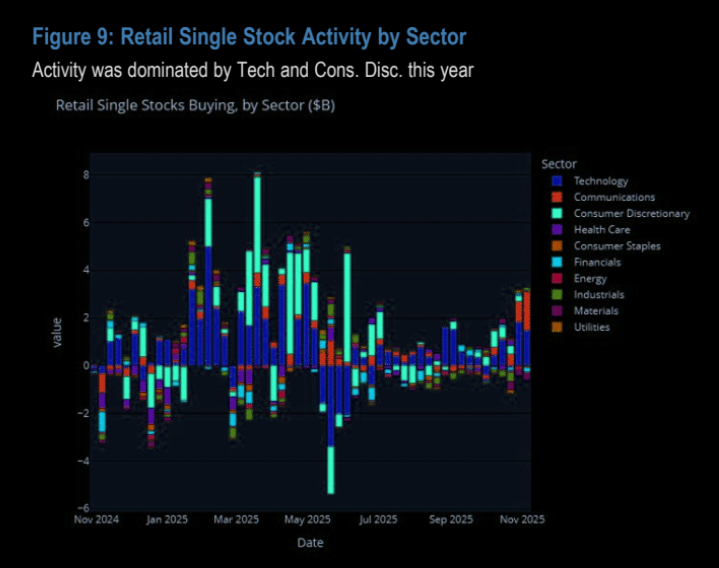
Retail Roaring: Back and Buying the Mag 7 (Again)
Retail trading activity continued to gain momentum this week, with cash equity purchases surging to $8.1B — the highest level in four months and well above the YTD average of $6.2B.
In addition to $5.3B in ETF buying, retail investors purchased $2.7B in single stocks, with activity concentrated in Technology and Communication Services. The Magnificent 7 accounted for nearly all of the single-stock buying. More on this theme here.
JPM Quant
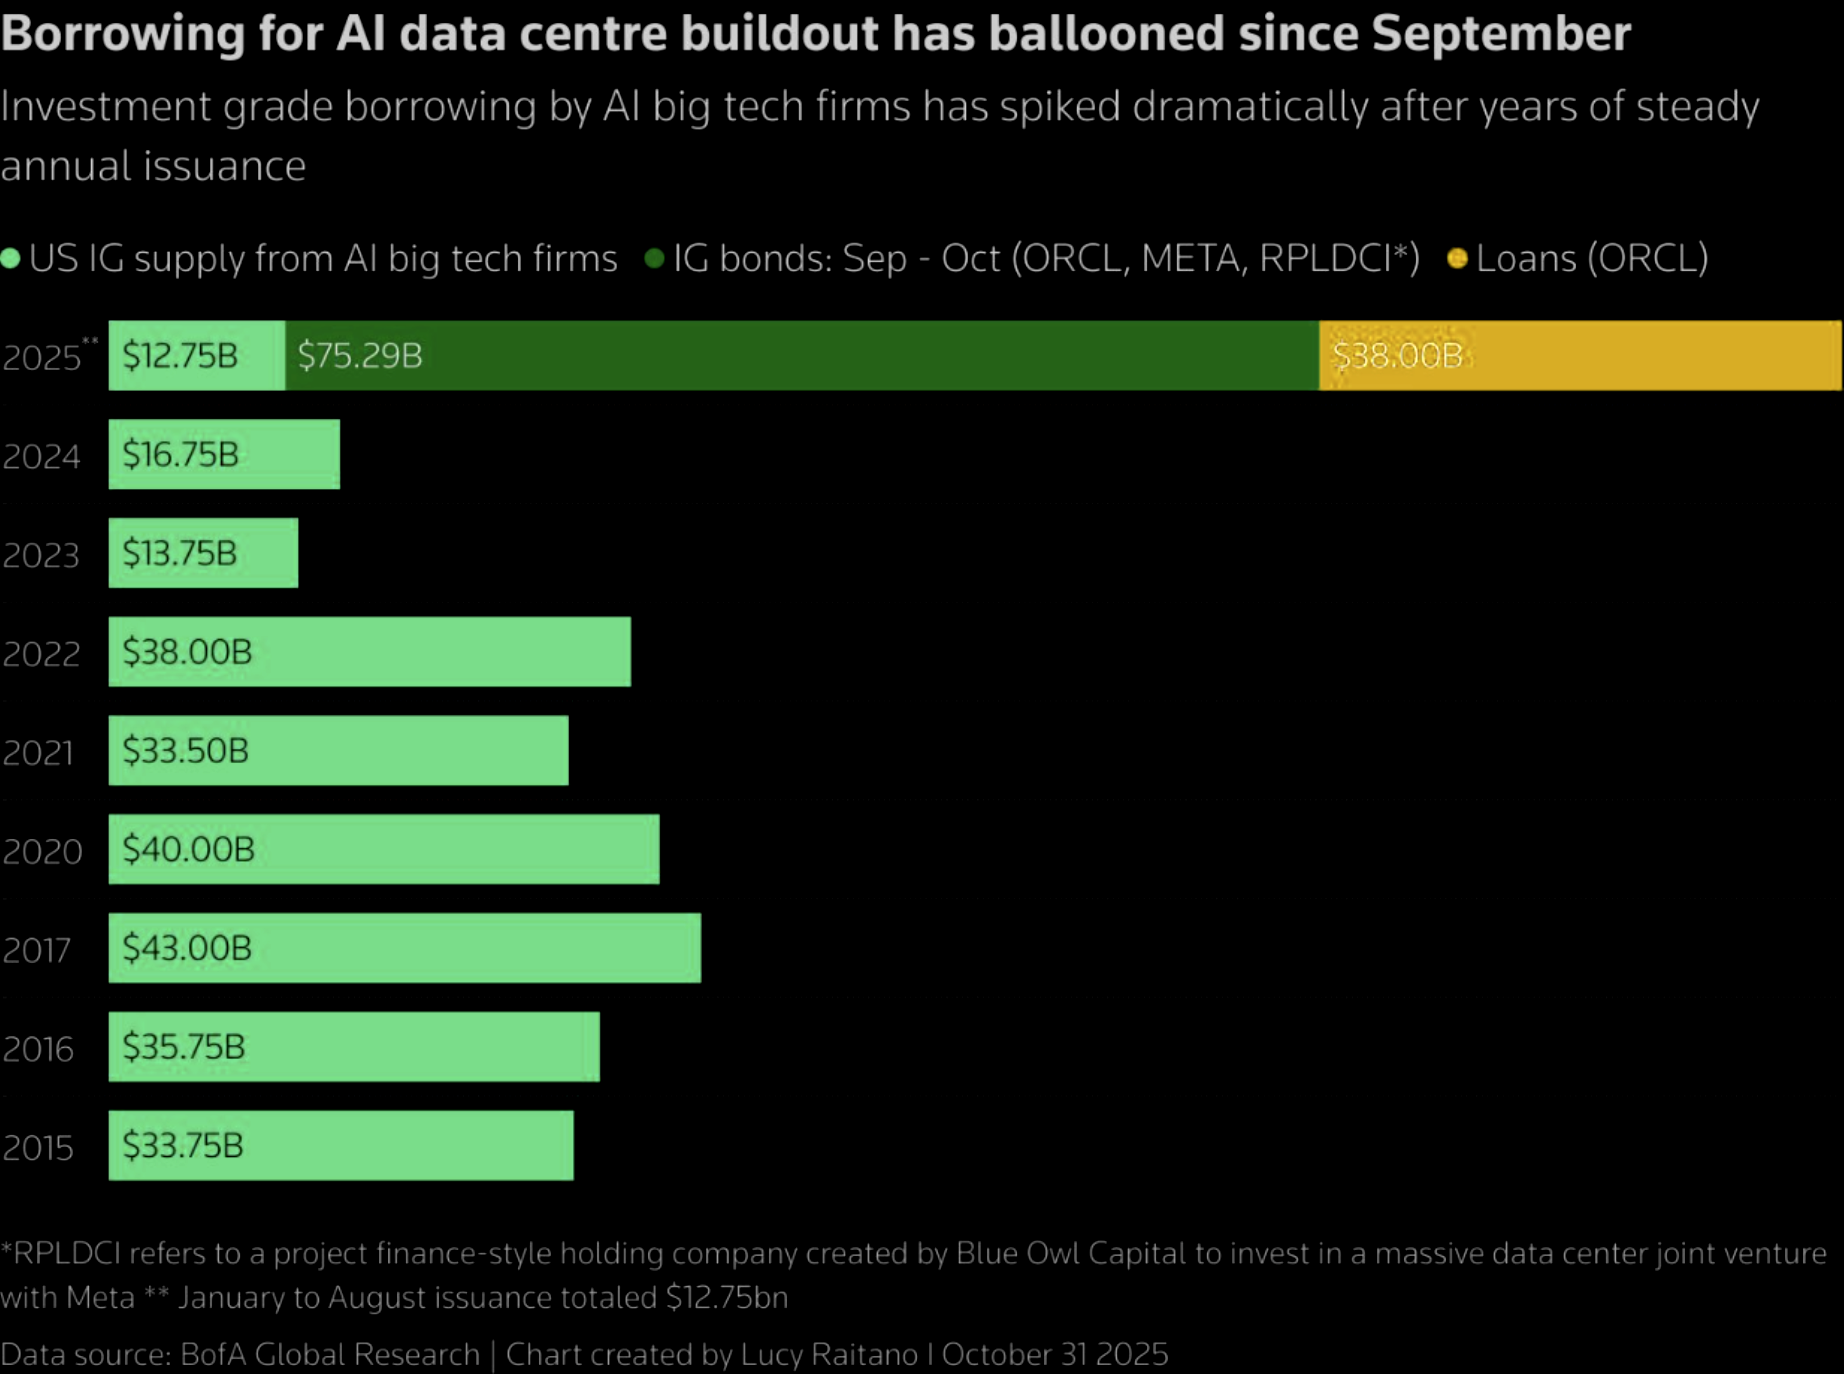
Big Tech borrowing for AI data centers
2015-2024 average: $32B/year
Sept-Oct 2025 alone: $75B
> Meta borrowed $30B
> Oracle borrowed$18B
> META also did $27B off-balance sheet with Blue Owl
AI companies now 14% of IG index.
The “money-printing” tech companies are… borrowing heavily.
@junkbondinvestor
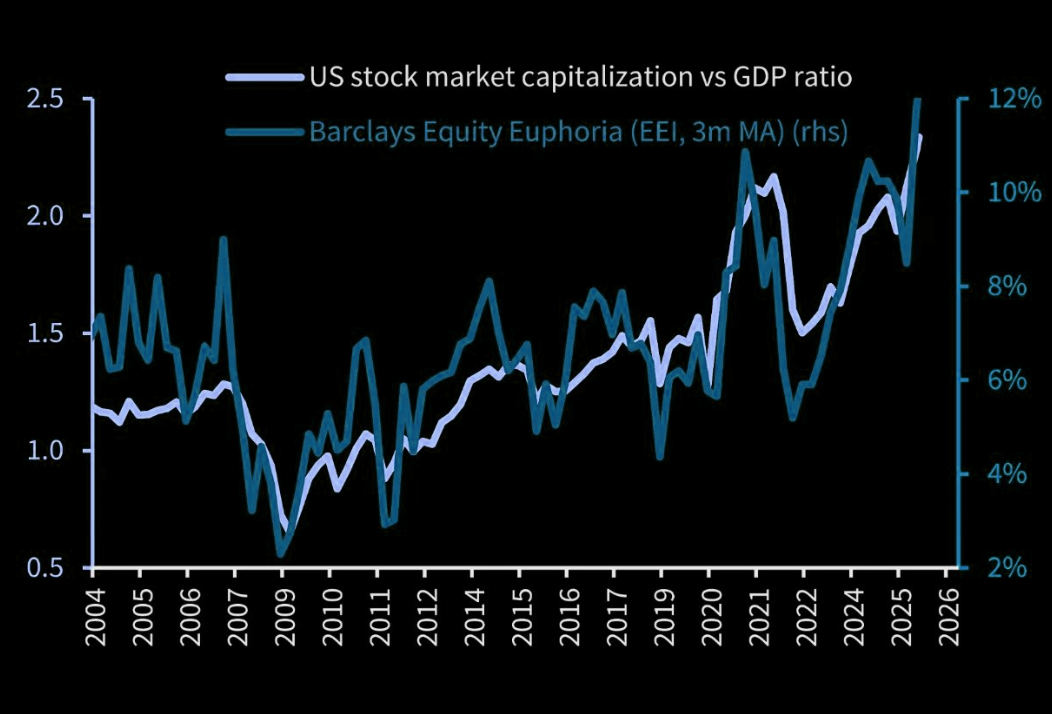
Bubble?
At least it is bubbly… Things are looking stretched, and the “Buffett” indicator just hit ATHs.
Barclays
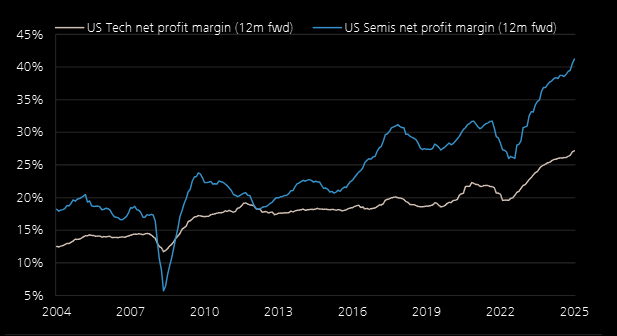
The potential bubble
UBS sees a potential bubble here: The bubble risk sits in the margins of tech, particularly semis. Margins typically compress as capital intensity rises and competition expands – think OpenAI partnering to produce more ASICs through JVs or moving into browsers and online advertising, encroaching on existing players’ turf.
UBS
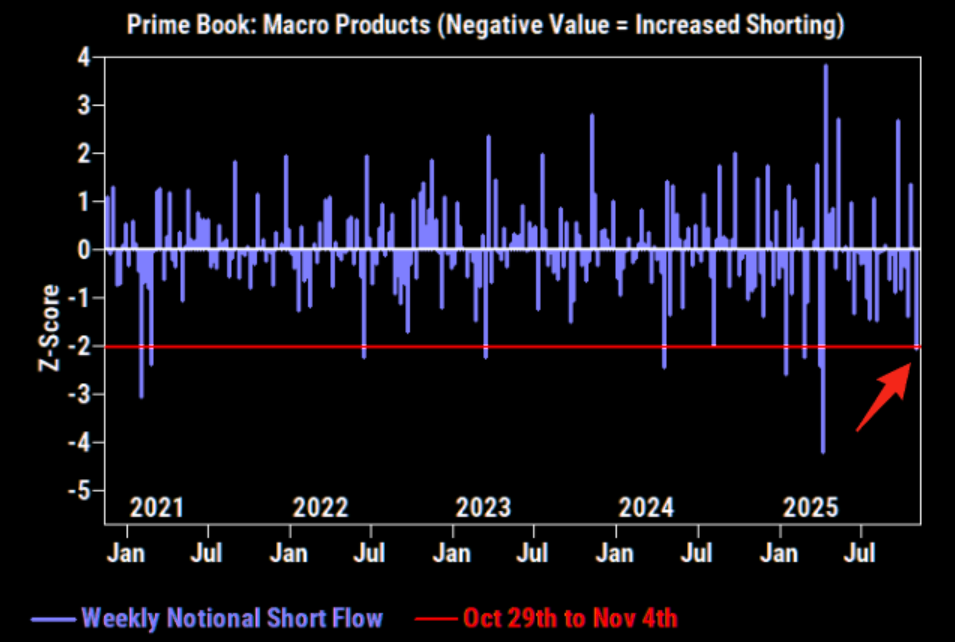
Before you get too bearish
Short activity has surged, hitting levels not seen since April and among the most extreme in years.
GS PB
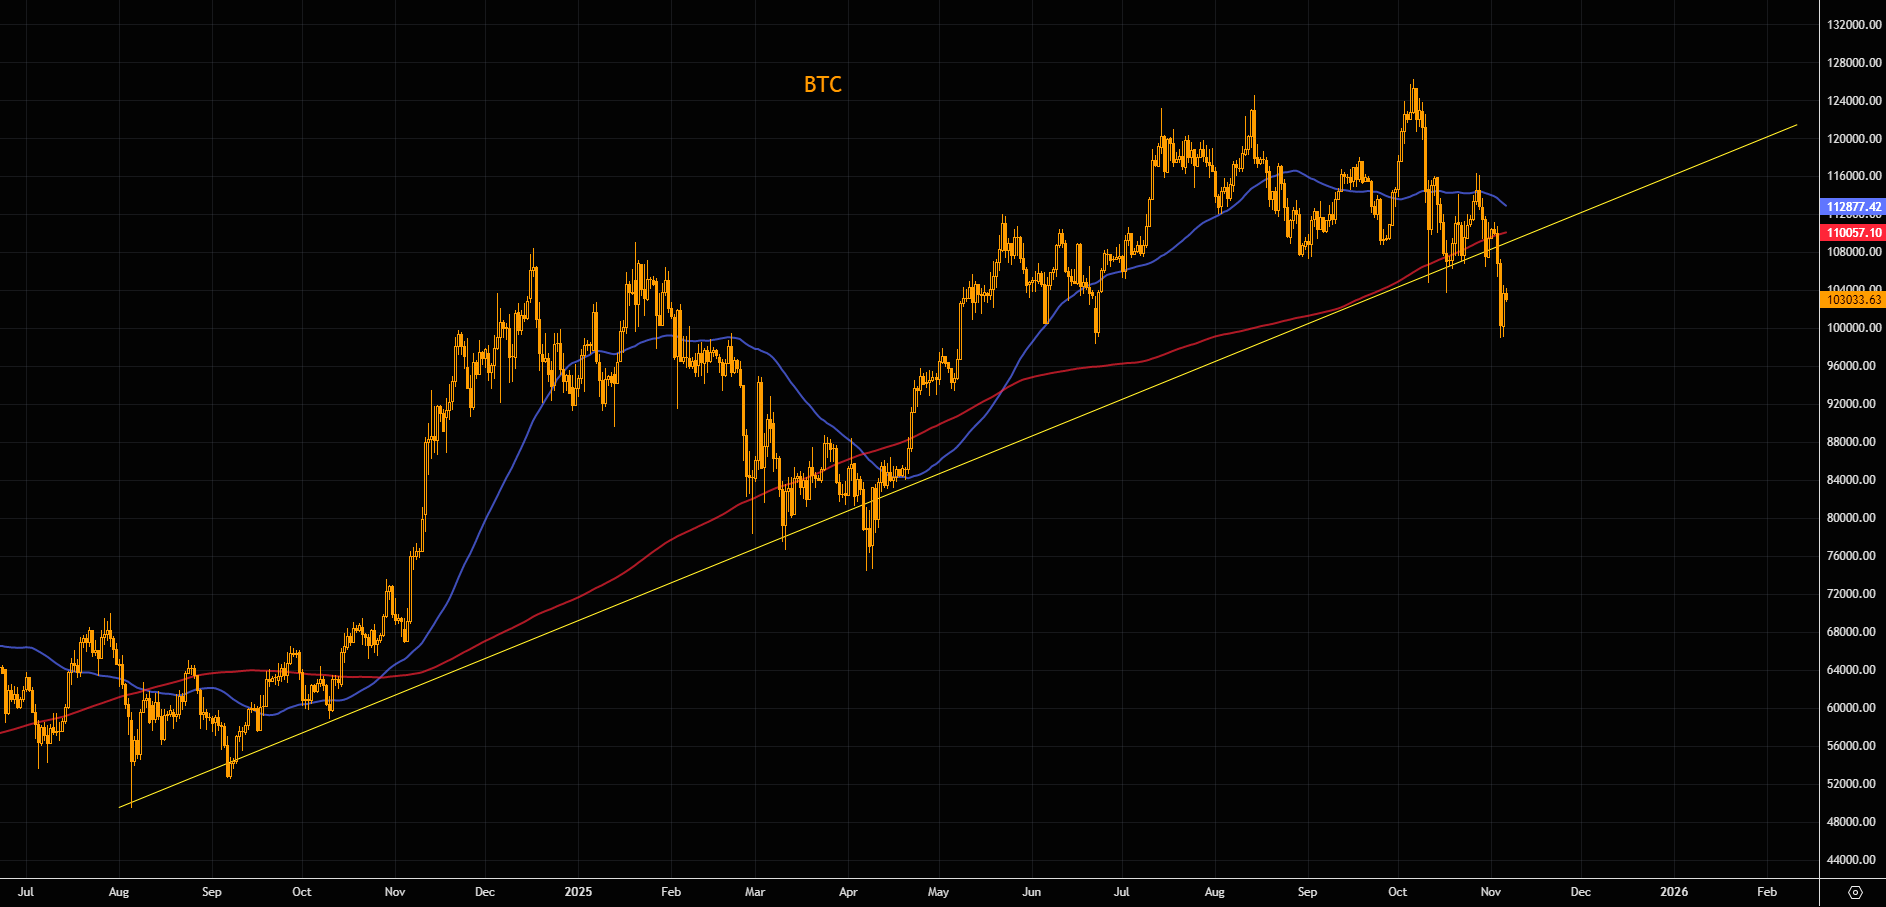
Bitcoin blues
BTC trading well below the trend line and the 200 day moving average. Let’s see how this plays out, but this ex hottie has done nothing since late last year. Note the 50 day is close to breaking below the 200 day. Last time it marked a local low. Would this time be different?
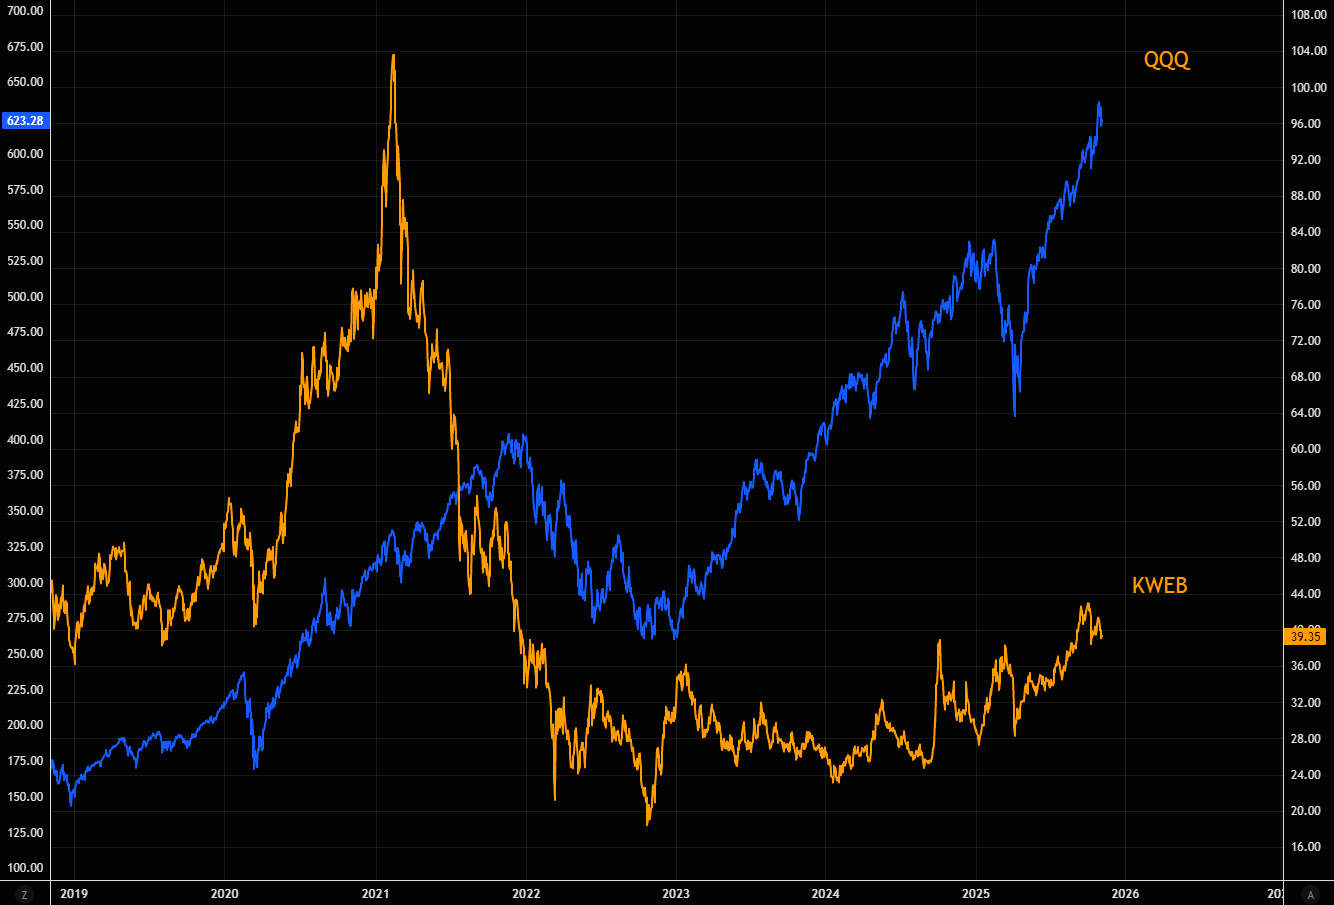
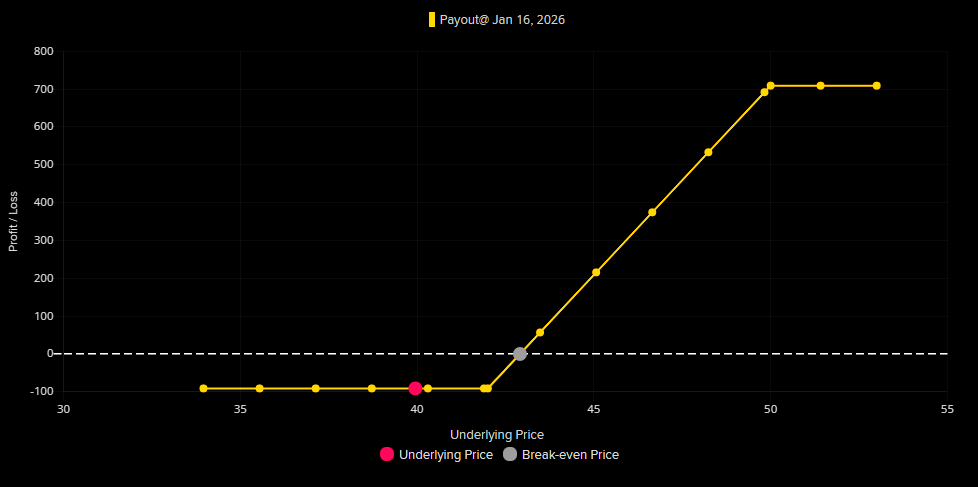
Chase QQQ here, or some KWEB instead? One way to play a possible catch up in KWEB is via call spreads. Chart 2 shows the KWEB Jan 42/50 call spread, max around 8x. More on China tech here.
LSEG Workspace
LSEG Workspace
Få dagens vigtigste økonominyheder hver dag kl. 12
Bliv opdateret på aktiemarkedets bevægelser, skarpe indsigter og nyeste tendenser fra Økonomisk Ugebrev – helt gratis.
Jeg giver samtykke til, at I sender mig mails med de seneste historier fra Økonomisk Ugebrev. Lejlighedsvis må I gerne sende mig gode tilbud og information om events. Samtidig accepterer jeg ØU’s Privatlivspolitik. Du kan til enhver tid afmelde dig med et enkelt klik.