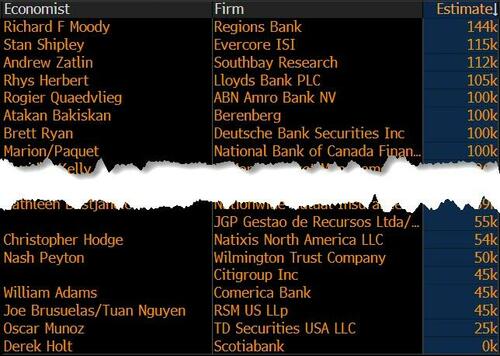
Uddrag fra finanshuse med consensus estimater
The August nonfarm payroll report, the first since Trump fired the Biden-appointed BLS commissioner Erika McEntarfer one month ago, is expected to show 75k jobs were added last month, little changed from the 73k pace in July, but attention will also be on the prior revisions, given the huge downward revisions seen in July (which also cost McEntarfer her job). The unemployment rate is expected to rise to 4.3% from 4.2%, but still below the year-end Fed median projection of 4.5%. Average hourly earnings are seen at 0.3% M/M and 3.8% Y/Y, virtually unchanged from last month.
The report will help shape Fed rate cut expectations through year-end, with September largely already priced following the weak July jobs report and signal from Fed Chair Powell at Jackson Hole. A very ugly report could prompt Powell to cut 50bps. And even if the August jobs report is not catastrophic, next week’s Benchmark revisions could be so adverse, they alone may prompt a jumbo rate cut, just like in 2024.
Fed Governor Waller (dovish dissenter) has continued to call for lower rates, noting that data will dictate the pace of rate cuts after the first reduction, so this report will also influence expectations further out on the curve. CPI, PPI and the prelim benchmark revisions are also due next week before the September FOMC meeting, which will also be key to shaping Fed rate cut expectations while the Fed looks to distinguish the distances from both inflation and labor market goals.
Overall, labor market proxies have been deteriorating sharply in recent months: Initial and Continued Claims for the NFP reference window rose, the ISM Manufacturing and Services Employment Indices were little changed but remained in contractionary territory. The ADP gauge of private payrolls rose by 54k, down from the prior 106k, while Challenger Layoffs accelerated to 86k from 62k. The July JOLTS report was also weak.
Note, Powell said at the July Press Conference, the main number you have to look at now is the unemployment rate, as the breakeven rate has come down due to drops in both labor supply and demand, which Powell said is suggestive of downside risk. Expectations of the breakeven number, based on recent Fed commentary, range from 30-80k.
With that in mind, let’s move on to the main event:
EXPECTATIONS:
- Che consensus expects 75k nonfarm payrolls to be added to the US economy in August (prev. 73k), with forecasts ranging between 0 and +144k. Private payrolls are also expected to rise by 75k which implies 0 change for government jobs.
- The unemployment rate is seen rising to 4.3% from 4.2%, with expectations ranging between 4.1-4.4% vs. the Fed’s end-2025 projection of 4.5%.
- Average earnings are seen rising +0.3% M/M, matching the July figure, with the Y/Y expected to ease to 3.8% from 3.9%. Average workweek hours are expected to be unchanged at 34.3hrs.
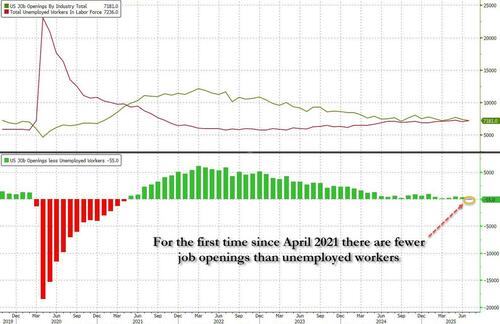
JULY REPORT: The July report was especially soft, particularly when digesting the weak two-month net revisions, to see the May report add just 19k, June 14k, and July 73k – this resulted in two-month net revisions of -258k, a much weaker labor market scenario than initially thought, and one which the Fed would have likely cut rates into. However, despite the weak payroll figures, the unemployment rate rose in line with expectations to 4.2%, below the year-end Fed median projection of 4.5%. Many have suggested that the fall in the NFP numbers is primarily due to US President Trump’s immigration policies. Therefore, labor supply has fallen, but so has labor demand, resulting in a decline in the breakeven jobs market number. Fed Chair Powell, before the July NFP report, said that the drop in the breakeven rate is suggestive of downside risk, so the number to watch is the unemployment rate. Note, expectations of the breakeven number range between 30-80k, according to recent commentary from Fed officials. Kashkari indicated it could be 75k jobs per month, Musalem suggested between 30-80k jobs, and Bostic suggested it is between 50-75k. Of note, yesterday’s JOLTs reported indicated that for the first time since April 2021, there were more unemployed workers than job openings, suggesting the US labor market is now demand-constrained, which opens the door to the next recession.
LABOR MARKET INDICATORS: The Weekly Initial Jobless Claims for the week that coincides with the NFP survey window (the 12th), saw claims in August rise to 234k from the prior month’s reference week of 217k, while continued claims rose to 1.954mln from 1.936mln. The ADP report and Challenger Layoffs, while Layoffs accelerated to 86k in August from 62k. The ISM PMI reports saw the manufacturing employment index little changed M/M at 43.8 (prev. 43.4), while the Services employment index was also little changed at 46.5 (prev. 46.4), albeit in contractionary territory. The latest Conference Board Consumer Confidence report saw consumers’ views of the labor market cool further. 29.7% of consumers said jobs were plentiful (prev. 29.9%), with 20% stating jobs were hard to get (prev. 18.9%). The July JOLTS report was soft, and kept labor market concerns alive with the economy showing a drop in labor demand, but Oxford Economics highlighted it is less worrisome than it would be otherwise since labor supply is also shrinking, largely due to the plunge in immigration.
ARGUING FOR A STRONGER THAN EXPECTED REPORT
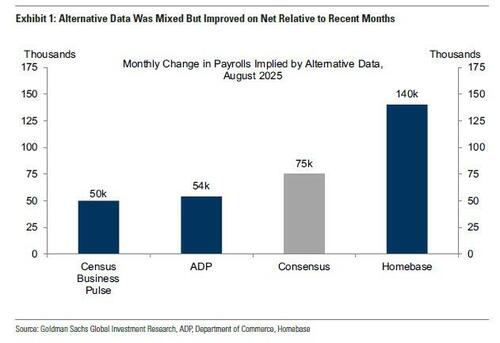
- Big data. Alternative measures of employment growth indicated a sequentially firmer – albeit still soft – pace of private sector job growth. The indicators that are tracked averaged 81k in August.
ARGUING FOR A WEAKER THAN EXPECTED REPORT
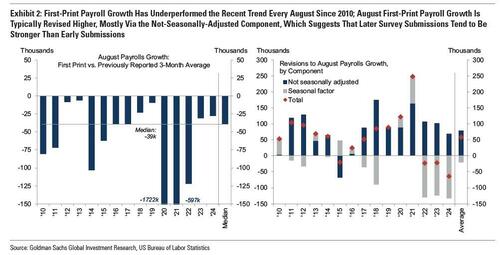
- August first-print bias. Nonfarm payrolls exhibit a clear tendency toward weak August first prints, which appears to reflect a recurring seasonal underperformance of the first vintage relative to the final vintage. This can happen because the final vintages are used to calculate the seasonal factors, which are consequently not guaranteed to be appropriate for the initial vintages. In the left panel of Exhibit 2, one can see the first-print payroll growth in August relative to the previously published three-month moving average. On this basis, August job growth has decelerated each year since 2010, and by a median of 39k. Additionally, the right panel of Exhibit 2 shows that job growth has typically been subsequently revised higher -mostly via the not-seasonally-adjusted component, indicating that later payrolls submissions from companies have tended to be more positive in August – by a median of 61k.
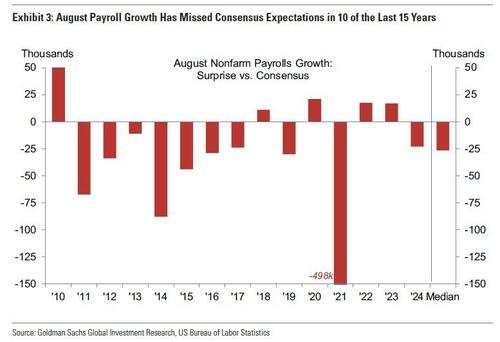
- The softness in the first vintage has tended to manifest in many of the same industries – information, professional services, manufacturing, and retail – and a sharp drop in their contribution to payroll growth on Friday would be seen as possible evidence of an August first-print bias. This bias has likely contributed to the tendency for August payroll growth to underperform consensus expectations: Exhibit 3 shows that August payroll growth has been below consensus expectations in 10 of the last 15 years.
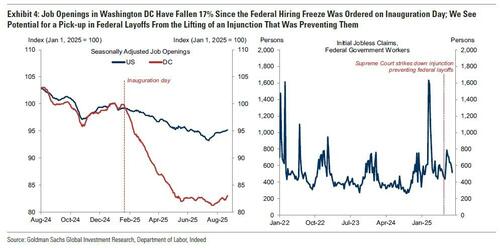
- Government hiring. Goldman expects a 20k decline in government payrolls, reflecting a 20k decline in federal government payrolls and unchanged state and local government payrolls. The ongoing federal government hiring freeze which was extended from July 15th to October 15th, is expected to continue to weigh on federal government payrolls. While more federal layoffs have been announced than appear to have been reflected in the official statistics so far, a portion of the shortfall likely reflected the impact of an injunction that paused some layoffs. That injunction was struck down by the Supreme Court in early July, and the resumption of those layoffs will impose a drag on federal government payrolls this month. JOLTS layoffs for the federal government increased from 5k in June to 10k in July.
- Strikes. The BLS’s strike report noted that newly striking workers will impose a 3k drag on August payroll growth.
MIXED/NEUTRAL FACTORS
- Layoffs. Initial jobless claims decreased to 224k on average in the August payroll month from 230k in July. The JOLTS layoff rate remained at 1.1% in July. Announced layoffs reported by Challenger, Gray & Christmas increased by 24k in August to 86k (NSA), compared to 63k on average in 2024.
- Employer surveys. Both Goldman’s manufacturing survey employment component tracker (-0.1pt to 48.7) and the bank’s services survey employment component tracker (-0.6pt to 48.4) edged down and remained in contractionary territory in August. However, the signal from survey data has been less useful—and at times misleading—during the post-pandemic period and thus has little bearing on payrolls forecasts.
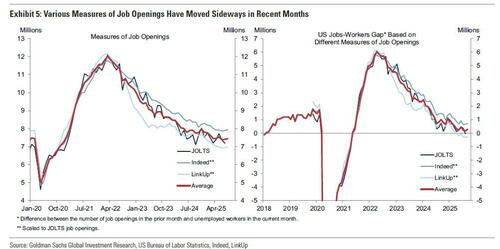
- Job availability. While JOLTS job openings decreased by 0.2mn to 7.2mn in July, averaging across a few measures of job openings suggests that openings were roughly unchanged month-over-month (Exhibit 5). The Conference Board labor differential—the difference between the percentage of respondents saying jobs are plentiful and those saying jobs are hard to get—decreased by 1.3pt to +9.7 in August, the lowest level since February 2021 and meaningfully below the 2019 average of +33.2.
FED IMPLICATIONS: In terms of the implications for Fed policy, many desks now expect a 25bps Fed rate cut in September following Chair Powellʼs warning at Jackson Hole on rising labour market risks. Powell highlighted downside employment risks, including potential layoffs and higher unemployment, signalling an easing bias. Barclays brought forward its previously expected December cut to September, while Goldman Sachs and JPMorgan reaffirmed expectations of a September cut, aligning with market sentiment. BofA and Morgan Stanley remain cautious, citing ongoing inflation pressures and economic rebound, but note that further labour market softening could prompt easing. The change in tone from Fed Chair Powell followed the woeful July jobs report. The upcoming report will be used to further shape Fed rate cut expectations to see how far away the Fed is from its goals on the labour market, particularly when compared to the distance from the Fed’s inflation goals. Note, the Fed goes into the blackout period on Saturday, so Friday is the final chance Fed officials have to speak ahead of the meeting. With September largely already priced, a hot print may derail expectations somewhat, while another weak report will only further cement a rate cut at the upcoming confab. Dovish dissenter, Governor Waller, reiterated calls for rate cuts, but said the pace of rate cuts after the first reduction will be dictated by the data, so this will also be key for rate cut expectations further out the curve. More data is due next week, including US PPI, CPI and the BLS preliminary benchmark NFP revisions.
GOVERNMENT POLICIES: The coming employment reports will provide timely evidence on the possible labor market effects of several government policies. First, tariffs could weigh on manufacturing payrolls in upcoming reports. Manufacturing employment declined by 12k per month on average over the past three months vs. -9k in 2024. Second, the federal government’s reduction in force efforts will directly lead to declines in federal government employment, and federal spending cuts might have spillover effects on state & local government, healthcare, and education. So far, there has been a moderate impact from this channel: federal government employment has declined by 14k per month on average since February while state & local government, healthcare, and education hiring has remained elevated. Third, the slowdown in immigration could weigh on hiring in industries that disproportionately rely on immigrant labor. Job growth in the industries most exposed to immigration policy changes declined to 4k in Q2 (vs. +27k on average in 2024).
PRELIM BENCHMARK REVISIONS: The BLS will release the preliminary 2025 benchmark revisions to the establishment survey at 10:00EDT on September 9th, 2025. The final revisions will follow in February 2026, alongside the January employment situation report. Each year, establishment survey estimates are benchmarked to comprehensive counts of employment from the Quarterly Census of Employment and Wages (QCEW) for the month of March, derived from state unemployment insurance (UI) tax records that nearly all employers are required to file. The preliminary estimate is based on QCEW data covering April 2024–March 2025. Importantly, the September release will provide only the implied revision to the March 2025 level of payrolls, with no historical data yet updated. As we discussed recently, there will likely be a downward revision of 500k to 1mln, implying that payrolls as of March 2025 may have been overstated by 40k–85k per month on average over the April 2024–March 2025 period. BofA also highlights that revisions for April–December 2025, which matter most for the Fed, will only be available with the final benchmark in February 2026. For context, the March 2024 nonfarm employment level was ultimately revised down by –598k in the final, compared with a preliminary estimate of -818k which was first released last August. As we discussed, it was perhaps the biggest catalyst for the 25bps jumbo rate cut (much more here).
MARKET REACTION
As usual, we start with JPMorgan’s Market Intel desk which has laid out the following scenario analysis:
- Above 110k. SPX gains 1% to loses 1.5%; odds: 5%
- Between 85k – 110k. SPX gains 50bp – 1.25%; odds: 25%
- Between 65k – 85k. SPX gains 50bp – 100bp; odds: 40%
- Between 40k – 65k. SPX gains 25bp – 50bp%; odds: 25%
- Below 40k. SPX loses 25bp – 75bp; odds: 5%
JPM Market Intel desk comments on NFP:
First, these outcomes are skewed positively which we think reflects the market’s view that this print is unlikely to impact the September Fed meeting. A weaker than expected print will increase calls for 50bp, and the magnitude of the downside risk could re-anchor investor expectations around the timing of a recession. However, based on JPM Econ’s upgrade of Q3, a recession narrative is unlikely to materialize. So, an upside print is where the source of risk lies; but, it would take a significant reboot of the labor market to push the Fed to the sideline. JPM’s estimate is that you would need to see NFP print between 175k – 200k jobs for this scenario to materialize. Second, we think the September 11 CPI is more critical as the Fed has moved from ‘balanced risks’ to target the labor market, so a hotter CPI print when combined with a stronger than expected NFP print is the most probabilistic setup that would push the Fed into a pause.
What will it take for the Fed to cut 50bps:
Earlier we looked at an analysis by Standard Chartered which asked what would it take for the Fed to cut 50bps (just like it did exactly one year ago). The answer: “investors would want to see NFP below 40k and the UR at 4.4% or more for a 50bps cut to be on the table.”
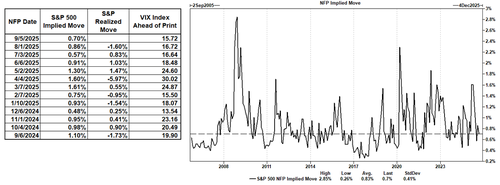
Historical NFP Implies and realized moves:
The option straddle is pricing in a 0.70% move tomorrow, which would be one of the lowest NFP day moves if it materializes. Notably, the last time the VIX was lower ahead of the NFP print was in February 25.
Finally, here are some thoughts from across the Goldman trading desk:
Vickie Chang (Global Macro Research)
There are risks to the market from a meaningful surprise on either side, so an inline or slightly softer print is probably the most welcome outcome for risk assets. Our estimates suggest that the market is pricing growth at around 1.8%, somewhat above our nearer-term forecasts and in line with our 2026 q4/q4 forecasts of 1.8%. Our forecast for +60k and a tick up in the unemployment rate to 4.3% is likely in that range of benign outcomes that don’t pose a challenge to current growth pricing and that reinforce the market’s pricing of a September cut.
With market pricing already reflecting better growth ahead, the risk from a weaker print is still that a sharp enough rise in the unemployment rate, say to >=4.4%, leads the market to worry about recession—in that scenario the market would likely pull forward cuts and equities would come under pressure. Because growth pricing has been relatively resilient over the last month and the more notable macro driver has been a shift towards pricing a more dovish Fed, the risk from a properly strong print—or broader signs that growth is holding up—is that the market reverses that dovish Fed view, putting upward pressure on rates in a way that is less supportive of risk assets. Equity volatility and skew have risen a little, so put spreads may be the simplest form of short-dated protection. Because rates move differently in the two risk cases, there is no single implementation, but receivers on US front-end rates (1m2y) look appealing for the downside case while terminal rate pricing may be more vulnerable to a much stronger print.
Ryan Hammond (US Portfolio Strategy)
Equity market pricing suggest that investors continue to look through near-term weakness in economic data, instead anchoring on a resilient 2026 economic and earnings growth outlook alongside the prospect of Fed easing. The market pricing of economic growth appears consistent with roughly 2% real US GDP growth, broadly similar to our 2026 forecast. A print in line with or slightly better than consensus on Friday would likely validate this view, pushing equity prices higher. However, given the relatively optimistic starting point and interplay with Fed easing, we believe that upside to the S&P 500 from current levels will be modest. The narrow breadth YTD rally in equities also suggests that there’s room for a further squeeze higher in low-quality laggards if the macro data prove friendly. However, if the jobs report is much weaker than expected, it will likely test investors’ ability to look through near-term weakness and push equity prices lower.
Shawn Tuteja (ETF/Basket Vol Trading)
The set up into this NFP is a bit murkier than we’ve had in the past few months. On the one hand, we’re imminently expecting rate cuts to start, so it’s a bit harder for the broader market to trade the “policy mistake” trade on slightly weak data, which makes me think equities should trade okay in most scenarios. On the other hand, we’ve seen local pain in the AI trade and a sector rotation over the past 3 weeks that has forced some of our clients to degross and take down nets, so there’s the potential that clients are more defensive than offensive in trading nature. We’re also sitting near some key moving averages across some large index weights, with systematics fairly full. The consensus range we hear from clients heading into this Friday’s NFP is 50-75k, which likely coincides with the distribution that equities react the most friendly to.
At a high level, both tails of the distribution are a bit worrisome, especially with the market at elevated valuations. Should we print a weak NFP (<15k headline and no revisions upward in prior months), I think the Sep meeting can go from ~23 bps priced to closer to a coinflip on whether the FOMC decides to cut by 25 or 50 bps. I think “weak” has levels to it – if we print 10-15k and the rates market is pushing the Fed to go 50 bps, I think broader equities can be ok with this scenario. If we print a negative number with downward revisions, that seems to be a scary tail at these valuations. In that scenario, we think the best trade is to short GSPUCYDE (cyclicals vs defensives ex commodities), which is essentially at the all-time highs and has many positives in the price.
On the other side of the distribution, I think the really strong number still keeps us on the path of 2 cuts this year (recall the last SEP was 3.1% inflation, 4.5% unemployment = 2 cuts through yearend). While backend bonds won’t like it, do equities react immediately to 10s going to 4.3% yield? We just saw this level of yields in the past few days, and my gut is that initially, a really strong print is more well-received than a really weak print. I think the very strong NFP print would be more of a medium-term tailwind to equities (particularly RTY), as the curve likely continues to steepen and eventually equities have to deal with the 5% in 10-year yield scenario that they haven’t really liked in the past.
Joe Clyne (Index Vol Trading)
Heading into NFP, SPX sits less than a percent from all-time highs, even after the market gyrations of the last few days. While last NFP was a shock to the market, sparking a 1.6% selloff due to weak numbers and weaker revisions, the straddle looks to price at just around 65 bps tomorrow. The desk view is that in general for tomorrow, a stronger jobs number should mean a more positive market reaction as concerns about growth are more top of mind than ambiguity surrounding rate cuts through year end. With skew close to the highs and vol off the lows, we think Oct put spreads in SPX are the optimal hedge for those looking to play a soft number. Something like the Oct 5700 6300 put spread ref 6463f for 50 dollars screens as attractive with a 12:1 payout where you buy a vol in the 15s and sell one in the mid 20s. On the topside, we think options are a touch less interesting as we expect vol to retrace lower on a rally, but something like the Oct 6600 6750 call 1×2 for 24 dollars looks like a good trade to play for a grind higher in equities and is long delta and short vol at inception. NDX vol spreads look high to SPX so we would concentrate long optionality in SPX. RUT has been quite responsive to data surprises, so we don’t mind owning IWM topside despite the stretched vol spread to SPX.

