
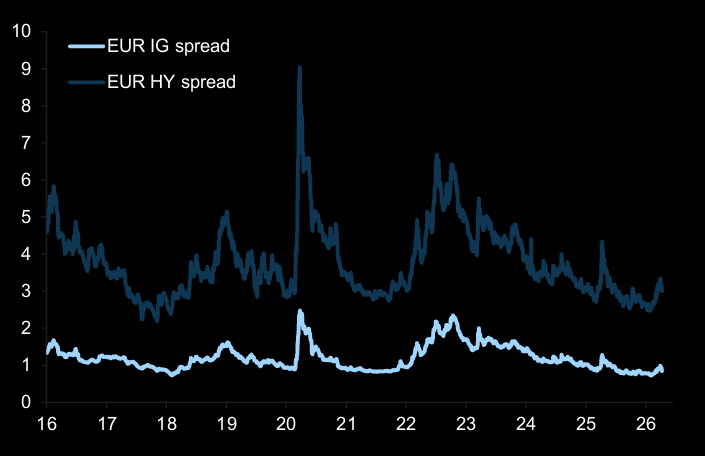
Credit spreads remain tight. Chart shows EUR IG and HY spreads.
Source: Datastream
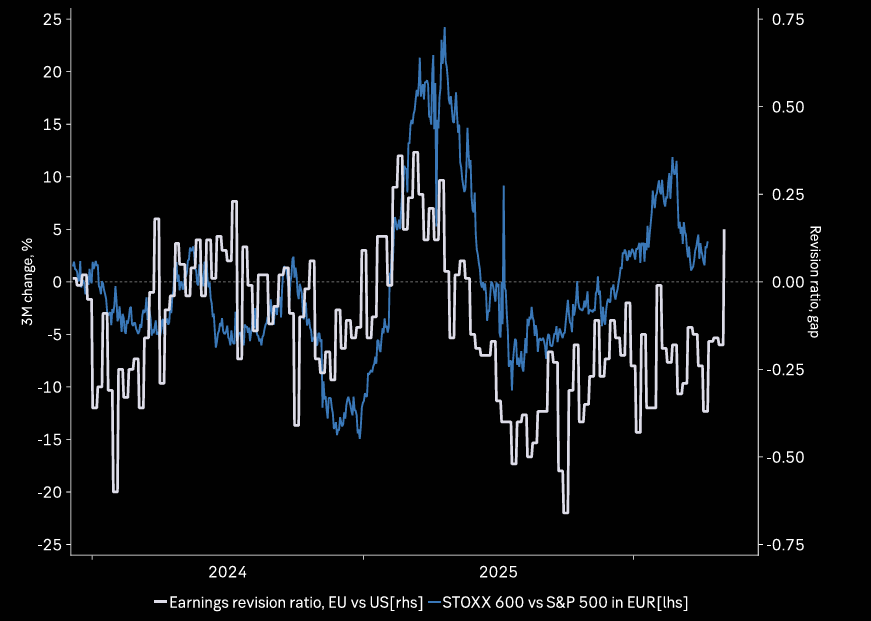
Better earnings revisions
European earnings revision ratio now better than the US. Chart shows Europe vs the US revision ratio and STOXX 600 vs S&P 500 in EUR.
Source: Macrobond
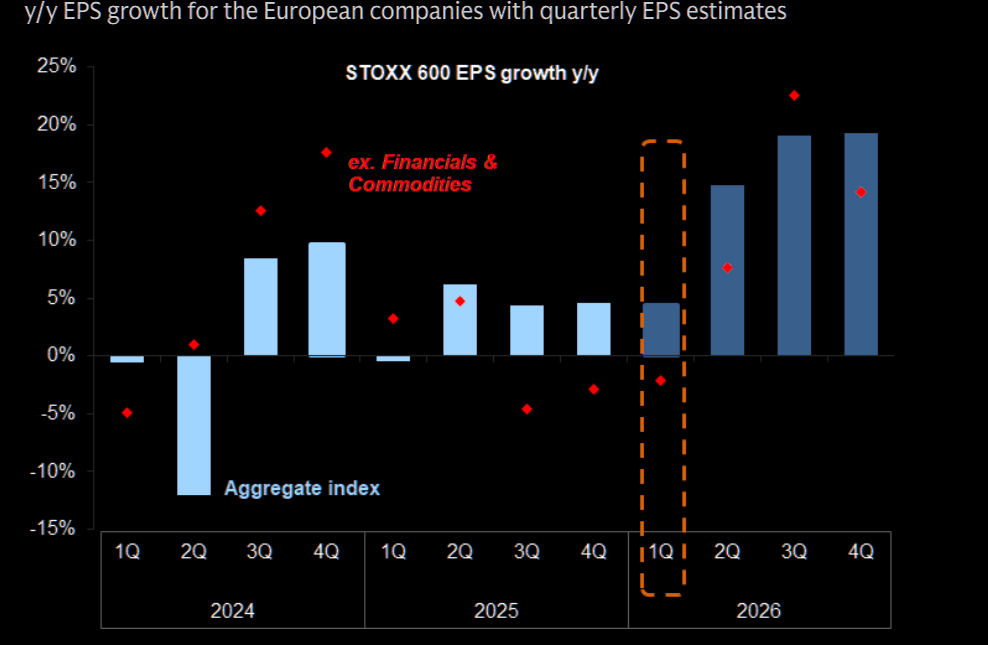
Q1 EPS
Not that bad for Europe. Analysts expect 4% earnings growth in Q1, mainly generated by Financials and Energy.
Source: FactSet
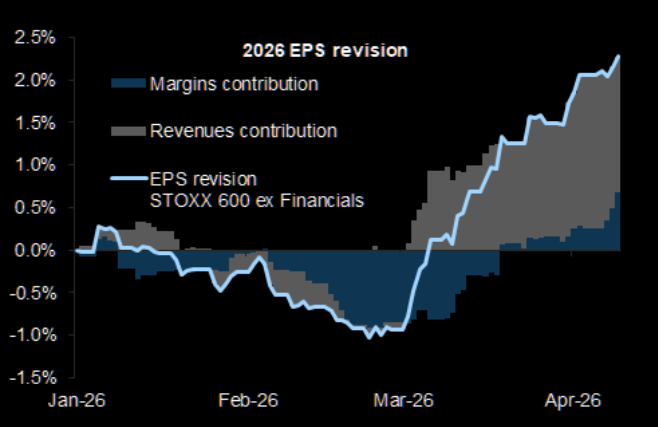
Revised up
Since the start of the Iran war, consensus estimates for STOXX 600 2026 margins have been revised upwards.
Source: FactSet
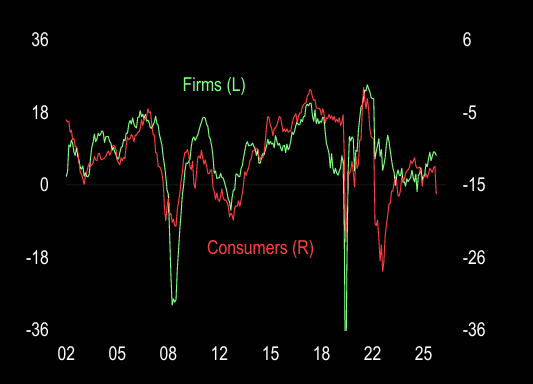
Unlike households, firms are optimistic
Consumer confidence in the EZ fell noticeably in March amid concerns over higher inflation. In contrast, firms remain optimistic, likely anticipating a short-lived conflict.
Source: Numera
The Bad
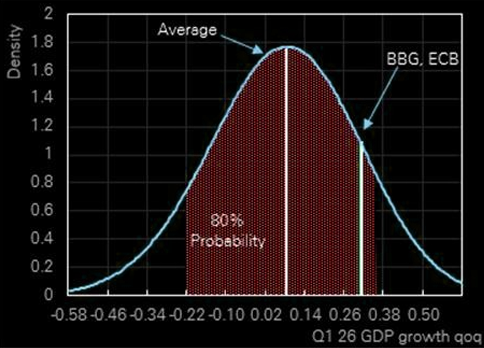
Downside risk to “no growth”
DB: “Our nowcast points to a downside risk to our GDP forecast of +0.1% QoQ for Q1-26.”
Source: DB
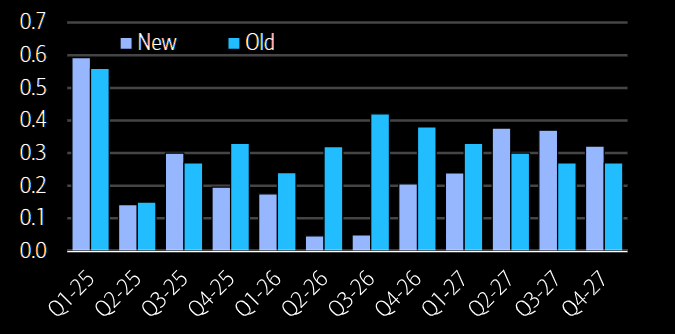
No technical recession, but…
No technical recession, but a shallow recovery, says BofA. Chart shows quarterly Euro area GDP growth forecasts now vs before the energy shock.
Source: BofA
The Ugly
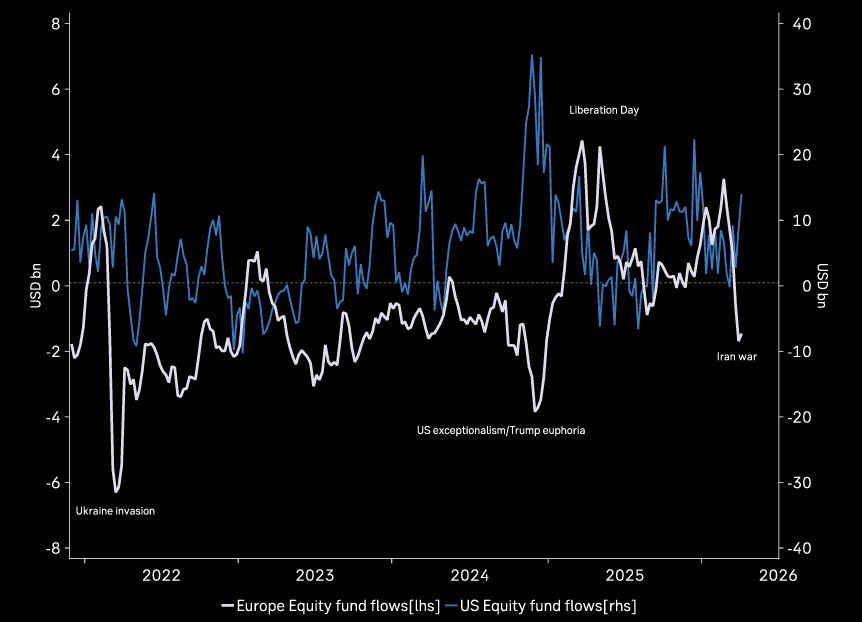
Flows turn negative
European equity fund flows have turned negative. Chart shows equity fund flows, Europe vs US.
Source: Macrobond
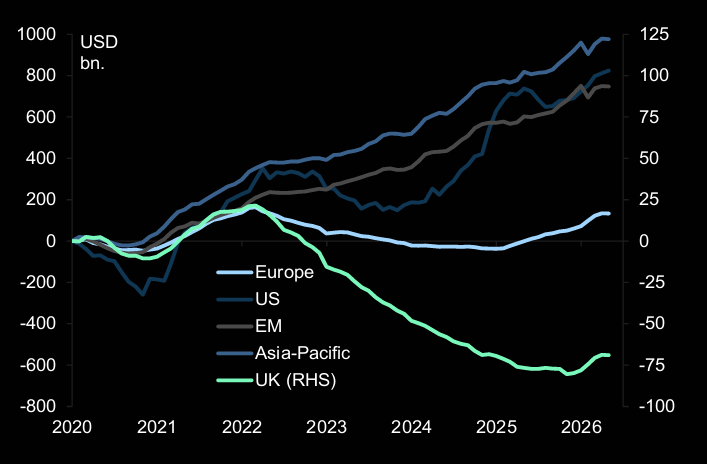
More on flows
Cumulative flows into European equities remain much weaker than for all other regions.
Source: EPFR
European volatility
The gap between VIX and V2X remains wide, with European volatility still relatively stressed despite the broader global reset.
Maybe things aren’t as great in Europe as the bounce suggests (Friday’s levels).
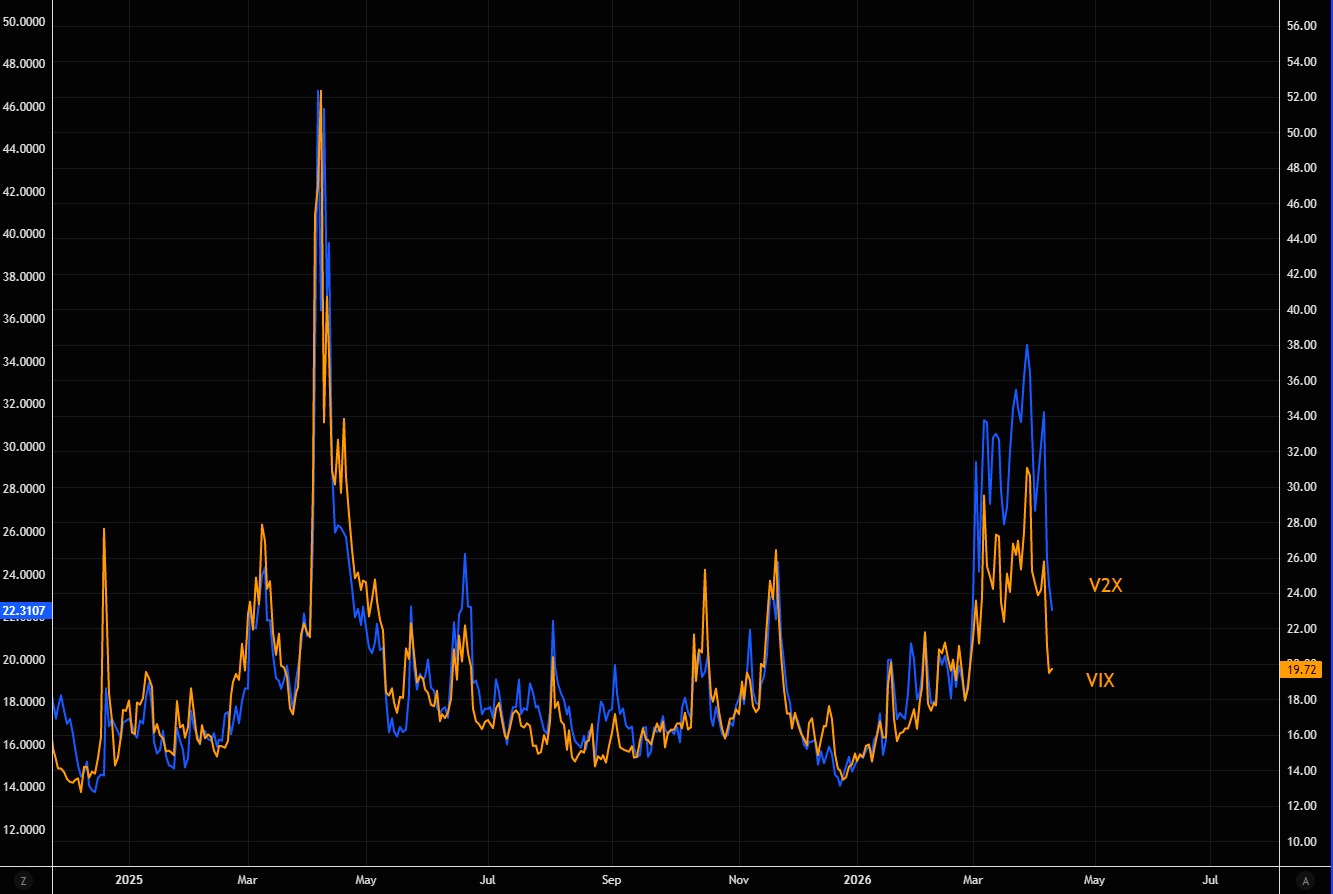
Source: LSEG Workspace
Valuation
Shareholder yield
In Europe, the total shareholder yield remains high…
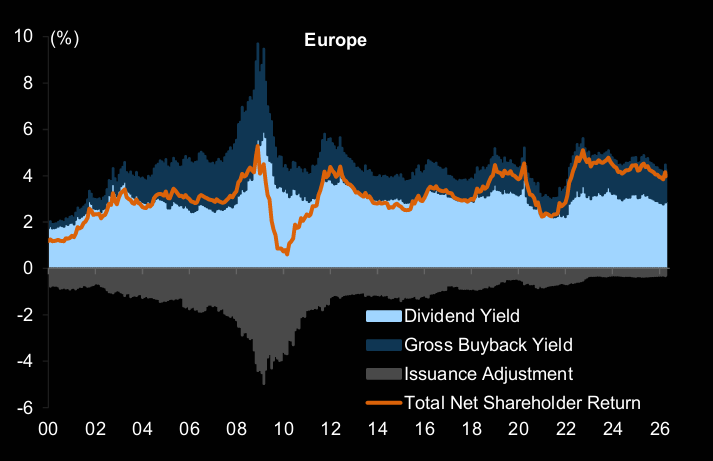
Source: Goldman
Deep discount
Europe trading at a deep discount to the US. Chart shows Europe relative to the US 12m forward P/E.
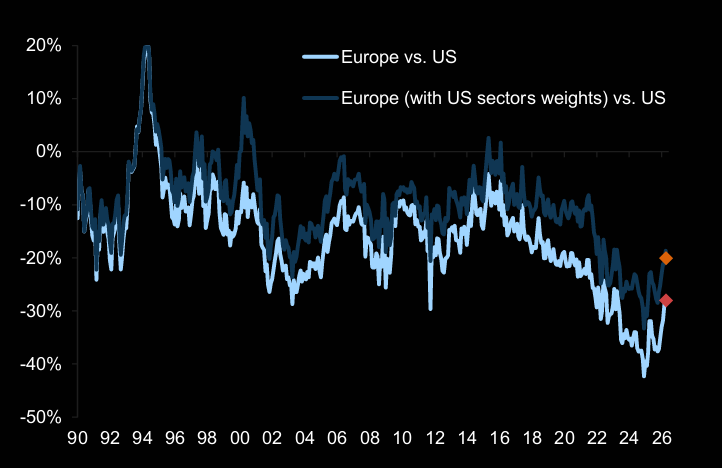
Source: Datastream
Sector discount
The majority of sectors in Europe are on a wider-than-usual discount to their US counterparts.
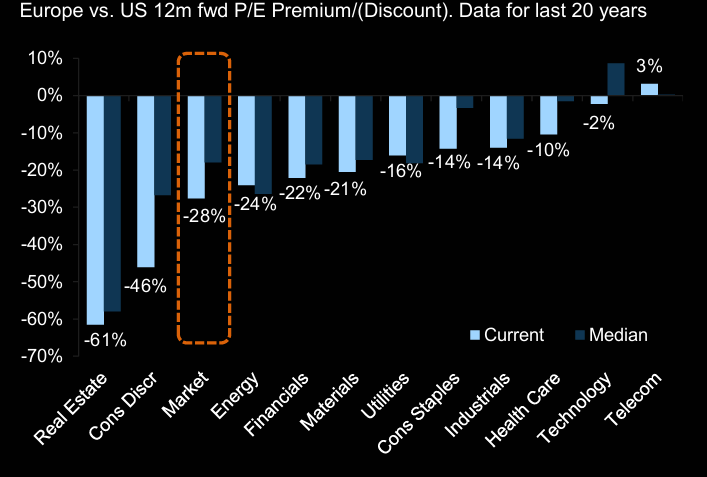
Source: FactSet