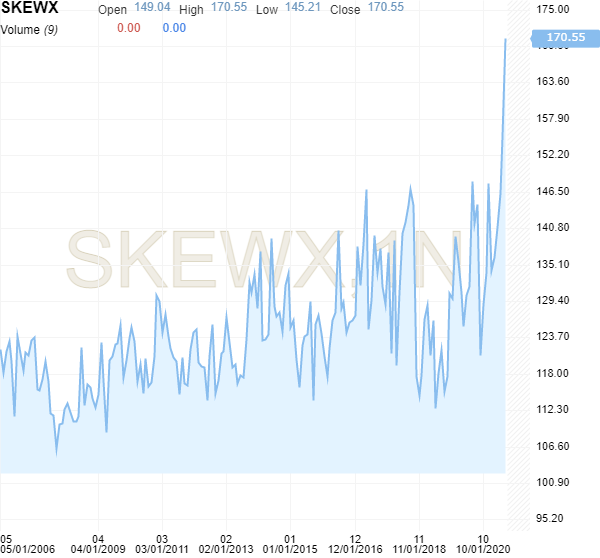
Graf: Fredag steg skew indeks udenfor den tidligere historiske skala. Se også nedenstående forklaring på skew.
Fra Investopedia:
What Is the SKEW Index?
The SKEW index is a measure of potential risk in financial markets. Much like the VIX index, the SKEW index can be a proxy for investor sentiment and volatility. The Skew Index measures perceived tail-risk in the S&P 500. Tail-risk is a change in the price of the S&P 500 or a stock that would place it on either of the tail ends, or the far edges of the normal distribution curve. These price changes typically have a low probability.
Understanding the SKEW Index
The SKEW index is calculated using S&P 500 options that measure tail risk — returns two or more standard deviations from the mean — in S&P 500 returns over the next 30 days. The primary difference between the VIX and the SKEW is that the VIX is based upon implied volatility round the at-the-money (ATM) strike price while the SKEW considers implied volatility of out-of-the-money (OTM) strikes.
SKEW values generally range from 100 to 150 where the higher the rating, the higher the perceived tail risk and chance of a black swan event. A SKEW rating of 100 means the perceived distribution of S&P 500 returns is normal and, therefore, the probability of an outlier return is small.
Specifically, the index measures the slope of implied volatility, which can then be expressed as the probability of a two or even three standard deviation move by the S&P 500 over the next thirty days. Skew can thus be used to help determine risk.
To understand how the SKEW Index translate to risk, consider that each five-point move in the SKEW Index adds or subtracts around 1.3 or 1.4 percentage points to the risk of a two-standard deviation move. Similarly, a five-point move in the index adds or subtracts approximately 0.3 percentage points to a three-standard deviation move.
The index increases general market awareness among investors. As the slope of implied volatility moves higher, it raises the SKEW Index, which indicates that a Black Swan event is becoming more likely but not that it will actually occur.