Uddrag fra Conference Board
The Conference Board Leading Economic Index® (LEI) for the US Declined in June
Latest Press Release
Updated: Monday, July 21, 2025
Using the Composite Indexes: The Leading Economic Index (LEI) provides an early indication of significant turning points in the business cycle and where the economy is heading in the near term. The Coincident Economic Index (CEI) provides an indication of the current state of the economy. Additional details are below.
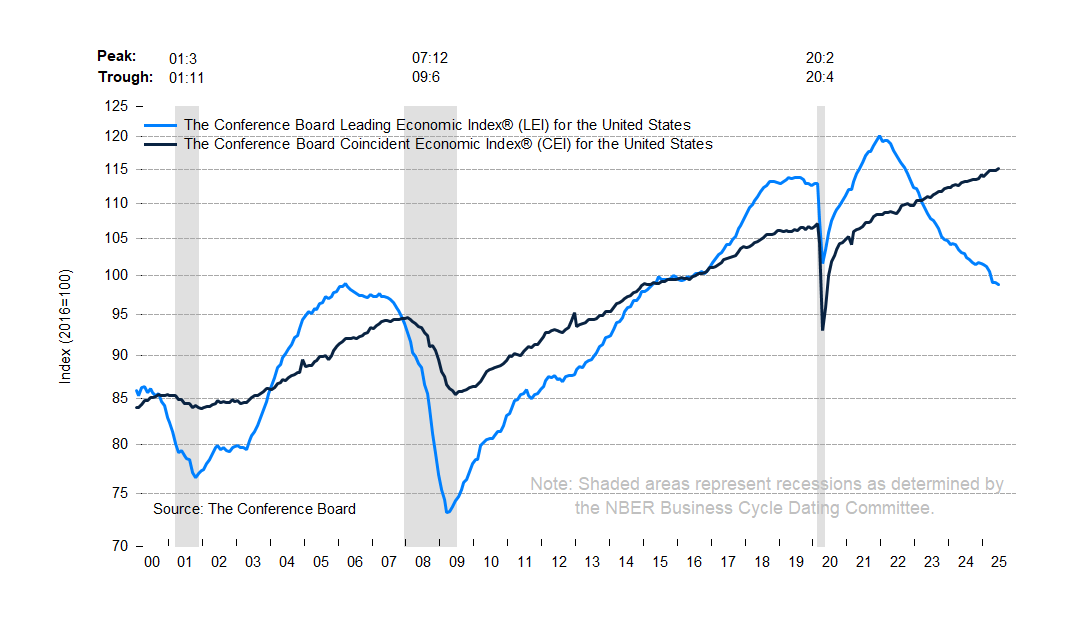
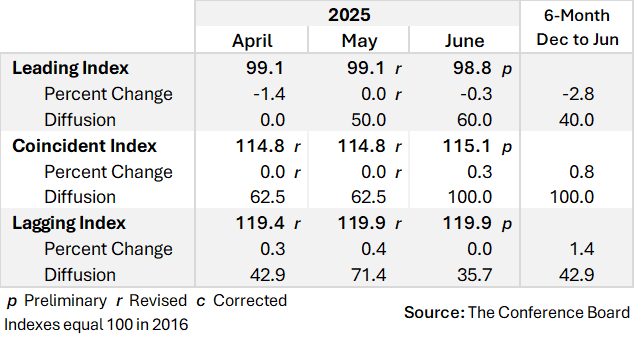
The Conference Board Leading Economic Index® (LEI) for the US declined by 0.3% in June 2025 to 98.8 (2016=100), after no change in May (revised upward from –0.1% originally reported). As a result, the LEI fell by 2.8% over the first half of 2025, a substantially faster rate of decline than the –1.3% contraction over the second half of 2024.
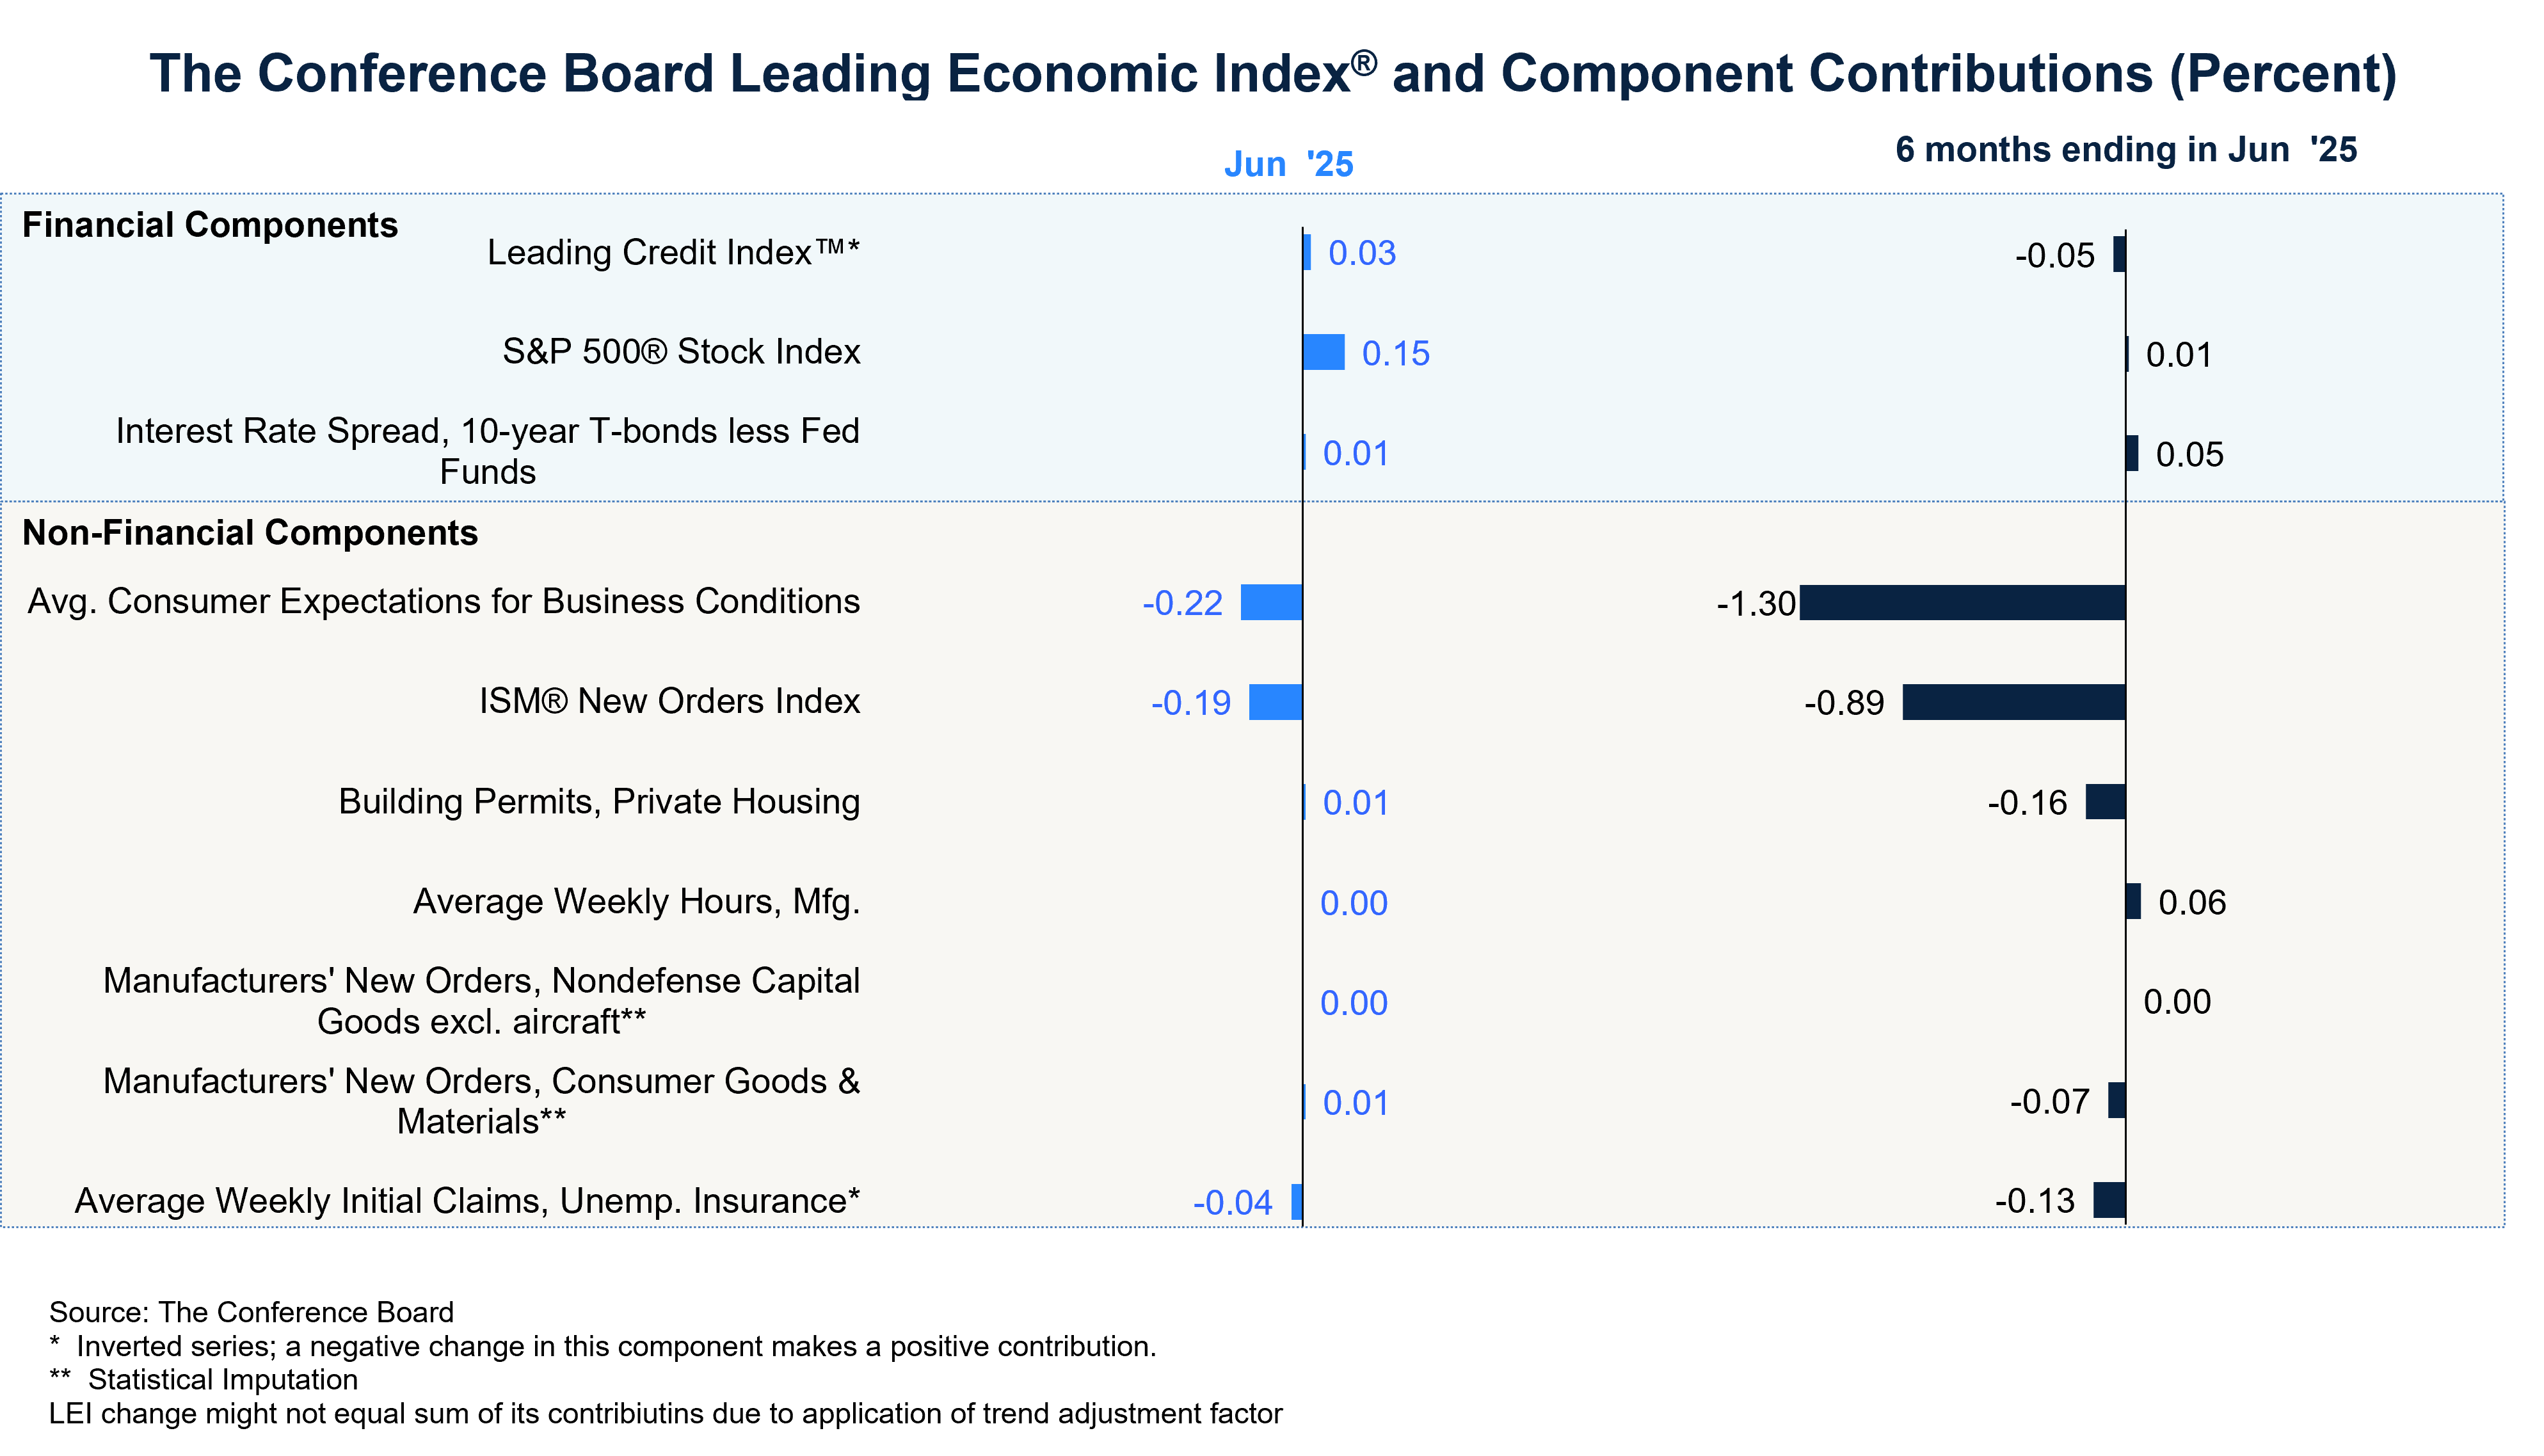
“The US LEI fell further in June,” said Justyna Zabinska-La Monica, Senior Manager, Business Cycle Indicators, at The Conference Board. “For a second month in a row, the stock price rally was the main support of the LEI. But this was not enough to offset still very low consumer expectations, weak new orders in manufacturing, and a third consecutive month of rising initial claims for unemployment insurance. In addition, the LEI’s six-month growth rate weakened, while the diffusion index over the past six months remained below 50, triggering the recession signal for a third consecutive month. At this point, The Conference Board does not forecast a recession, although economic growth is expected to slow substantially in 2025 compared to 2024. Real GDP is projected to grow by 1.6% this year, with the impact of tariffs becoming more apparent in H2 as consumer spending slows due to higher prices.”
The Conference Board Coincident Economic Index® (CEI) for the US rose by 0.3% in June 2025 to 115.1 (2016=100), after being unchanged in both May and April. The CEI rose by 0.8% over the first half of this year, down from 1.0% growth over the previous six months. The CEI’s four component indicators—payroll employment, personal income less transfer payments, manufacturing and trade sales, and industrial production—are included among the data used to determine recessions in the US. All components of the coincident index improved in June.
The Conference Board Lagging Economic Index® (LAG) for the US was unchanged at 119.9 (2016=100) in June 2025, after increasing by 0.4% in May. The LAG’s six-month growth rate was also positive at 1.4% between December 2024 and June 2025—reversing a –0.8% decline over the previous six months (June–December 2024).
The LEI declined by a further 0.3% in June
A strong rally in stock prices was not enough to offset negative impacts from weak consumer confidence and new orders
The LEI’s weak growth rate and diffusion index over the past six months triggered the recession signal for the third consecutive month in June
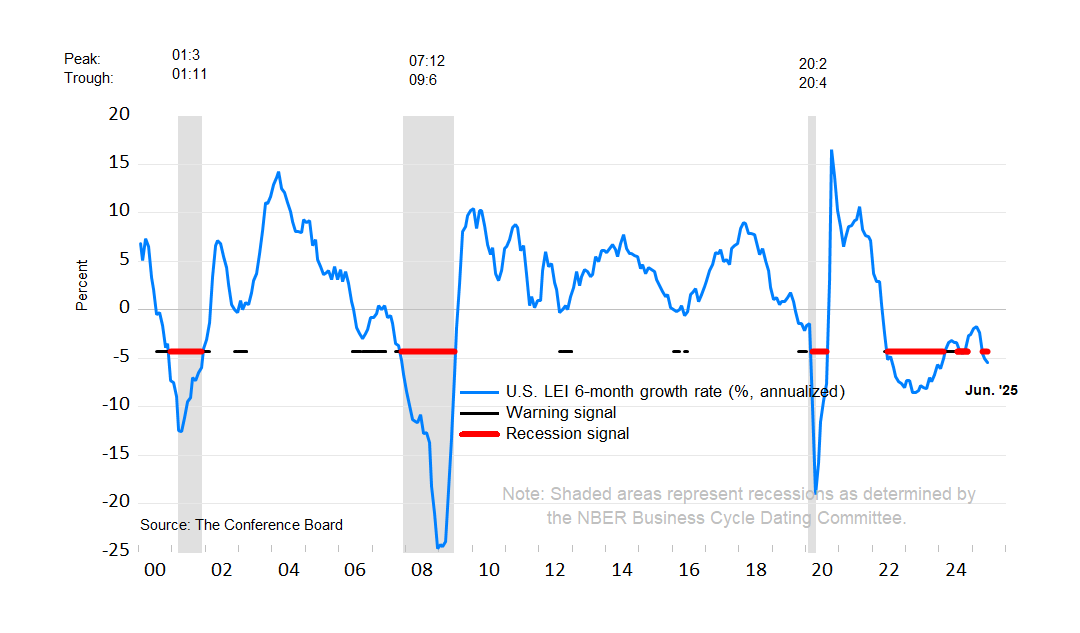
NOTE: The chart illustrates the so-called 3Ds—duration, depth, and diffusion—for interpreting a downward movement in the LEI. Duration refers to how long the decline has lasted. Depth denotes the size of decline. Duration and depth are measured by the rate of change of the index over the most recent six months at an annualized rate. Diffusion is a measure of how widespread the decline is among the LEI’s component indicators—on a scale of 0 to 100, a diffusion index reading below 50 indicates most components are weakening.
The 3Ds rule signals an impending recession when: 1) the six-month diffusion index lies at or below 50, shown by the black warning signal lines in the chart; and 2) the LEI’s six-month growth rate (annualized) falls below the threshold of −4.1%. The red recession signal lines indicate months when both criteria are met simultaneously—and thus that a recession is likely imminent or underway.
Summary Table of Composite Economic Indexes
About The Conference Board Leading Economic Index® (LEI) and Coincident Economic Index® (CEI) for the US
The composite economic indexes are key elements in an analytic system designed to signal peaks and troughs in the business cycle. Comprised of multiple independent indicators, the indexes are constructed to summarize and reveal common turning points in the economy in a clearer and more convincing manner than any individual component.
The CEI reflects current economic conditions and is highly correlated with real GDP. The LEI is a predictive tool that anticipates—or “leads”—turning points in the business cycle by around seven months.
The ten components of the Leading Economic Index® for the US are:
- Average weekly hours in manufacturing
- Average weekly initial claims for unemployment insurance
- Manufacturers’ new orders for consumer goods and materials
- ISM® Index of New Orders
- Manufacturers’ new orders for nondefense capital goods excluding aircraft orders
- Building permits for new private housing units
- S&P 500® Index of Stock Prices
- Leading Credit Index™
- Interest rate spread (10-year Treasury bonds less federal funds rate)
- Average consumer expectations for business conditions
The four components of the Coincident Economic Index® for the US are:
- Payroll employment
- Personal income less transfer payments
- Manufacturing and trade sales
- Industrial production