Uddrag fra Bloomberg:
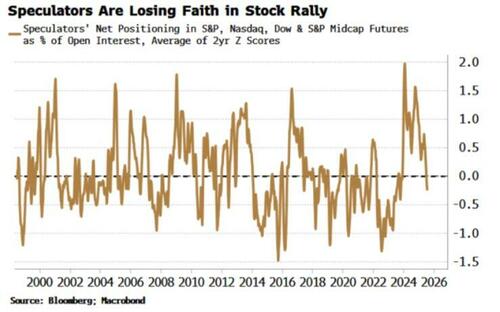
speculators are registering their discontent with the rally. The Commitment of Traders report tracks futures positioning across mini S&P, Nasdaq, Dow Jones and S&P Midcap contracts. There’s a long bias as would be expected, because it’s relatively rare for speculators to be net short stocks. But long positioning has slumped to below its two-year average.
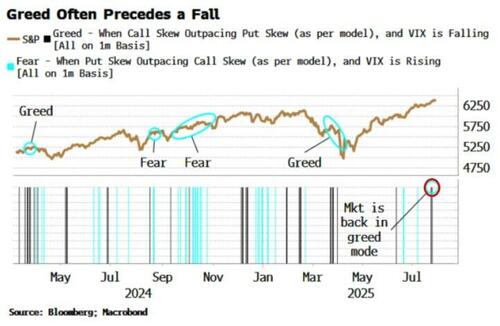
But it is because greed is seeping into the rally that we should pay special attention to fast money’s wariness. Greed and fear can be implied from S&P option markets and when fear is in the ascendant, investors are more likely to be hedging their downside with put options. When greed takes over though, speculation in call options typically rises as investors try to gear their upside.
We can define greed regimes as when out-of-the-money call skew is outperforming out-of-the-money put skew, and the VIX is falling (all on a one-month basis).
Fear was the predominant regime in the rally off the lows, but that has lately switched to greed.
Greed rarely works out, with stocks historically underperforming over the next one to three months once it sets in.
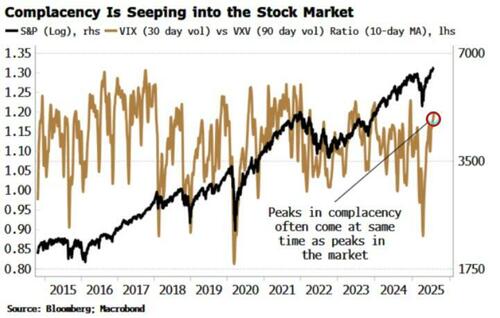
Unlike greed, complacency is not one of the seven deadly sins, but in markets it should be. Collective over-confidence has been the father of many market declines, as there is no surer way of blinding oneself to danger than one’s own tunnel-visioned certainty.
An observable sign of this is the decline in nearer-dated implied volatility relative to its longer-dated version. The market is in effect saying there are risks coming down the pipeline, but they don’t matter today. Capturing this is the VIX/VXV ratio, which is rising quickly. At extremes it is associated with shorter-term reversals in stocks.
Becalmed volatility is not confined to the equity market.
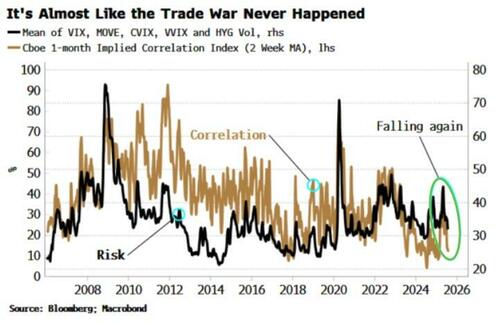
Cross-asset vol across stocks, bonds, credit, FX, and oil is falling and is not suggestive of a market in any way scarred by some of the truly unprecedented turns in events in recent months.
Where volatility goes, equity implied correlation goes too. It is a measure of by how much the individual stocks in the S&P co-move with each other. Low values mean stocks are moving more independently of one another.
It can be driven lower by dispersion selling, when an investor sells volatility on the index versus vol on the underlying stocks. When the index is dominated by a handful of firms, eg the Magnificent Seven, the dispersion selling pins the index vol, meaning the rest of the stocks are impaired in how much they can move.
Overall, their moves cancel out, leading to correlation becoming depressed.
Dispersion popped higher in June, which may have elicited some selling and led to the subsequent fall in implied correlation.
Low correlation acts as a potential accelerant when stock prices fall. It keeps the VIX lower than it otherwise would be based on the vol of individual stocks. As the market falls, stocks increasingly start to co-move (in extremis, correlations go to one as investors sell everything). Correlation picks up, the VIX rises, ultimately leading to further declines in stocks. Rinse and repeat.
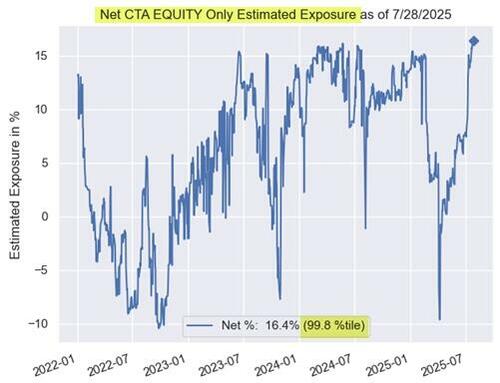
It looks likely CTAs, at least, have just thrown in the towel on their dalliance with being short. Nomura data shows that they are as long as they have been in at least three years.
Source: Nomura
The hedge fund versus S&P sensitivity indicator in the second chart of this piece is necessarily lagging. It’s possible macro and quant funds have also been frantically reinstating their long positions in the last week or two.


