Fra Zerohedge:
Three months ago, the Treasury surprised markets when in its quarterly borrowing forecast, it revealed that in the first calendar quarter of 2021, it wouldn’t need to borrow as much debt as it had recently because the Treasury’s cash balance (held in the Treasury General Account, or TGA, which is simply the Treasury’s cash balance held at the Fed) would plunge to just $800 billion, down a record $929BN from $1.729 trillion at Dec 31, 2020.

This forecast for a flood of liquidity emanating from the Treasury prompted us (and subsequently others) to predict that as a result of the “mind-boggling liquidity” of just under $1 trillion in cash set to be unleashed by the Biden admin, stocks would soar as the Treasury’s monetary injection would be far bigger than the $120BN in liquidity injected by the Fed every month.
And while stocks indeed surged to new all time highs, the Treasury’s cash flood plan stumbled as the latest, just released Treasury Marketable Borrowing Estimates have revealed.
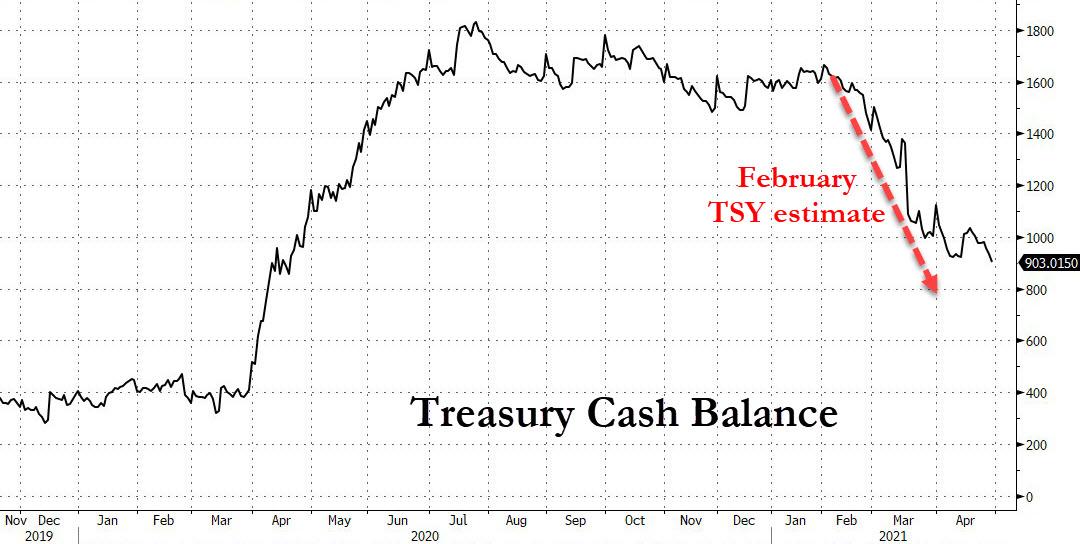
According to the Treasury, during the January – March 2021 quarter, Treasury borrowed $401 billion in privately-held net marketable debt – $126 billion more than the $274 billion originally forecast – and ended the quarter with a cash balance of $1.122 trillion, some $322 trillion more than the $800 billion it had forecast back in February (red arrow below), although as shown in the chart below, the actual TGA cash balance is indeed sliding fast, if not quite as fast as expected three months ago.
According to the Treasury, the $126 billion increase in borrowing resulted primarily from the increase in the end-of-March cash balance somewhat offset by lower net expenditures.
So what does the Treasury expect will happen in the current and coming quarter? Here is the summary from the latest Sources and Uses:
- During the April – June 2021 quarter, Treasury expects to borrow $463 billion in privately- held net marketable debt, assuming an end-of-June cash balance of $800 billion. The borrowing estimate is $368 billion higher than announced in February 2021, primarily due to the government’s additional response to the COVID-19 pandemic.
- The Treasury now expects $800BN in cash at June 30, just $100BN less than the latest print of $903BN as of the end of April. This means that the Cash flood which saw the TGA balance decline by $700BN since the start of the year is about to slow to a tricke.
- Treasury is assuming a cash balance of approximately $450 billion at the expiration of the debt limit suspension on July 31 based on expected outflows under its cash management policies and consistent with its authorities and obligations, including the Bipartisan Budget Act of 2019. It notes that “the actual cash balance on July 31 may vary from this assumption based on changes to expected outflows in that period.”
- During the July – September 2021 quarter, Treasury expects to borrow $821 billion in privately-held net marketable debt, assuming an end-of-September cash balance of $750 billion.
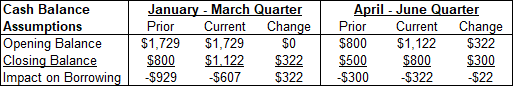
In summary, instead of dropping by $929BN through March 31 as it had expected in February, the Treasury cash balance declined by “only” $607BN, a difference of $322BN. And in the current quarter, the Treasury now expects a similar decline in cash as last quarter, a drop of $322BN (vs $300BN previously), although since it is starting from a higher base, the June 30 cash balance will be $800BN instead of $500BN. This is summarized in the table below:
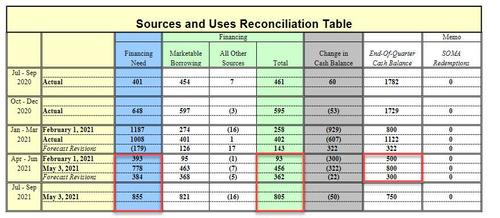
Finally, here is the full Sources and Uses Reconciliation, showing changes to not only cash, but financing needs and actual debt balances.
We will have more to say on this in a subsequent post, but for now the TL/DR is that the liquidity tsunami is over, and the Treasury now expects to release just $100BN in cash for the next two months, from the $903BN currently to $800BN at the end of June, and then just another $50BN lower three months later, or $750BN at the end of Sept.
This slowdown in the Treasury’s cash injection, together with the possible announcement of a QE taper some time around the June FOMC meeting, means that the market melt up is about to end with a bang as investors start freaking out about the risk of a hard liquidity stop – one without the liquidity buffer of Treasury cash injections – some time in mid/late-summer and start frontrunning said event