Fra Zerohedge:
How high will rates rise?
That’s the question on every trader’s lips these days, and although rates got a slight reprieve this morning after oil slumped on a WSJ report that Saudi Arabia is set to boost output by 1MMb/d, the 10 Year yield’s upward climb has yet to stop after topping 1.3% yesterday in a way that suggests that dip-buying by traditional longer-term investors has become less of a force.
So what happens if yields keep rising, and what is the critical value that would set off an equity selloff?
Here are the highlights from his note published overnight:
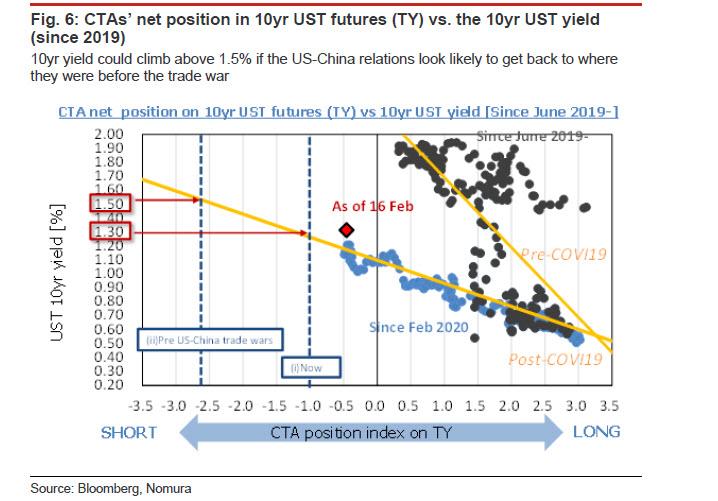
The potential for CTAs to go further short UST futures, what it would take to put the 10yr yield above 1.5%, and when US equities might balk
- Global macro hedge funds and CTAs seem likely to ease up on their selling of USTs at a 10yr yield in the 1.3%-1.4% range.
- However, if it becomes the market consensus that the global economy is on its way to looking like it did prior to the US-China trade war, the 10yr UST yield could potentially keep climbing past 1.5%.
- We would expect only a mild downward adjustment in US equities if the 10yr yield stays between 1.3% and 1.4%, but in a risk scenario in which the yield tops 1.5%, US equities could correct downward more sharply
Some more details, on these points starting with the key question: will the 10yr UST yield settle in the 1.3%-1.4% range, or keep climbing into the 1.5%-1.6% range?
According to Takada, going by the approaches taken by major classes of speculators and an analysis of historical patterns in cross-asset markets, the main scenario he envisions is one in which “selling fatigue” sets in with the 10yr yield in the 1.3%-1.4% range, and risk asset markets see no more than a mild impact. However, he cautions that he can “also envision a risk scenario in which CTAs’ move to the short side in UST futures (TY) becomes essentially unstoppable, pushing the 10yr yield to above 1.5% and forcing US equities (the S&P 500) to adjust downward by 8% or more.”
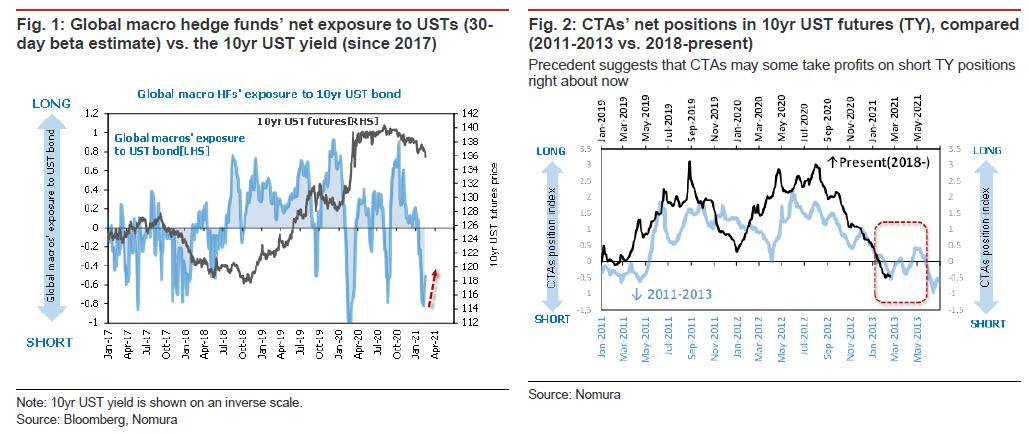
In the main scenario envisioned by the Nomura strategist, it is probable that the current rise in the 10yr UST yield (that is, the selling of USTs) is being led for the moment by latecomers who were slow to get into the reflation trade (including some longer-term investors and risk-parity funds). However, he notes that “more attention should be paid to the fact that the quick-moving speculative investors that sent yields rising in the first place now look inclined to take profits on their short UST positions.”Chief among them are global macro hedge funds. Macro funds that got out ahead of other investors in entering into reflation trades are now moving to cover their UST shorts, and they seem to not be interested in chasing the 10yr yield upward beyond 1.3%, according to Takada.
Trend-following CTAs are in a similar boat. There are precedents that suggest that in terms of the timing, CTAs and the like may wind down their selling of USTs any time now. As shown in Figure 2, CTAs’ current short TY positioning has been following an up-and- down rhythm quite similar to that observed in 2011-2013.
Also, in terms of the absolute level, CTAs’ net short position in TY is now looking less underdone than it had been relative to macroeconomic fundamentals. Considering the present state of global economic momentum (as measured by the manufacturing PMI readings for the US and China), CTAs will probably have built up an adequate net short position once the 10yr UST yield is established in the 1.3%-1.4% range (see Figure 3).

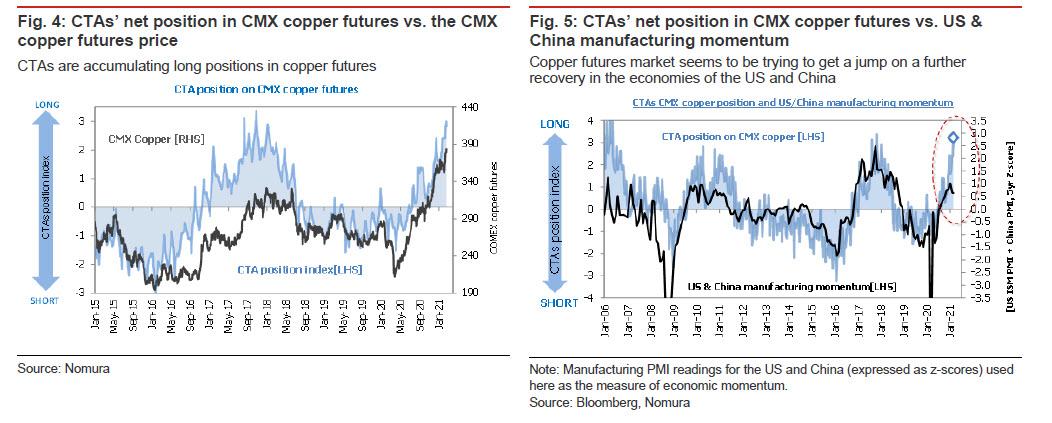
However, Nomura is especially concerned about a potential risk scenario “in which CTAs’ selling of USTs picks up unexpectedly and becomes difficult to stop.” The reason for this is that outside of the UST market, some speculative investors are already making more trades designed to get an early bite out of an anticipated further recovery in the global economy. The CMX copper futures market is a perfect example. For example, CTAs’ net long position in copper futures is large enough that it effectively assumes that the global economy will get back to where it was before the US-China trade war.
Should this kind of trading observed in the commodity sector make its way into the UST market, CTAs may well revise up their assessment of what constitutes an adequate net short position in UST futures, as a way to balance their books. As such, Takada cautions that investors should be aware of the upside risk here, as the 10yr UST yield could be carried above 1.5% if it becomes the market consensus that the global economy is on its way back to its pre-trade war state.
What would that do to stocks? And more specifically, at what point would equity markets balk? According to Takada answers, a rise in yields of more than 20bp from the current level could exert a significant drag on the stock market.
As he further details, US equities would probably not see more than a mild downward adjustment if the 10yr UST yield stops rising while still in the 1.3%-1.4% range. The current rise in yields appears to be largely a byproduct of the portfolio rotation being executed by major classes of investors, including speculators (out of bonds and into stocks). As such, “this is not yet the time to be worried about the cause-effect relationship between rising bond yields and falling stock prices asserting itself.”

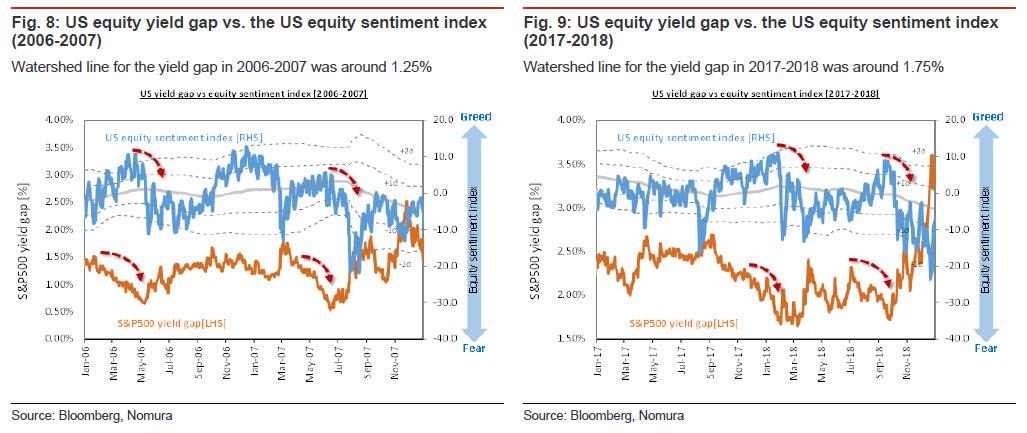
That said, the above-mentioned risk scenario (in which the 10yr UST yield climbs to above 1.5%) implies a rise in yields of 20bp or more over the current level, which would narrow the US equity yield gap and could thereby make US equities look comparatively overvalued. Nomura estimates that the watershed line for the yield gap has been in the 1.50%-1.75% range in the time since 2009. (The yield gap is currently 1.78%, calculated from an equity yield of 3.10% [based on trailing P/E] and a 10yr UST yield of 1.31%.) Historically, instances of the yield gap undercutting the watershed line that applied at the time have tended to be followed within three months by a pullback in sentiment off a peak and a sustained downward correction in the equity market.