Uddrag fra Zerohedge:
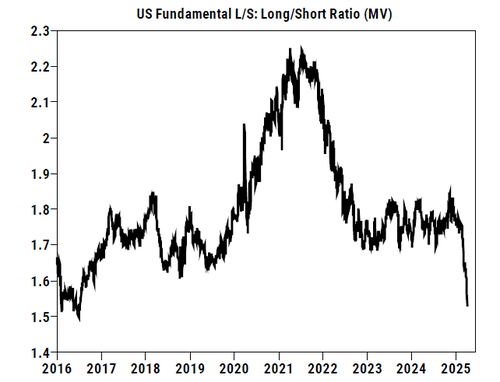
Much digital ink has been spilled on these pages to discusses the current technical and positioning exposure of institutional and systematic investors who have derisked dramatically – either voluntarily or been forced to – amid the market’s rollercoaster swings in recent weeks, to levels not seen in almost a decade.
The same can not be said of individual retail “mom and pop” investors who have demonstrated an uncanny willingness to not only hold on for dear life during the recent market turmoil, but have bought literally every single dip in 2025; and there have been plenty.
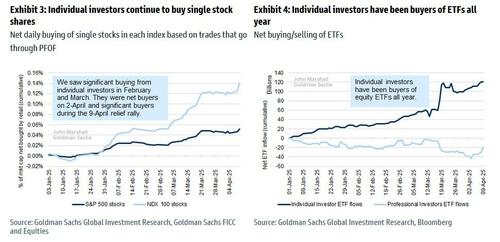
Below we share several charts from Goldman’s derivatives specialist John Marshall, who shows not only how impressive retail resilience has been in the past month, but how individual investors continue to buy single stocks virtually every single day.
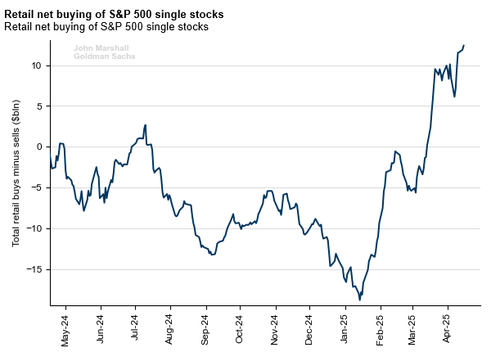
We start at the top: retail net buying of single stocks has exploded since the February highs as retail keeps trying to time the “dip” and thus keeps buying every dip.
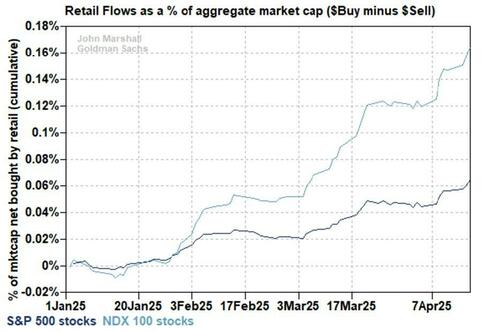
The retail buying of Nasdaq names has been even more ravenous than SPX.
Retail buying in NDX and SPX names last Thursday was most notable.
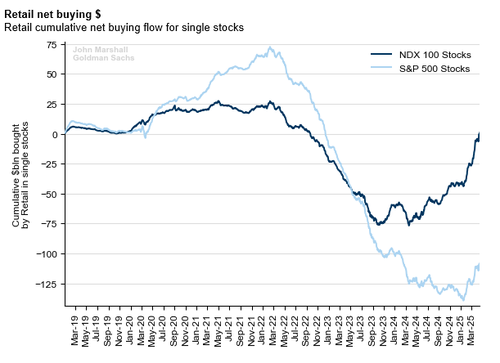
But perhaps the most remarkable chart is the following: it shows the massive divergence between institutional and retail flows, with the former dumping in the past month, while retail investors just couldn’t buy enough.
Why have retail investors shown such remarkable resilience at a time when their professional peers are (almost literally) peeing their pants? The answer, according to the Goldman trader, is one which will make Trump’s economic advisors rather happy: retail investors remain optimistic because the one thing that matters the most to them, broader economic prospects, remain positive. Here is Marshall:
Individual investors have remained net buyers of stocks and ETFs all year, including during the past week. We view individual investor equity buying decisions as more influenced by their employment status than their equity market view. If trade policy uncertainty eases, we would expect a variety of investors to buy equities. If trade policy uncertainty increases, we expect it would take time for job losses to occur and subsequent individual investor selling to materialize; this, combined with the elevated level of fear priced into derivatives markets (VIX, put-call skew and implied moves) suggests there is a window of several weeks when relief rallies are more likely than downside acceleration. We will be closely watching to see if job losses materialize as a warning sign for individual investor selling.
Individual investors didn’t lose faith in equities during the recent volatility. We aggregate the net buying flow across all stocks in the SPX and NDX using analysis of public trade level data from Goldman Sachs Electronic Trading (GSET). GSET analyzes the size and direction of trades that received price improvement (i.e. retail trades) allowing us to understand aggregate buying/selling trends over time. Retail investors were sellers of stocks during the decline of 2022, but have been buyers during the recent equity volatility. Individual investors bought both stocks and ETFs in the Apr- 9 rally.
Professional investors have significantly de-risked, but individual investor remain steadfastly long equities. For many years, we have held the view that individual investors buy equities when they have jobs and sell equities when they face unemployment. We expect equities to see relief if policy news-flow is generally neutral over the next several weeks. Individual investors have demonstrated a willingness to own stocks through the volatility and professional investors will likely be compelled to re-risk if companies guide consistent with already lowered investor expectations. If economic uncertainty turns into job losses, further equity downside is likely (i.e. individual investors would start selling); however, we would see hypothetical job losses as several weeks away as we expect that companies will take time to assess the direct and indirect impact of proposed policies and would be reluctant to take actions prior to a better understanding of the balance of tariff policy and a potential tax cut bill.
What happens next? Well, in a some ironic twist, now that professional investors are largely on the sidelines, it will all be up to retail investors to determine the market’s next move:
With institutional investors de-risked, we expect individual investors will be the key market participants that decide the direction of the equity market over the coming months.
In any event, there are two sides to that coin: if retail has been aggressively buying all the way down, they are unlikely to keep buying if and when stocks stabilize, and in fact, may well turn sellers.
So who will buy from them? Well, assuming professional investors remain frozen, as has been a regular refrain from various trading desks such as Goldman’s, the most likely “forced-buying” candidate is CTAs and other trend followers.
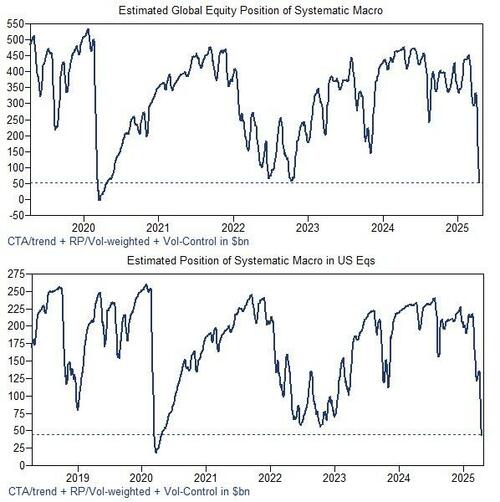
As Goldman writes in a separate report, the systematic macro rebalance has effectively been completed, with global equity length going from approximately an 8 out of 10 during the YTD/February highs to a 1 out of 10 currently, of $53bn and representing a short position from CTA/trend followers and 1-yr low lengths from risk parity style + VA vol-control products.
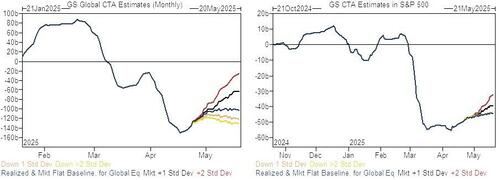
From here, Goldman calculates that the current baseline is relatively neutral and a small buy, with any bigger potential buying being conditional on more upside occurring first and alongside the flows, and/or more time passing.
And while current trend signals are very negatively skewed, they are not negative across the board and in all cases. Roughly half of longer-term trend in global markets is more positive in Goldman’s estimate, roughly one-quarter of medium-term trend and 10% of short-term trend. The bigger markets are generally more negative however, led by the US markets that are negative across the board in all tenors and products across SPX, NDX and Russell.
The first positive trend area is not until around 5480 currently in SPX (longer-term trend), and the short-term trend area more importantly closer to 5600 now, though will continue to change with time – and more likely continue to drift lower in the near term – because of its shorter-term nature.
Key CTA pivot levels for SPX:
- Short term: 5595
- Med term: 5775
- Long term: 5479
Finally, liquidity has improved notably – especially after today’s meltup – from the very bad levels of the previous week, though remains challenging overall and worse than last year and earlier this year before the onset of the market strife.


