Uddrag fra Goldman Sachs/ Zerohedge
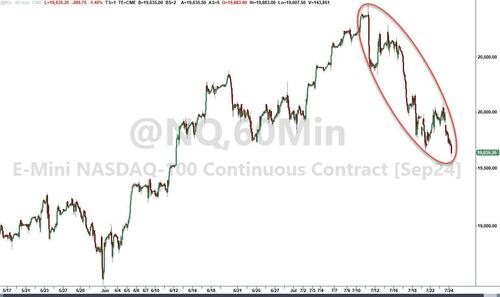
With GOOGL and TSLA tumbling in the pre-market, Goldman Sachs flow of funds guru, Scott Rubner, has issued a cautious note to investors that he “remains on correction watch”, ahead of the Superbowl of earnings.
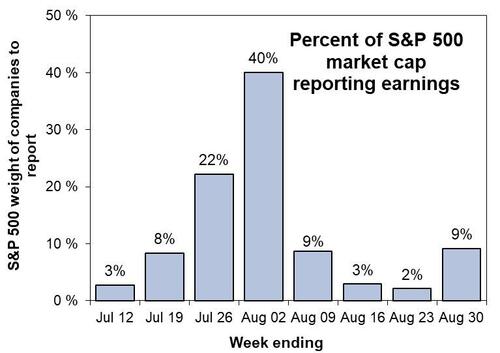
Next week 40% of the S&P 500 market capitalization reports with Planet Earth’s most important companies.
4 of the 7 generals report next week and the bar and stakes could not be higher.
Source: Goldman Sachs
I am not buying this dip and hedging downside is gaining traction…
These are the 11 most important market dynamics right now.
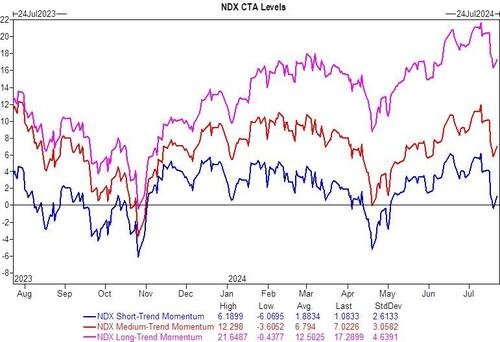
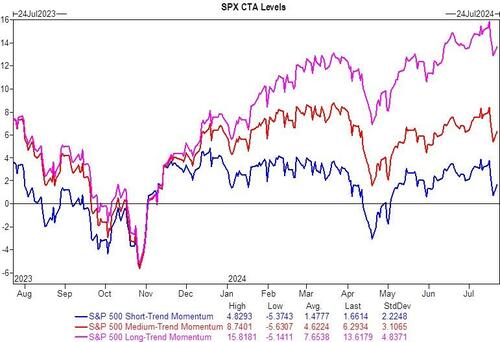
1. NDX short term CTA threshold level is 19,608 in the cash market.
Today will likely mark the first time that the short term threshold is broken since April.
Source: Goldman Sachs
2. SPX short term CTA threshold level is 5,472 in the cash market.
I am watching this level closely to see if it is breached.
Source: Goldman Sachs
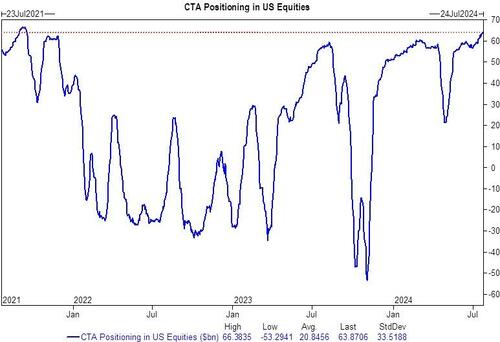
3. Red Sweep. We model US systematic sellers in all scenarios over the next week in a flat, up, or down tape (prior to today’s market move).
US CTA positioning starts the day at the longest level in 3 years.
Source: Goldman Sachs
Over the next 1 week…
a. Flat tape: Sellers -$4.4B (-$170mm out the US)
b. Up tape: Buyers +$4.5B (-$902mm out the US)
c. Down tape: Sellers -$32.9B (-$7.9B out the US)
Over the next 1 month…
d. Flat tape: Buyers $6.5B ($2.1B into the US)
e. Up tape: Buyers $41.8B ($1.5B into the US)
f. Down tape: Sellers $219B ($67.1B out the US)
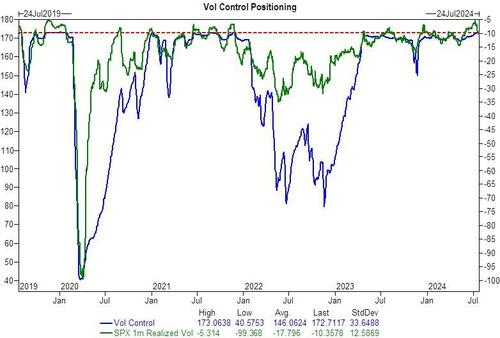
4. Volatility Control strategies and vol selling ETFs are no longer a coach on the field.
They are QB1. We have total Vol Control exposure also at the top of the range.
Source: Goldman Sachs
We are in a new [daily market headlines] volatility regime and gross exposure will need to be reduced given these elevated levels of vol.
Source: Goldman Sachs
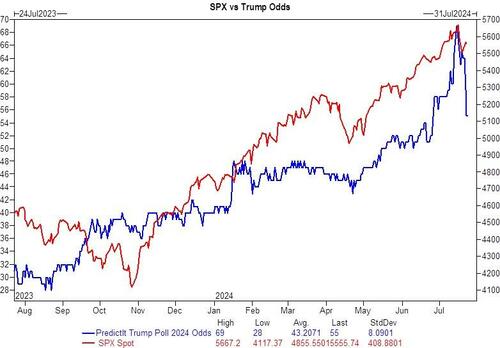
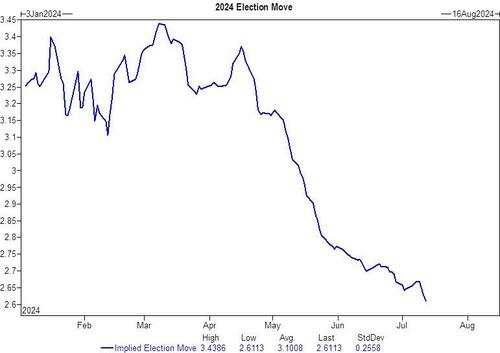
5. Election Correction. The odds markers no longer see this is a landslide.
S&P500 has been super correlated to Trump Win odds lately, I would imagine there is some hedging required from the LP/Mgmt company book given the change in election probability and recalibration among portfolios.
This has stalled traditional election hedging up until Jul 17th.
Source: Goldman Sachs
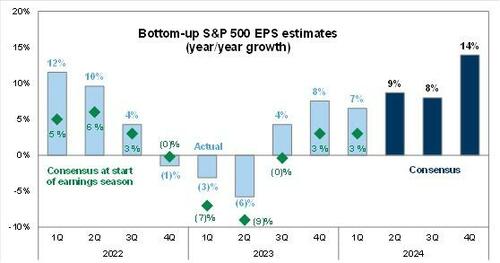
6. The bar for earnings of the most important companies on planet earth is too high.
Earnings and guidance must be good, and by good, I mean great.
- MSFT reports earnings on 7/30
- META reports earnings on 7/31
- APPL reports earnings on 8/1
- AMZN reports earnings on 8/1
Source: Goldman Sachs
7. Liquidity and Gamma (also new)
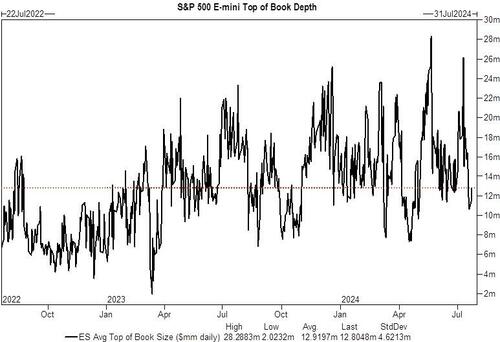
Summer Liquidity and upcoming vacation schedules.
Top book on the S&P 500 futures already dropped by -50%. Would expect even tougher liquidity from here until August.
Source: Goldman Sachs
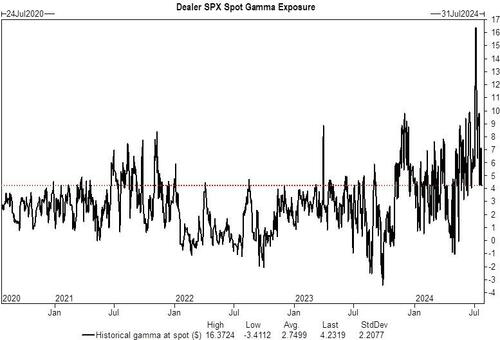
Index gamma is no longer max long, which has been a market buffer.
Source: Goldman Sachs
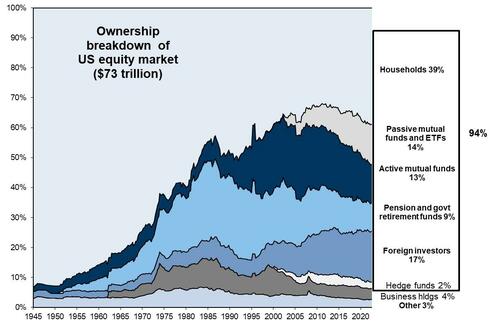
8. Who owns the US stock market?
I ranked this #8, but its really #1. It would not be possible to call “we have seen capitulation” by looking at 2% of the market assets. Any wobble from retirement assets? absolutely not. We saw huge equity inflows last week.
HF De-gross has been seen in 2% of total US Assets.
98% of total US Assets have not seen a de-gross.
Source: Goldman Sachs
9. Index Construction: Flagging.
7 = 500, 7 = global equities (ACWI). We got 2 reads already, and those were the LOWEST POSTIONING SCORES OUT OF THE M7 GOING INTO THE PRINT.
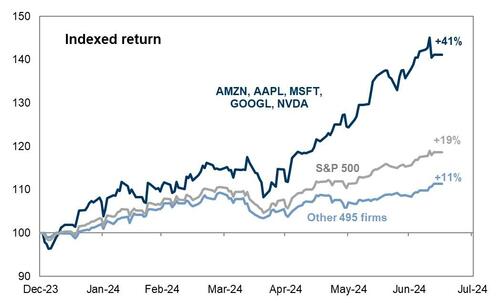
1. 5 stocks are up 41%, the bar for those stocks heading into earnings is remarkably high. And by high, I mean they need to be great. In Megacap Tech, We Trust.
Source: Goldman Sachs
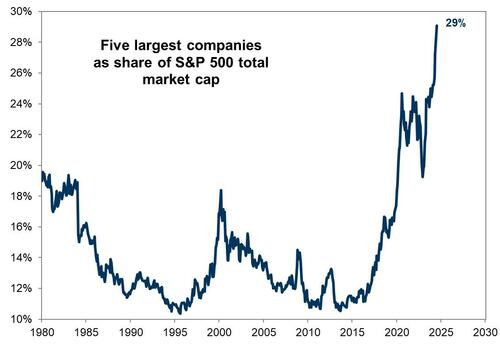
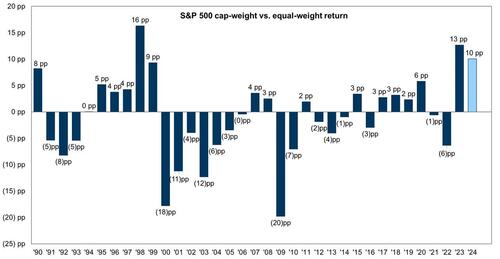
2. If you allocate $1 into the S&P 500 ETF, SPY, 29 cents goes into the top 5 stocks, a new record.
Source: Goldman Sachs
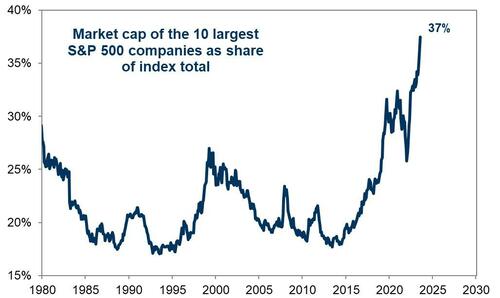
3. If you allocate $1 into the S&P 500 ETF, SPY, 37 cents goes into the top 10 stocks, a new record.
Source: Goldman Sachs
4. If you allocate $1 into the Russell 2000 ETF, IWM, no single name exceeds more than 50bp weight.
Source: Goldman Sachs
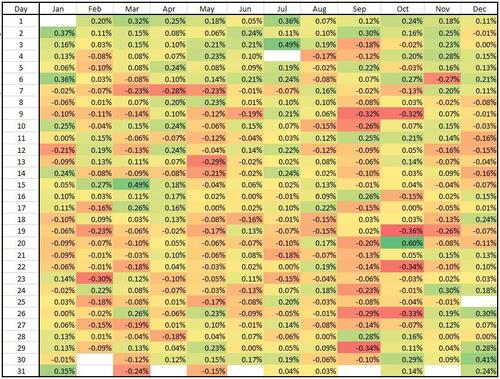
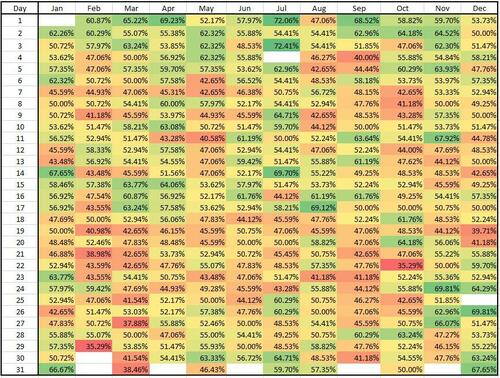
10. Seasonals are not good.
S&P 500 – Day by Day seasonal performance since 1928. July 17th marks this change. Punchline, no more neon green days in the upcoming summer future.
Source: Goldman Sachs
S&P 500 – Day by Day hit rate since 1928.
Source: Goldman Sachs
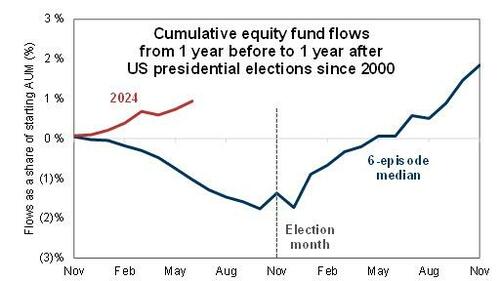
11. the odds were perfectly priced, now they are not. Pre-election jitters is common.
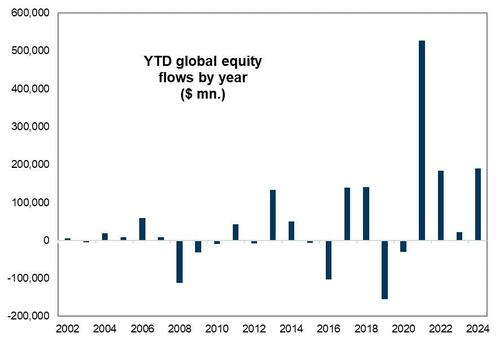
a. US and Global equities typically see outflows heading into the election before returning to inflows again in November. 2024 1H saw the second largest equity inflows on record.
Source: Goldman Sachs
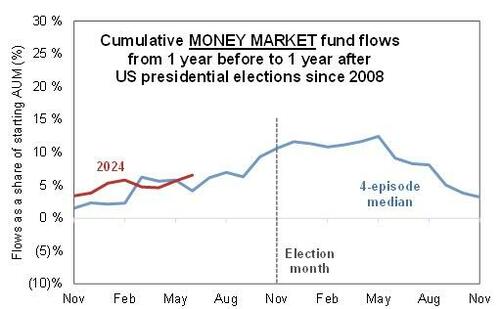
b. Money markets typically see inflows heading into the election, and outflows post November.
Source: Goldman Sachs
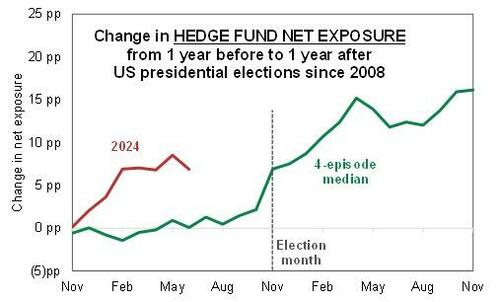
c. HF net exposure is typically low running into the election before quickly re-leveraging, current HF net exposure is above average heading into the election.
Source: Goldman Sachs
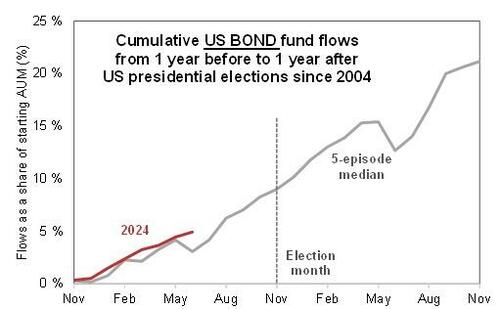
d. US bond funds are running in line with historical pace, with large potential post-election fixed income flows.
Source: Goldman Sachs
1H of 2024 – Equity ETF and Mutual funds saw the second largest inflows on record at $231 Billion in 1H.
Passive funds saw +$436 Billion inflows, while active funds saw -$205 Billion worth of outflows. This means passive inflows into the largest capitalization companies and long momentum. This changes completely in August.
Source: Goldman Sachs
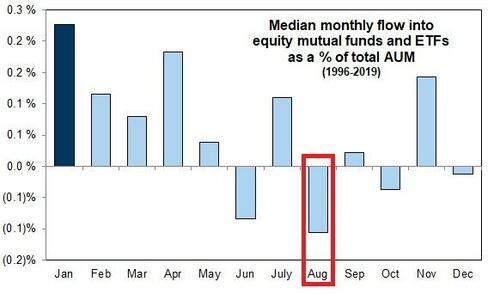
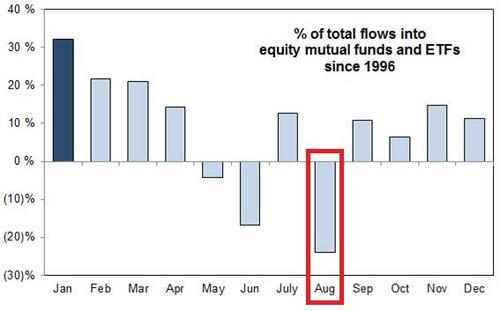
August is the worst month of the year for equity flows.
There are no predicted inflows in August as the capital has already been deployed for q3.
Source: Goldman Sachs
Buyers are out of ammo and I am on the look out for outflows.
Source: Goldman Sachs
GS Flow-of-funds August Checklist
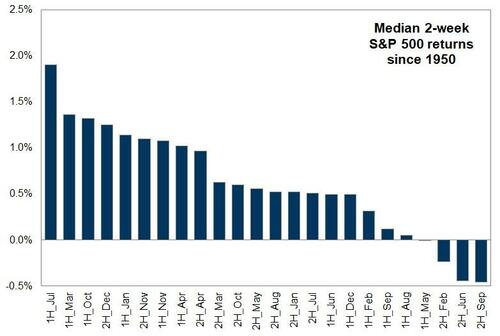
August 1H for S&P – Since 1950, the first half of August is the 5th worst two-week period of the year.
Source: Goldman Sachs
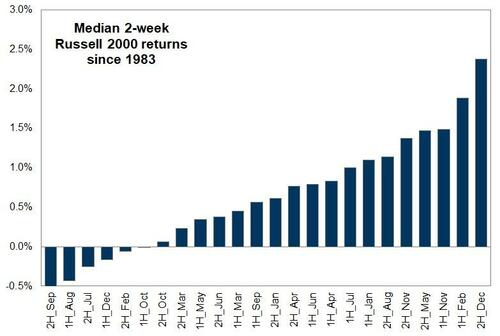
August 1H for Russell 2000 – Since 1983, the first half of August is the second worst two-week period of the year.
(this chart becomes important post new recent length).
Source: Goldman Sachs
d. August is the month with the largest outflows of the year from equity passive and mutual funds. The most important dynamic here is that passive inflows will stop as buyers run out of ammo.
Passive inflows into target date and retirement funds have been one of the key pillars of this flow-of-funds move into equities. This pauses a bit in August.
August is typically the largest month of the year for outflows as allocations are full. We have seen a massive amount of passive index buying of equities given the R.I.N.O. (recession in name only) tape from target date funds, 401k plans, and 529. This happens every Q3.
My tactical correction framework
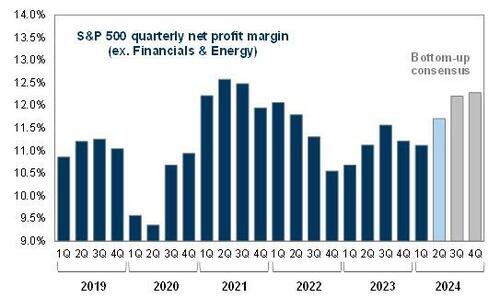
I. The Q2 earnings bar has been raised.
Source: Goldman Sachs
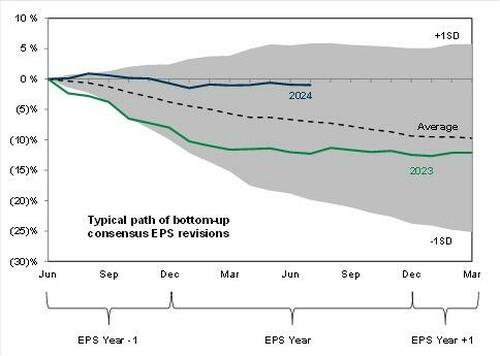
The bar for 2Q earnings is no longer a tailwind.
Source: Goldman Sachs
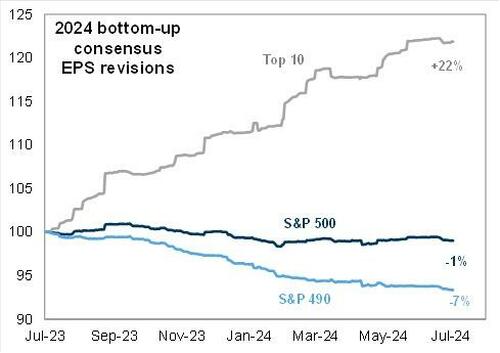
The bar has been raised for the best and highest quality companies.
Source: Goldman Sachs
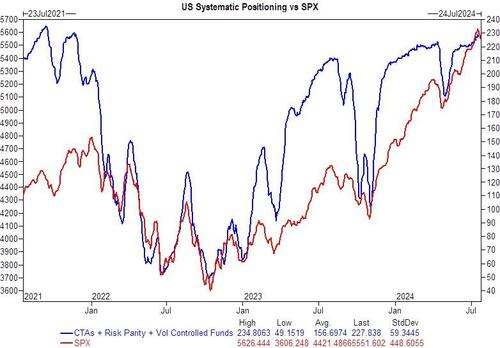
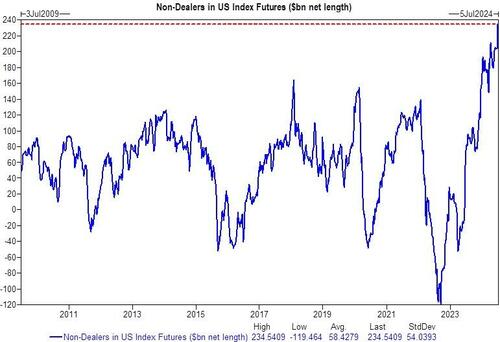
II. Positioning is elevated.
Fuller House – The bar has been raised for the top 10 index weights, which has driven the majority of YTD S&P 500 performance.
Systematic positioning is elevated. A spike in volatility and misses from highly owned market capitalization weights may force non-fundamental sellers to reduce risk.
Source: Goldman Sachs
III. Election Correction – I have back tested typical pre-election behavior.
There has been absolutely no demand for election projection at this stage. My flow of funds analysis show a significant reduction in exposure into the event.
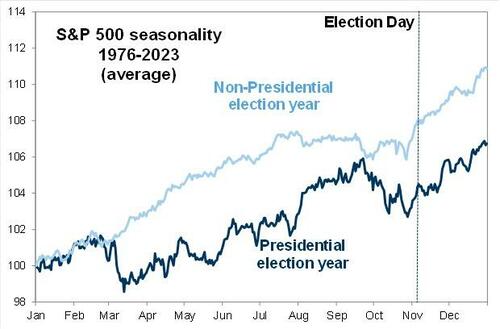
August election year seasonals are not good.
Source: Goldman Sachs
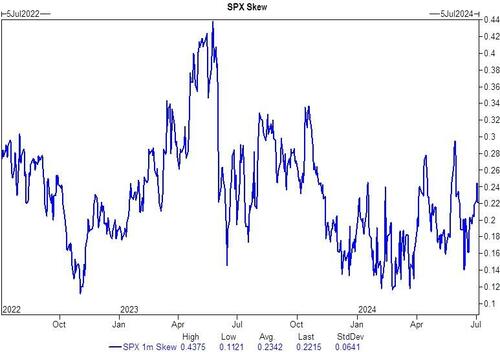
Already priced for perfection in the vol markets?
Source: Goldman Sachs
Source: Goldman Sachs
Intro-pris i 3 måneder
Få unik indsigt i de vigtigste erhvervsbegivenheder og dybdegående analyser, så du som investor, rådgiver og topleder kan handle proaktivt og kapitalisere på ændringer.
- Fuld adgang til ugebrev.dk
- Nyhedsmails med daglige opdateringer
- Ingen binding
199 kr./måned
Normalpris 349 kr./måned
199 kr./md. de første tre måneder,
herefter 349 kr./md.
Allerede abonnent? Log ind her

