Uddrag fra Harvard Governance Blog:
The pressures on corporate leadership and boards to demonstrate commitment to broader social responsibility within ESG have only heightened throughout 2020 and 2021, driven in part by increased focus on the impact of the Covid-19 pandemic on stakeholders as well as the spotlight on racial inequality. These pressures are fueling the adoption of newer social sustainability metrics such as Diversity & Inclusion (“D&I”) in incentive plans across all industries. Headlines continue to highlight blue chip companies that are adding environmental and social (“E&S”) sustainability metrics to go-forward compensation plans, and we expect to see prevalence increase even further by next year.
We urge caution in adopting measures for incentives simply in response to these external pressures and growing market trends. However, where there is a strong overlap between existing business priorities and broader social stewardship objectives, metrics in incentives can create a powerful signal of commitment.
Prevalence of ESG Metric Type by Industry Sector — S&P 500
% of all S&P 500 companies using each measurement type (see below for definitions)
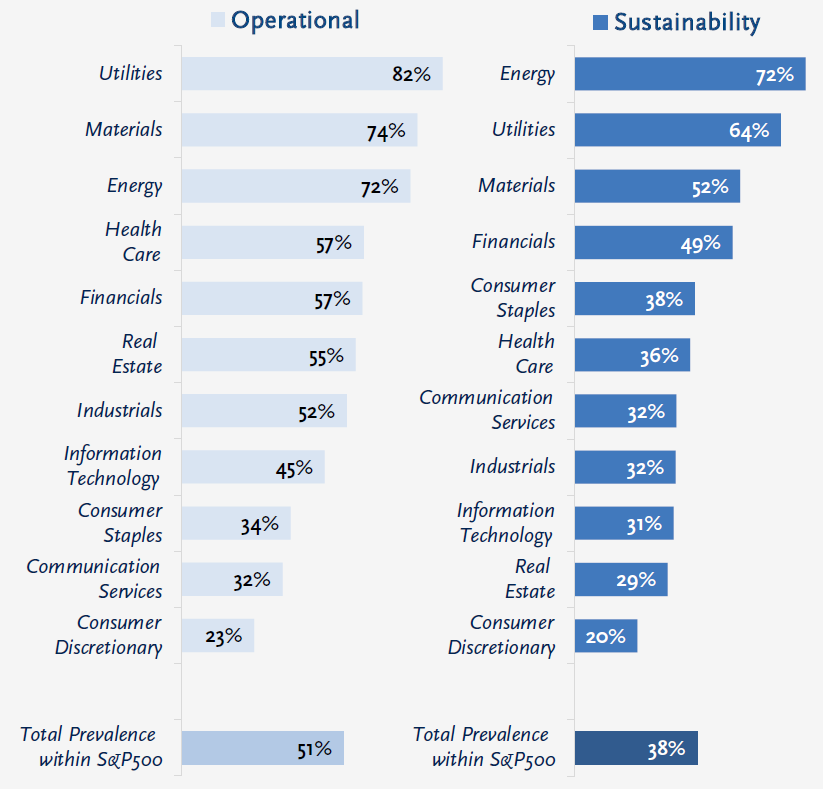
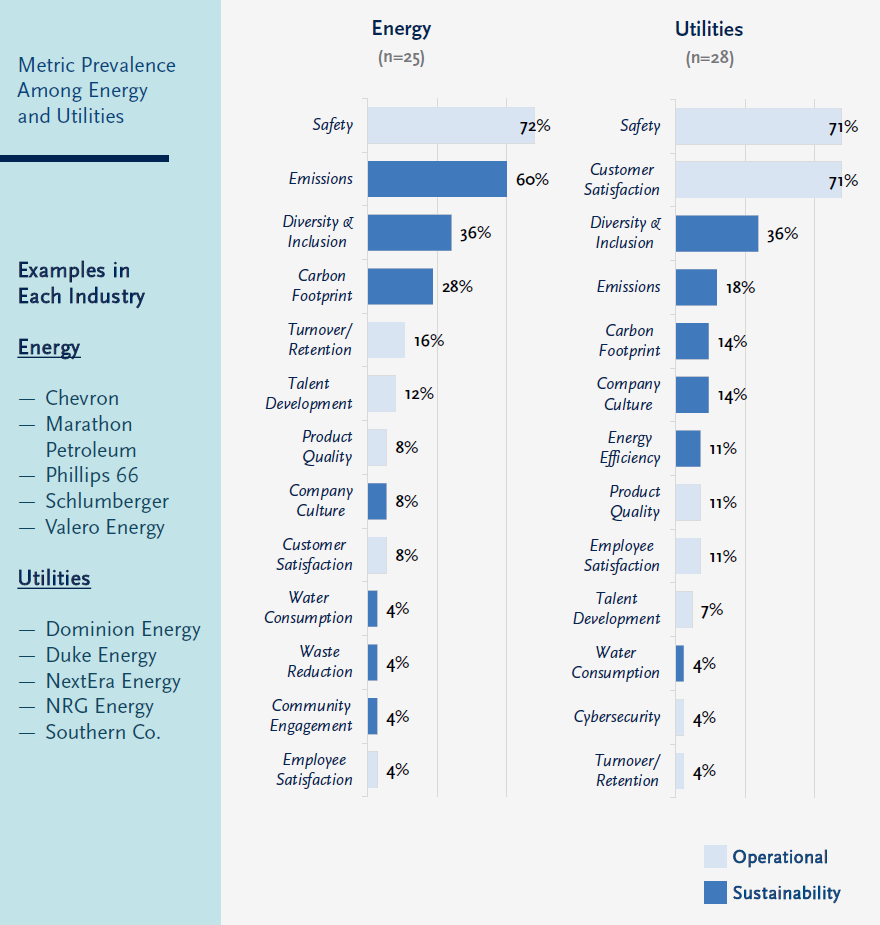
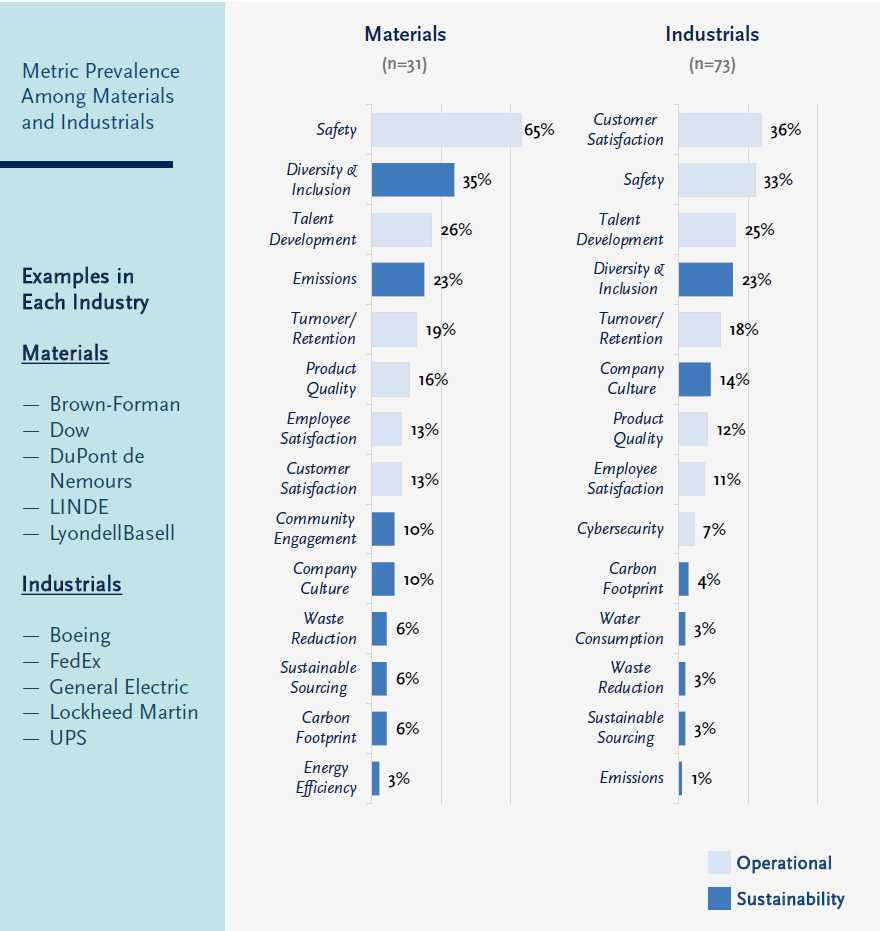
The three industries with the highest prevalence of ESG metrics appear to reflect the confluence of the forces driving the adoption of ESG in incentive plans. “Heavy industries” with a significant environmental footprint (Energy, Utilities, and Materials) are under intense business pressure to manage their emissions and carbon footprint but have also frequently adopted D&I metrics to highlight their broader social responsibilities. Such industrial companies have historically also measured employee safety as a key metric.
Beyond these industries, we begin to see a higher relative prevalence of talent measures, with a continued heavy emphasis on D&I as a social sustainability metric. Customer satisfaction also appears frequently as an operational metric.
As we delve into these trends in more detail, we begin to see relatively intuitive patterns across most industries, with some metric types more common in some industries vs. others. We look into some of these patterns below, with full details on prevalence within each industry provided at the end of this post.
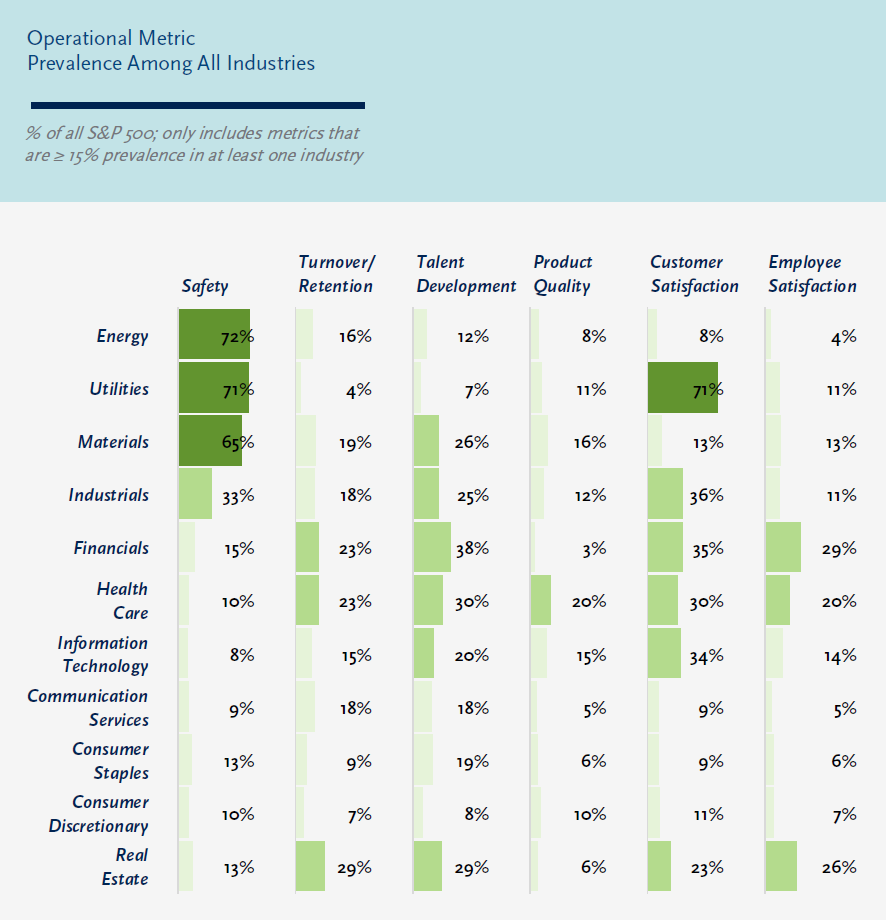
Operational Metrics
Not surprisingly, operational metrics of stakeholder interests tend to have clear ties to business needs across all industries.
SAFETY is the most common metric among Energy, Utilities, and Materials companies, and is also frequently found in Industrials. Beyond these more industrial companies, employee safety is seen only among a small minority of companies.
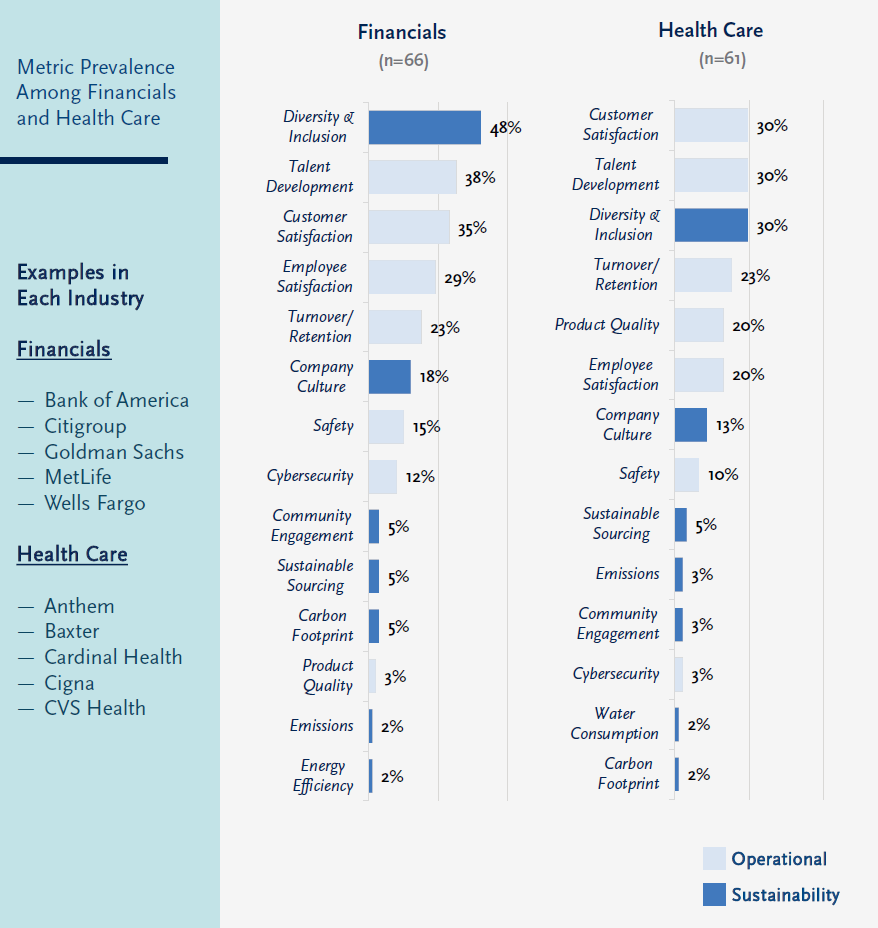
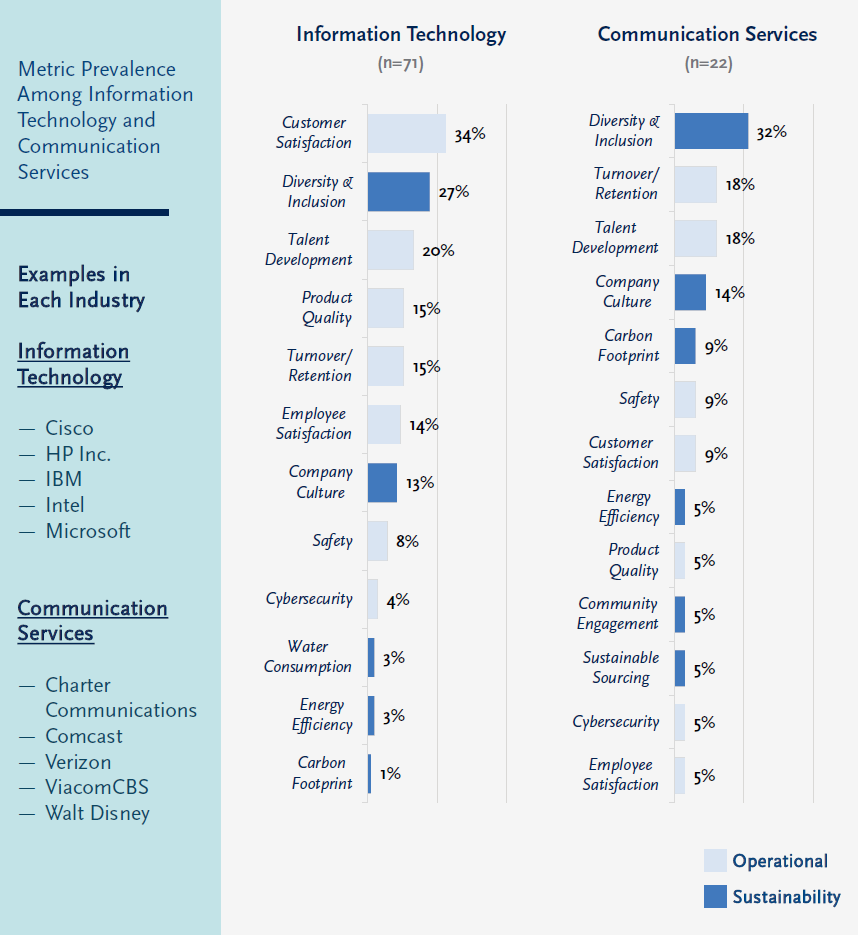
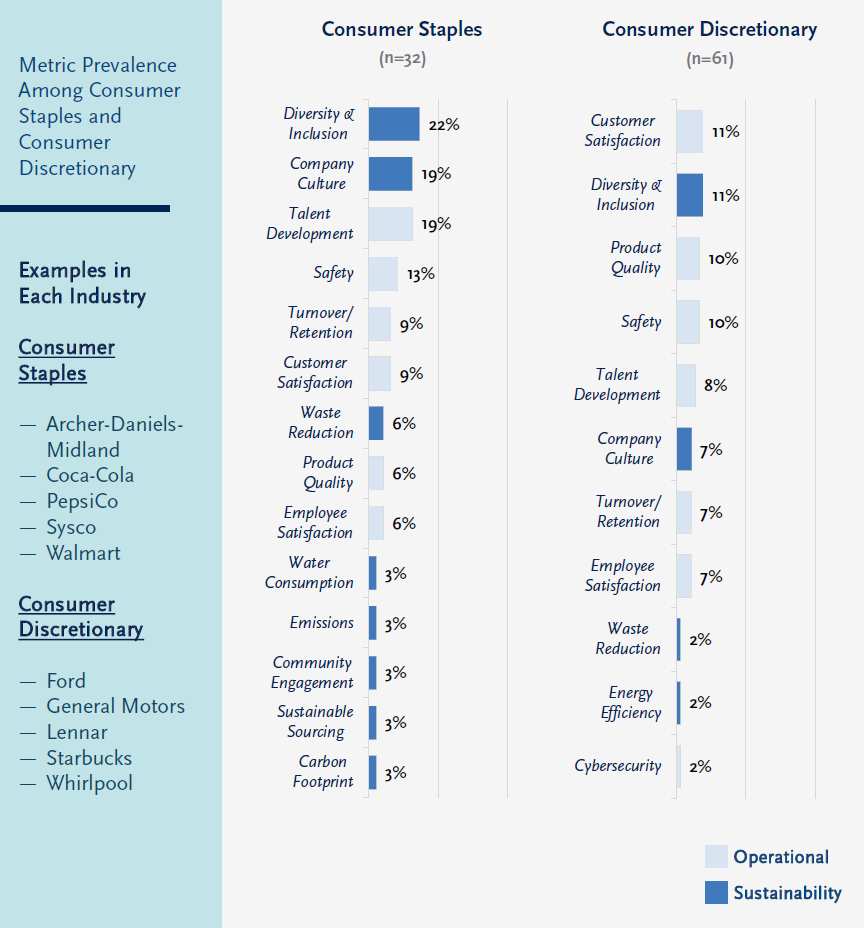
CUSTOMER SATISFACTION is also a very common metric within product or service-oriented industries. It is often found among Health Care, Financials, Information Technology, Industrials, and Utilities companies. Somewhat unexpected is the low prevalence of customer satisfaction metrics in incentive plans among direct consumer businesses in the Consumer Discretionary and Consumer Staples industries, although these industries also have the lowest prevalence of ESG metrics overall.
TALENT METRICS such as employee satisfaction, talent development, and employee turnover are common in heavily talent-driven industries including Financials, Real Estate, and Health Care. Of some surprise is the relatively lower frequency of such measures in incentive plans for Information Technology companies as compared to Industrials and Materials companies.
The findings above largely make sense –operational metrics have long been incorporated as key determinants of business health. Aside from perhaps safety, these metrics have not been subject to intense external pressure, leading companies to organically adopt them in the course of developing and carrying out their strategy and day-to-day operations.
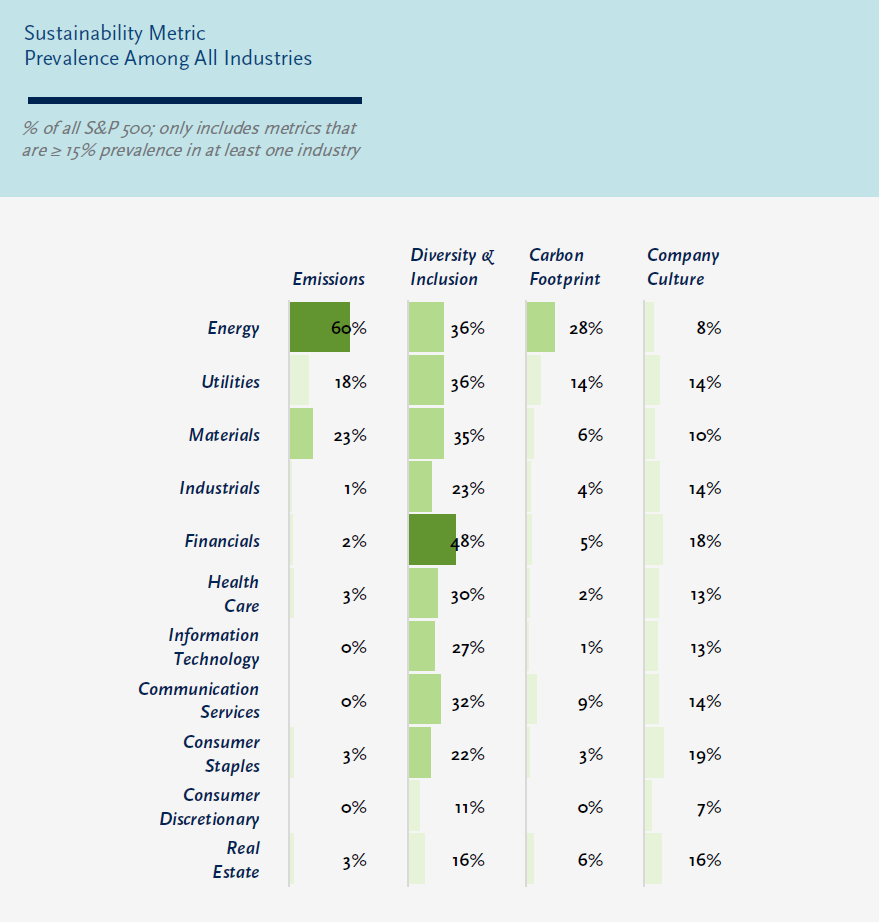
Sustainability Metrics
Turning to metrics of broader social and environmental sustainability, we see generally similar relationships between specific measurement types and business needs, although the influence of external pressures may also be present. This does not have to be a negative factor –to the extent that external pressures align with ‘good business practices’, incentive plan metrics can help support both objectives. Nowhere is this more apparent than in the adoption of measures related to D&I.
DIVERSITY & INCLUSION metrics are by far and away one of the most prevalent of the sustainability metrics, and one of the most common of the ESG metrics in incentive plans overall. D&I is within the top three most prevalent ESG measures for nine of the 11 industries and is incorporated by 25% or more of the companies within seven of the 11 industries.
The Sustainability Accounting Standards Board (“SASB”) framework, which aims at helping companies measure, incorporate, and disclose ESG, lays out which ESG issues are financially material across industries (see the SASB Materiality Map). The framework has identified D&I as a material measure for only a select few, more talent-intensive sub-industries, which makes the broad use of D&I across various sub-industries in our research particularly interesting.
Specifically, we find that D&I is a prevalent metric in Financials, Health Care, Information Technology, and Communication Services, which are all industries that would be predicted by SASB. However, we also find high prevalence of D&I in incentives in Energy, Utilities, and Materials businesses, which is not as intuitive and perhaps a reflection of the higher level of social scrutiny of these companies given their overall environmental footprint. Perhaps most surprising is the relatively low prevalence of D&I incentives in consumer-oriented businesses –Consumer Staples and Consumer Discretionary. Both intuition and the SASB materiality framework would have predicted a higher emphasis on talent and D&I metrics in these industries than we see in practice.
ENVIRONMENTAL metrics are still relatively rare in compensation plans. They are most prominent by far in the Energy, Utilities and Materials sectors where these issues are top-of-mind for stakeholders and have clear, present-day, and direct impact on business operations and strategy. For each of these industries, emissions –measuring releases of chemicals and other pollutants –is the most prevalent metric, followed by carbon footprint. Given the long-term regulation of emissions for these businesses, the inclusion of these objectives in incentive plans is not surprising.
For other industries, the use of environmental metrics remains relatively low across the board, even though environmental issues such as greenhouse gas emissions, waste reduction, and energy management are listed as financially material for most sectors in the SASB framework. We would not be surprised if the combination of stakeholder pressure and financial materiality will cause these metrics to grow in prevalence across industries over time, particularly as the media and public sentiment expand to highlight these issues as especially important.
Conclusion
Many of the industry trends identified in this post are intuitive, with clear ties between the metrics each industry incorporates most frequently in incentives and those that are the most financially or strategically significant. Many ESG measures, particularly the operational ones, align largely with the strategic drivers of success or risk factors within each industry.
However, the trends around certain, high-profile sustainability metrics, and especially the adoption of D&I metrics in incentives, may point to some companies adopting these metrics as a result of external pressure, though, of course, the metrics may still be strategically significant for these early adopters.
We urge a degree of caution in adopting incentive plan metrics purely due to pressure from investors or peer practices. It is important that boards ensure there is management commitment and infrastructure in place to support progress on the chosen metrics and that the metrics are durable and can be reliably measured over time. The most enduring ESG metrics will likely be those that are material from both a business and stakeholder lens.
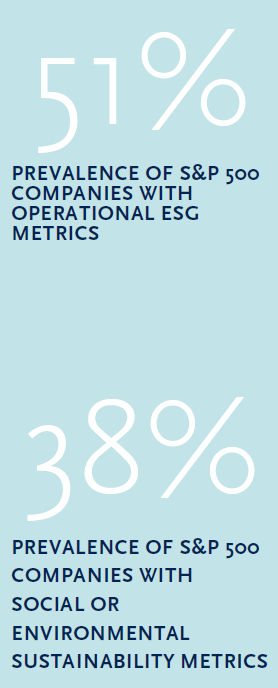
Sustainability vs. Operational Metrics
For the purpose of evaluating evolving trends in ESG, we have divided metrics into two separate
categories. Sustainability metrics focus on the broader social and environmental impact of companies
and are frequently the focus of large institutional shareholders. Operational metrics reflect issues
important to various stakeholders, but are more engrained in the day-to-day success of the business:
| Operational ESG Metrics Other stakeholder metrics that are more aligned with day-to-day business results | Sustainability ESG Metrics Measures concerned with longer-term, broad social/economic stability |
|---|---|
|
|