Fra David Stockmann blog:
This “Jobs Friday” ritual is getting truly absurd. So it can’t be repeated often enough: These artifacts of the BLS’ seasonally maladjusted, trend-cycle modeled, heavily imputed/crafted and five times revised “jobs” numbers have precious little to do with the real health of the main street economy.
Indeed, the six-year run of job gains since early 2010 primarily represent “born-again jobs” and part-time gigs. In economic terms, they do not remotely resemble your grandfather’s industrial era economy when a “job” lasted 40 to 50 hours per week all year round; and most of what the BLS survey counted as “jobs” paid a living wage.
Not now. Not even close.
The Wall Street fools who bought the dip still another time on Friday do not have the slightest clue that the US jobs market is actually quite dead.
The chart below is also generated by the BLS but it measures actual labor hours employed, not job slots. It self-evidently puts the lie to the establishment survey fiction upon which the robo-machines and day traders are so slavishly focussed.
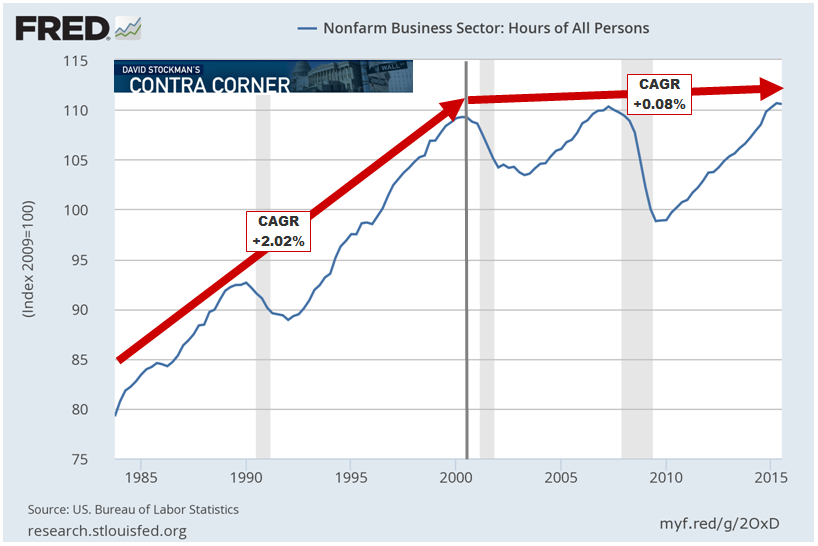
The fact is, labor hour inputs utilized by the US nonfarm business economy have “grown” at the microscopic annualized rate of 0.08% since the turn of the century. That’s as close as you can get to zero even by the standards of sell-side hair splitters, and it compares to a 2.02% CAGR during the 17 years period to Q3 2000.
So let’s see. Prior to the era of full frontal money printing, labor utilization grew 25X faster than it has since the turn of the century. Yet the casino gamblers bought Friday’s more of the same jobs report hand-over-fist—-apparently on the premise that this giant monetary fraud is actually working.
Not a chance. The contrast between the two periods shown in the chart could not be more dramatic. Nor do these contrasting trends encompass a mere short-term aberration. The death of the US jobs market has been underway for a decade and one-half!
Even in the establishment survey itself, the evidence of a failing jobs market is there if you separate the gigs and the low-end service jobs from the categories which represent more traditional full-pay, full-time employment.
The latter includes energy and mining, construction, manufacturing, the white collar professions like architects, accountants and lawyers and the finance, insurance and real estate sectors. It also includes designers and engineers, information technology, transportation and warehousing and about 11 million full-time government employees outside of the education sector.
We have labeled this as the “breadwinner economy” because the work week averages just under 40 hours in these categories and annualized pay rates average just under $50k. These kinds of family supporting jobs were what the Labor Department bureaucrats had in mind back in the 1930s and 1940s when the current employment surveys and reports were originally fashioned.
Notwithstanding all of the present era crafting, however, even the BLS establishment survey figures leave no doubt about the retreat of breadwinner jobs. At the peak in January 2001 there were 72.7 million of these genuine “jobs”, but that figure has never been seen again in this century!
In fact, after 95 Jobs Friday’s the count is still 1.3 million below the interim peak of December 2007 and 3% below the turn of the century level.
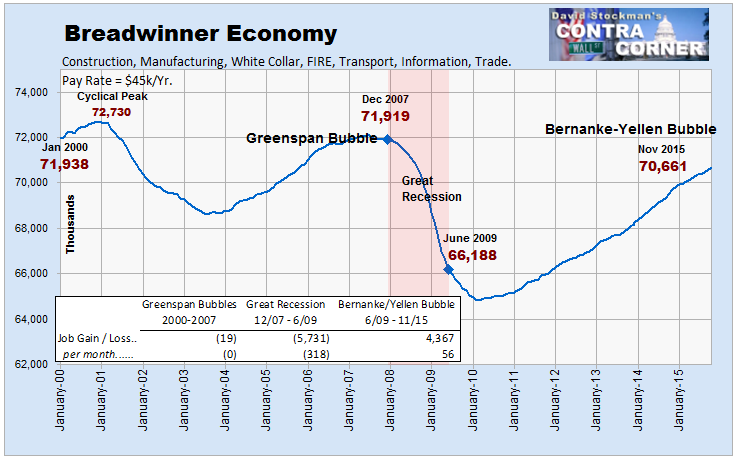
As a statistical matter, these 70.66 million breadwinner jobs account for just under 50% of the establishment survey’s 142.9 million jobs reported for November. By contrast, they account for upwards of 75% of total wages and salaries paid.
Needless to say, the stagnation of the breadwinner jobs market is the reason that wage and salary income growth has been so anemic. For more than 15 years the jobs mix has been steadily deteriorating, dragging the average annual earnings down with it.
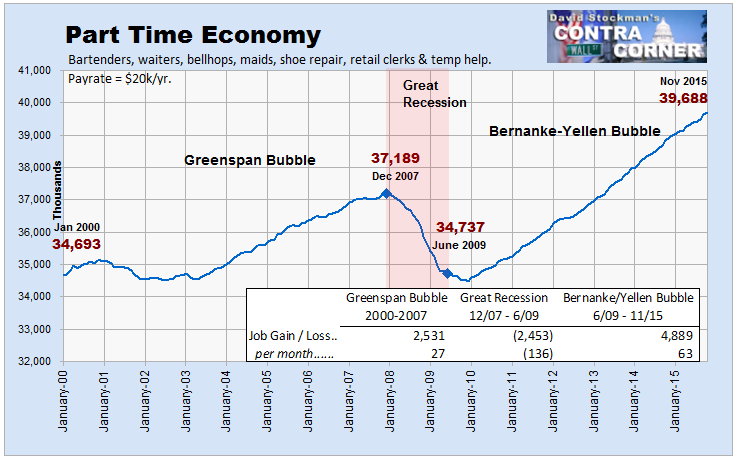
Thus, since the year 2000 the number of jobs in what we have termed the Part-Time Economy has steadily increased. But these jobs in retail, bars, restaurants, hotels, amusement parks, stadiums and temp agencies average less than 30 hours per week and generate annual pay of less than $20,000. From an economic viewpoint, they are gigs, not jobs.
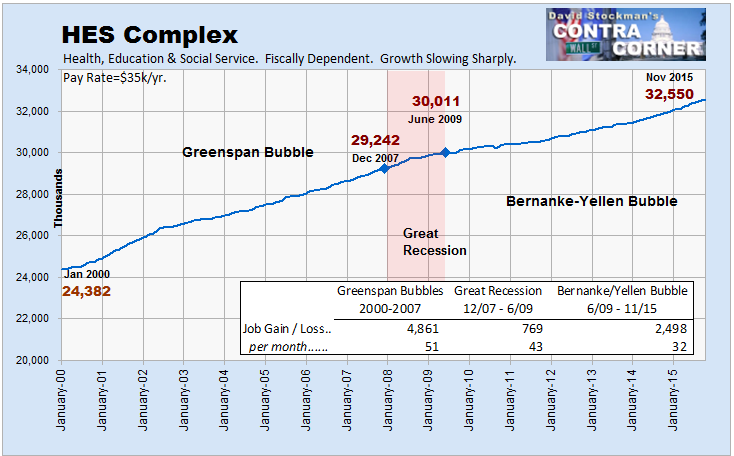
The same can be said for the balance of the establishment survey—-or what we have called the HES Complex (health, education and social services). While these jobs average about $35k of annual compensation, that figure is heavily skewed by a small number of highly paid health and education professionals such as doctors and administrators.
The overwhelming number of jobs in the HES Complex, in fact, pay well less than $30,000 per year.
At the end of the day growth in real wealth and living standards requires expansion of full-time employment and rising productivity per employee. The hard truth is that the debt-saturated US economy is not producing either of these essential ingredients of real main street prosperity.
Another angle on what can be described as the “atomization of work” is evident in the detailed breakout of wage and salary income that is published annually by the social security administration. This data on payroll earnings by annual income bracket is about as close to an honest measure of the US jobs market as you can find.
That’s because they are based not on surveys, estimates, imputations and models like the BLS figures, but reflect actual individual payroll records. It goes without saying that no employer sends withholding taxes to the IRS based on phantom jobs slots.
Here’s the thing. Last year 158.2 million workers had payroll records and withholding taxes and earned $7.1 trillion in compensation. Yet nearly 49 million or 31% if these workers earned less than $15,000 per year.
In fact, this massive cohort of part-timers and gig based workers generated only $300 billion of wages or only 4% of the national total. On average they earned just $6,200 during the entire year.
What Jobs Friday is about, therefore, is the cycling of part-time jobs and gigs on the margins of the economy between the serial financial market booms and busts which result from Fed policy.