Grafer fra Nomura, Morgan Stanley, Data Trek , Goldman Sachs og LSEG
That Upside Force
Nobody owned enough upside, and the market is still paying the price for it. Calls have been chased aggressively, skew has collapsed, and upside realized volatility has gone completely abnormal.
Today finally saw the first real pressure emerge in the hottest convexity trades, with semis and Korea reversing lower after an almost vertical squeeze.
The crash-up dynamic is still very much alive, but the positioning underneath it is becoming increasingly unstable.
Ridiculous
NDX up vs down day realized volatility looks almost ridiculous.
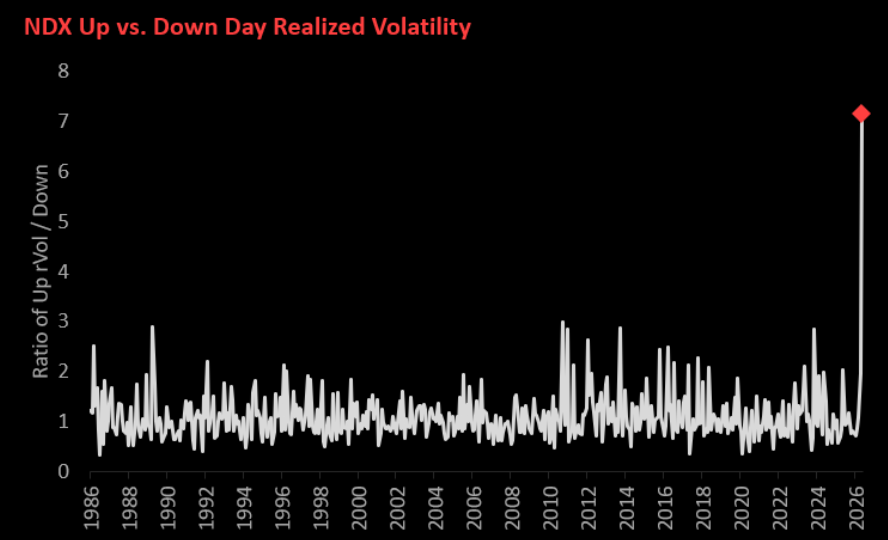
Source: Nomura
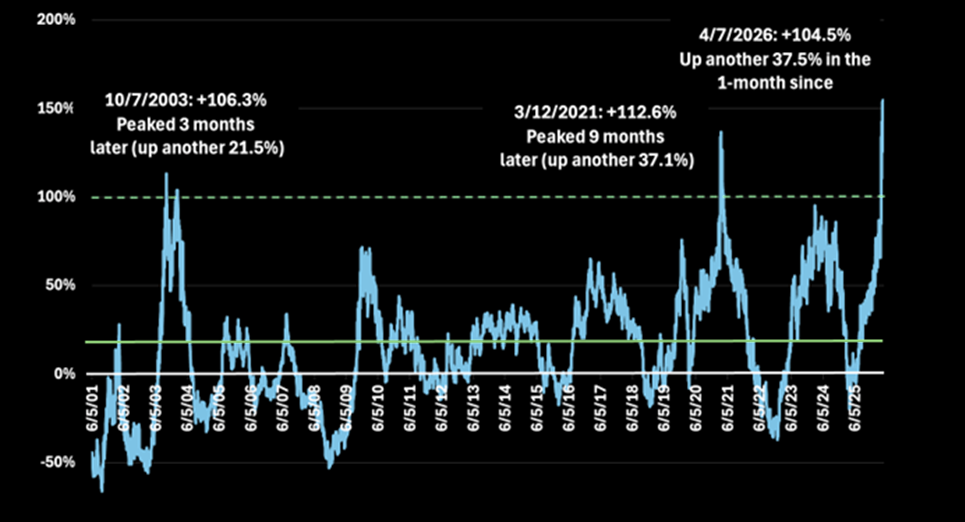
SMH
SMH is up roughly +153% over the past year, the strongest 1-year performance on record going back to 2001 and roughly 4 standard deviations above the long-run average.
As DataTrek notes, staying bullish from here increasingly requires confidence that the semiconductor cycle and AI-driven backlog can remain durable for much longer.
Source: Data Trek
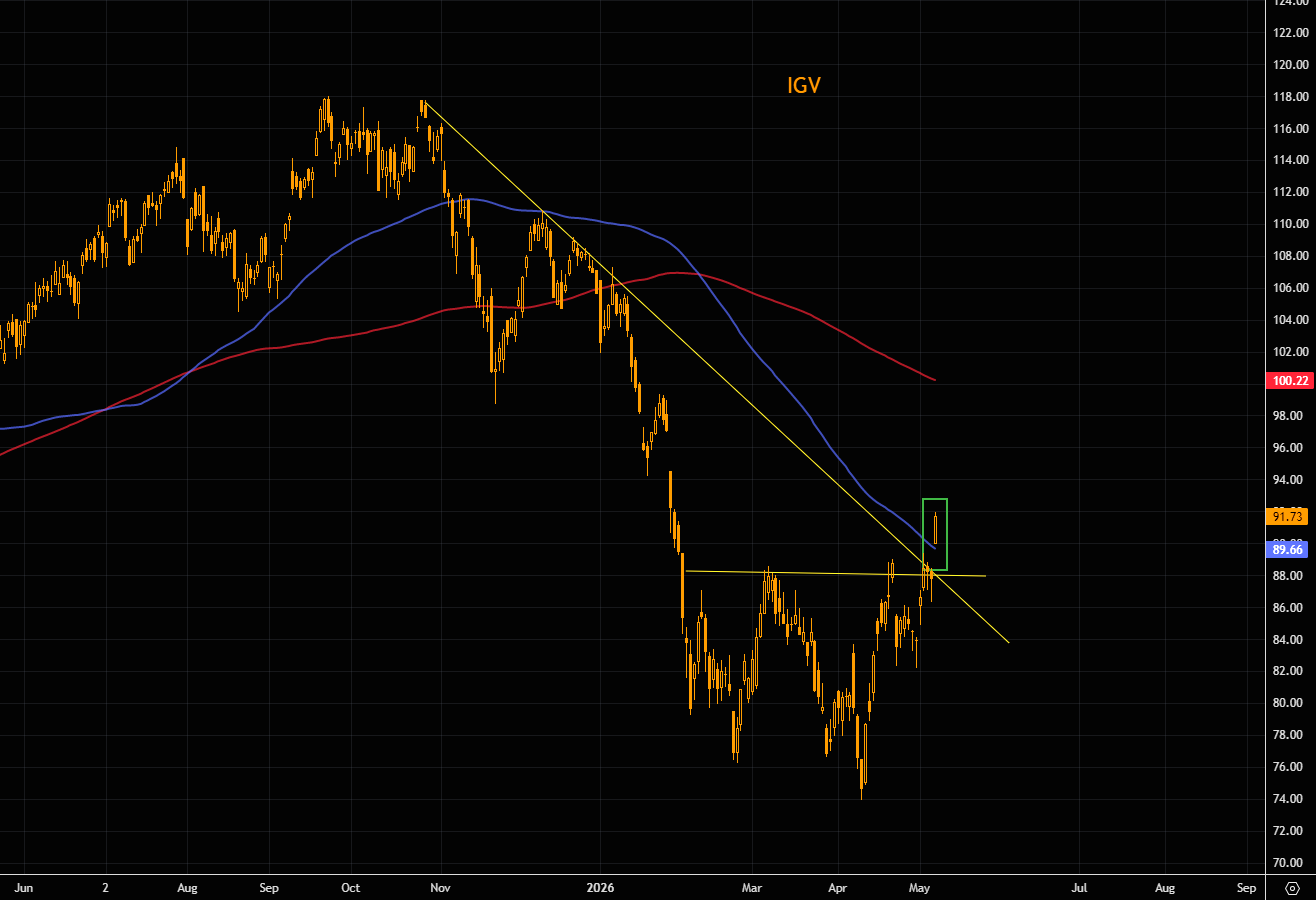
Software squeezing
IGV exploding through the negative trend line and that $88 resistance area. Note we are above the 100-day MA for the first time since the puke began. Not much resistance until the 200-day, currently around $100.
Source: LSEG Workspace
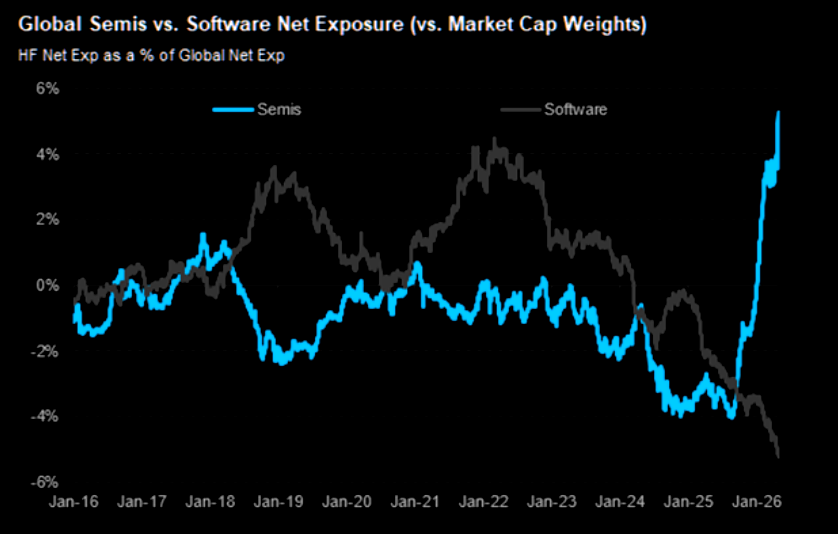
Hated
Software positioning has collapsed. Nothing new, but even a small mean reversion versus semis could drive a meaningful move.
Recall what JPM’s trading desk pointed out on Monday: “Long-only demand remains absent, while hedge funds are still pressing shorts into strength, similar to Friday.”
Source: MS
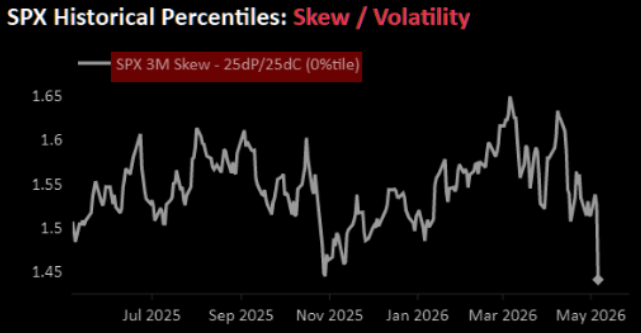
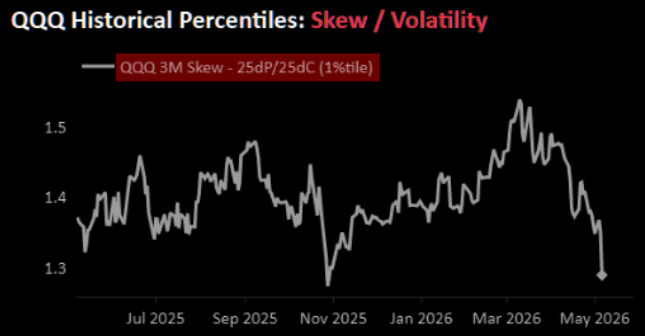
Grabbing calls
Investors haven’t been long enough in the mega cap tech AI theme and have been forced to chase calls, while at the same time nobody wants puts. Skew has absolutely crashed.
Source: Nomura
Source: Nomura
Downside convexity
Index and vol-control rebalance projections continue to clearly show that downside remains the potential nasty risk to keep in mind going forward.
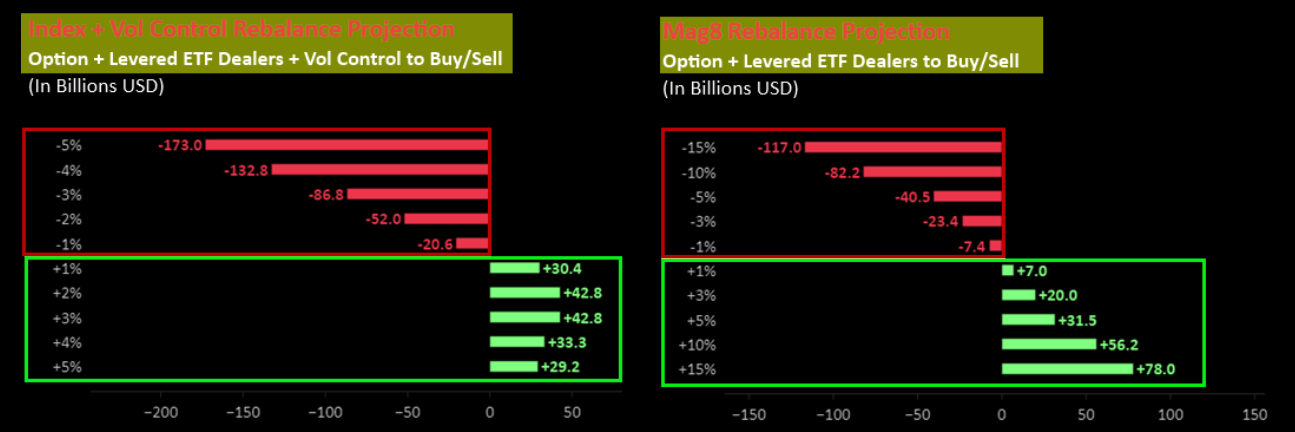
Source: Nomura
The world discovered Korea
Chart shows EWY monthly notional volume as % of all global equity ETF volume. This could get very nasty to the downside. More on KOSPI FOMO here.
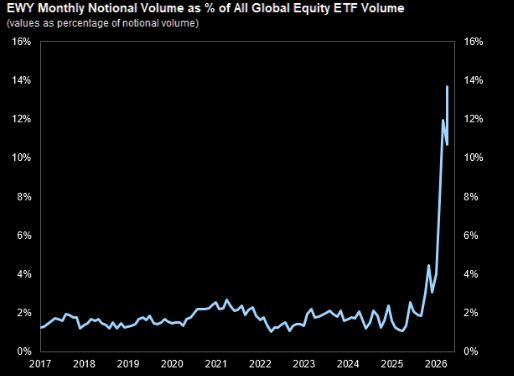
Source: GS
Massive in KWEB
Yesterday, KWEB printed a very powerful upside candle. The ETF remains below the longer-term downtrend line, but managed to close above the 50-day moving average, something that has only happened a handful of times since the China tech bear market began.
More importantly, the 21-day moving average is now close to crossing above the 50-day. The last time we saw that setup, the entire China tech space became very well bid.
Momentum is clearly starting to build again and our preferred way to play this is via optionality (outlined here).
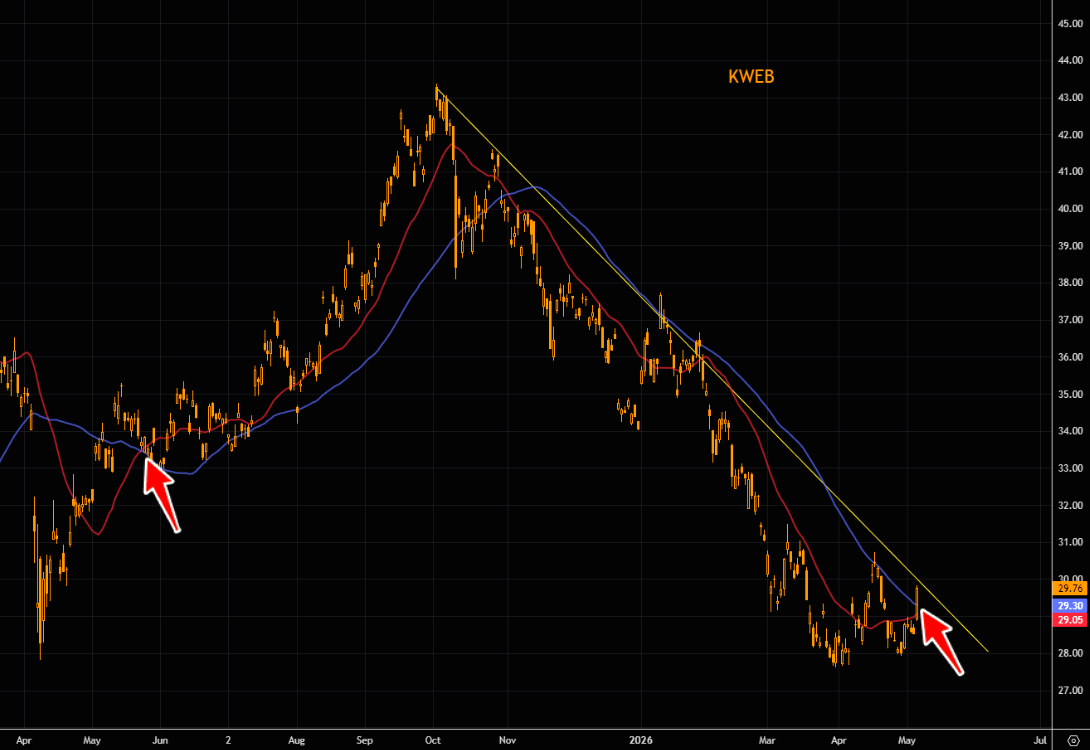
Source: LSEG Workspace
AI bargain
UBS notes China tech now trades around 13x forward earnings, back near pre-DeepSeek levels, despite continued progress in AI investment, infrastructure, and monetization.
Valuations are increasingly pricing AI disappointment, not AI acceleration.
We like that convexity. More here.
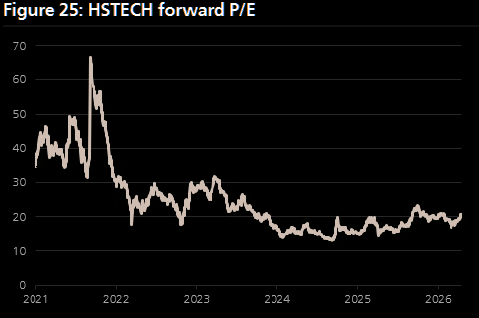
Source: UBS
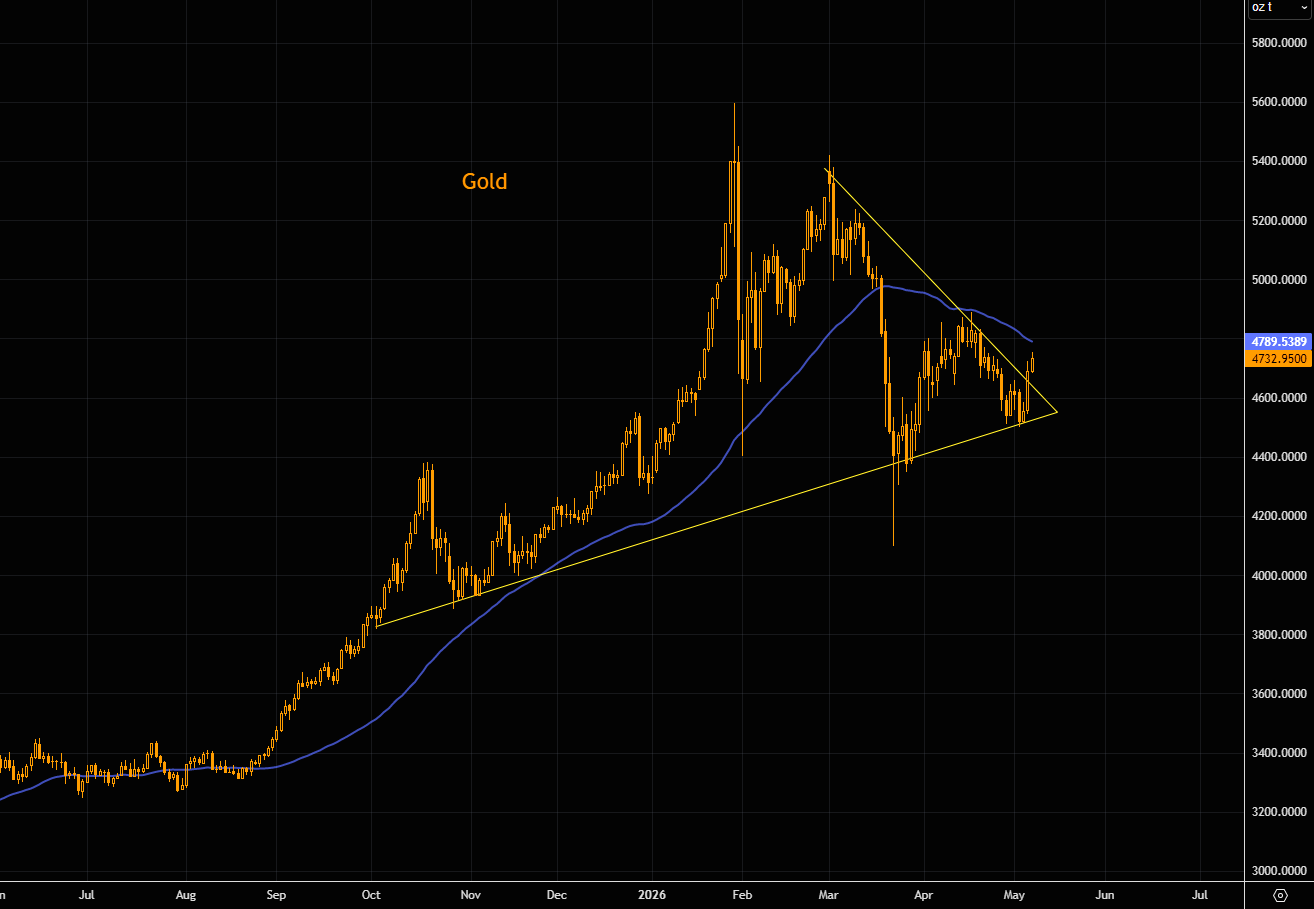
The gold bid
Gold put in its biggest up day in quite some time during yesterday’s session. The shiny metal broke above the short-term downtrend line and also pushed out of a dynamic wedge-like formation.
The key for a more sustained squeeze is a close above the $4800 area, right where the 50-day moving average comes in. More on gold here.
The crash-up dynamic remains intact. So does the risk of a much nastier unwind later on.