
Fra Zerohedge/ Deutsche Bank:
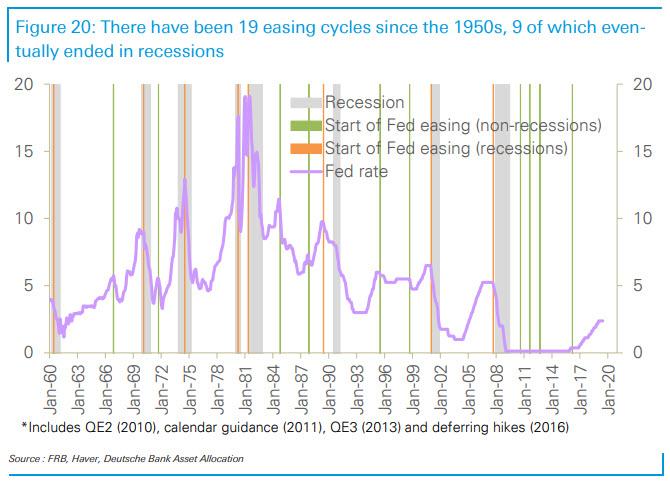
Since the 1950s, the Fed has embarked on 19 easing cycles, including the unconventional easing measures adopted during the course of this economic recovery, according to Deutsche Bank’s Binky Chadha. However of these, 9 or almost half, saw the economy eventually slip into recession; not only that, but the latest three rate cut resulted in a recession within 3 months of the first cut.
How did the economy fare following these rate cuts?
First, the good news for “insurance” rate cuts such as the one coming up, is that mini easing cycles were distinguished by very quick turnarounds in growth (2-3 months) following the first cut. Such quick turnarounds in growth, which risk assets are currently already pricing in, suggests factors other than the easing of monetary policy played key roles in driving them.

In Deutsche Bank’s view, a resolution of the trade war remains key to a turn up in growth at the current juncture.
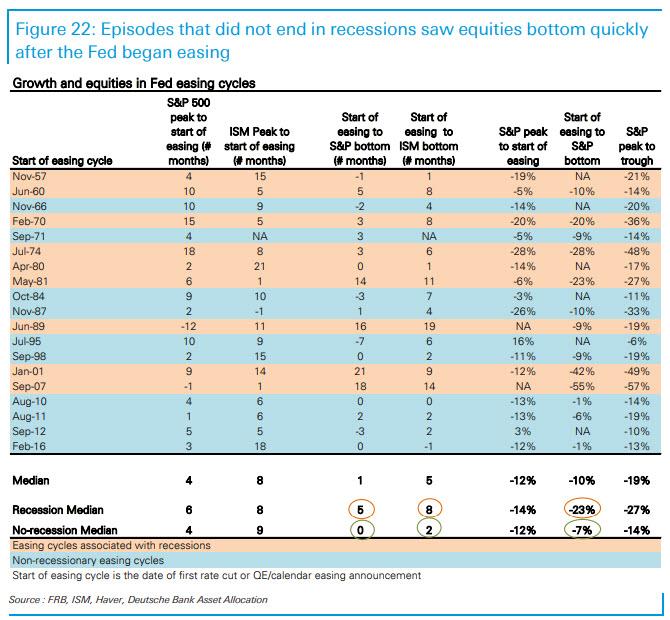
The episodes that ended in recession saw the ISM continue to weaken, eventually bottoming – 8 months after the Fed began cutting – at low levels (median 36). In these recession episodes, the S&P 500 saw a full bear market, typically falling -27% from peak to trough, with a bulk of the decline occurring after the Fed had started easing. Indeed, on average, the S&P 500 did not bottom until 5 months after the Fed started cutting.
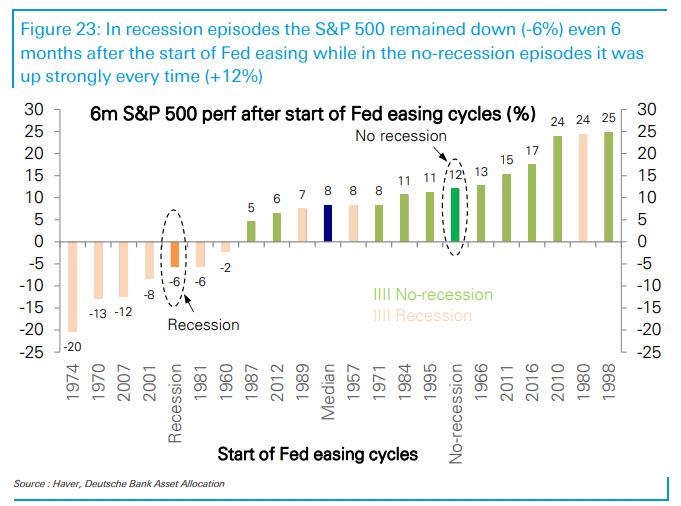
The distinguishing characteristic of the episodes that did not end in recessions was that after a moderate further decline in growth (to a median ISM 48), on average within 2-3 months after the Fed began easing, growth rebounded quickly. The equity market typically fell -7% after the Fed began easing, but bottomed quickly with growth. The S&P 500 ended above the pre-easing level within 6 months each and every time, rising a robust 12% on average.
* * *
Of course, it’s worth pointing out that the Fed always eased when the growth of leading indicators slowed sufficiently. To wit, the Fed always eased when the leading indicators (LEI) have declined over a 6 month period, even when the decline was small.
The LEI has stalled since September 2018 and its 6-month growth has now fallen to zero, on the cusp of turning negative.
So the Fed cutting rates this month as is widely priced in, would be exactly on cue. On average the Fed began easing around 8 months after the ISM peaked and had fallen to around 50, so the current pattern is also in line with the historical script. Typically though the Fed began cutting 4 months after the S&P 500 peaked. And by the time it did so, the market was down a median -12% from its peak.
Of course, this time the market keeps rising and printing new all time highs, in an apparent outlier to historic data. Indeed, as Deutsche Bank notes, “a rate cut with the S&P 500 close to or at a record high as is the case currently is a strong exception to this pattern, having happened only once previously, in 1995.”
But Fed easing historically proved to be a mini cycle only half the time, with a very quick turn up in growth the distinguishing feature. As noted above, of the 19 Fed easing cycles in response to slowing growth, 9 or almost half, saw the economy eventually slip into recession. On average, the S&P 500 did not bottom until 5 months after the Fed started cutting. In mini easing cycle episodes, the S&P 500 ended above the pre-easing level within 6 months each and every time, rising a robust 12% on average. Such quick turnarounds in growth, which risk assets are currently already pricing in, suggests factors other than the easing of monetary policy played key roles in driving them.
Some more detailed observations from Chadha’s full note, starting with the observation that the Fed is cutting on cue, but…
1. Bond market priced in line, growth and risk assets for a significant rebound in growth
US 10y bond yields have tracked growth indicators like the ISM Manufacturing index closely through this cycle (correlation 69%). The decline in yields since last November has been in line with the slowing in growth.
Equities on the other hand, where the S&P 500 relative to its 200 day moving average (to normalize for trends) has been robustly correlated (63%) with growth indicators such as the manufacturing ISM over the last 20 years, has become increasingly disconnected since early June and looks now to be pricing in a significant rebound, from 51.7 currently back up to around 57.

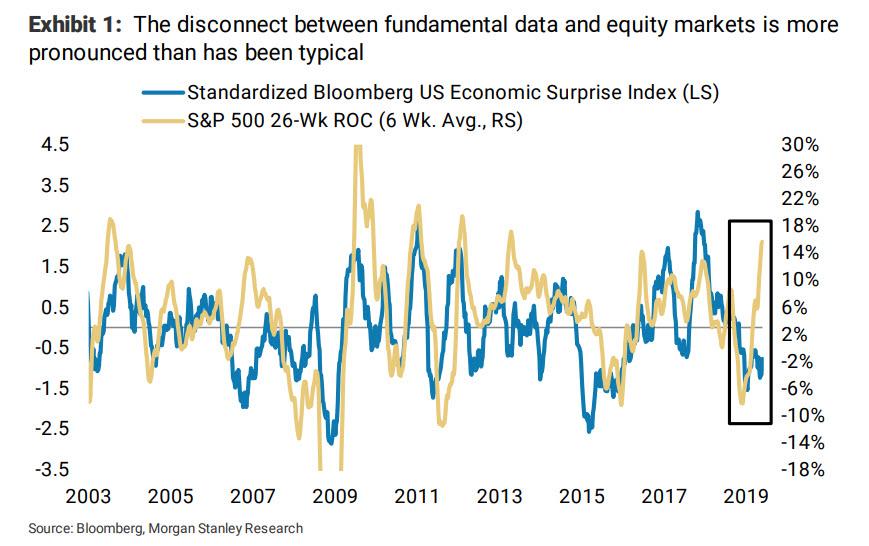
In fact, Morgan Stanley over the weekend noted that the disconnect between the economy and equity markets has never been this great.
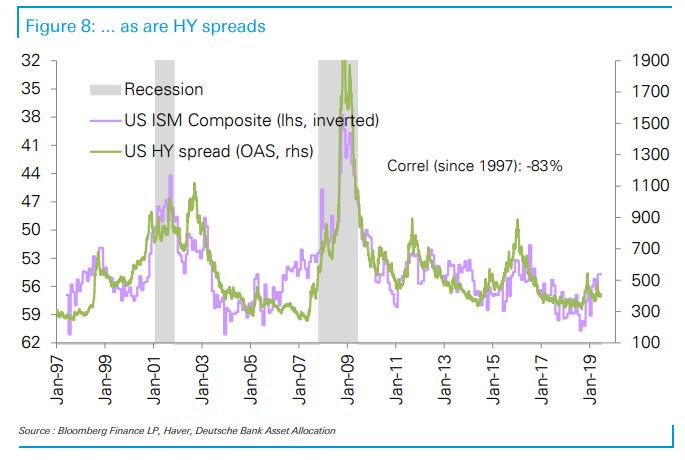
In price terms, this puts the S&P 500 around 10% above fair value based on current growth. While the S&P 500 has risen to new cycle highs even as earnings have stagnated for the last 10 months, credit spreads both IG and HY are well wide of their tights reached last year. Credit spreads are also closely correlated with indicators of growth (composite ISM correlations over the last 20 years are -78% for HG and -83% for HY). That said, credit spreads are tighter than levels implied by current growth and are also pricing in a significant rebound, albeit less than equities are.
In commodities, as Gold has broken above its 7-year range it has become a focal point of market attention. On a relative basis, the ratio of Industrial to Precious Metals, which closely follows the ISM manufacturing (77%)…
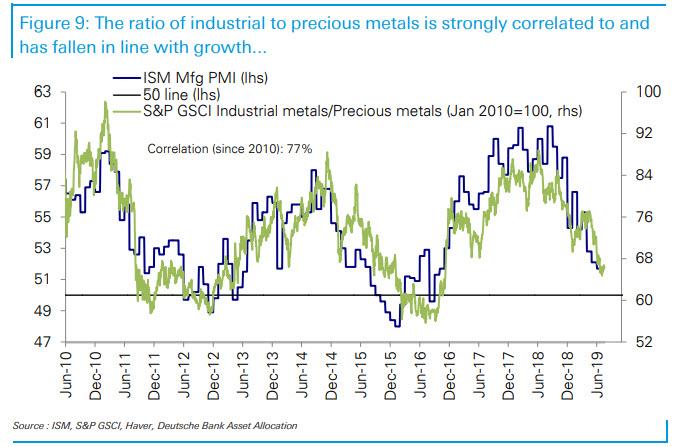
…and US 10y yields (85%), has moved in line.

2. Next up in the growth slowdown: earnings set to disappoint globally
With growth the main driver of earnings, global PMIs, especially in manufacturing, have been declining uninterruptedly since early 2018. In the US, the manufacturing ISM has been falling for the last 9 months, and is down from above 60 to 51.7. Export orders have been leading the ISM and point to an imminent dip in the manufacturing ISM below 50, i.e., into contractionary territory, as do other leading indicators like new orders. Growth in the LEIs is also on the cusp of turning negative.
The next and critical read on growth comes from Q2 corporate earnings results reported over the next few weeks. The cuts have lagged persistently negative macro data surprises, with which they are generally well correlated and we see the cuts as too little. DB’s top-down model for US earnings, incorporating US and global growth and the US dollar, also suggests that consensus estimates are too high.
So we expect either continued downgrades into or disappointing results. Similarly, earnings estimates in Europe also look too optimistic and several companies have already issued negative guidance in recent weeks. Earnings estimates in Japan and in EM have fallen more significantly but remain vulnerable, with trends in growth and data surprises still headed downward
So As Jim Reid summarizes, history suggests a much higher probability of an imminent recession than markets do and also that we’re at quite a binary moment for markets as the Fed (and other central banks) embark on a fresh easing cycle.