


Hyperscaler bond basket spreads need a bigger chart soon.

Source: ZH
Distress
Some indicators of distress have been ticking up.

Source: PitchBook
The Market Is Starting To Crack
Cracks Beneath The Surface
Markets are beginning to crack beneath the surface. Technical damage is mounting, volatility positioning remains unusually light and another leg higher in oil could quickly turn an orderly pullback into something far more disorderly.
NDX technicals
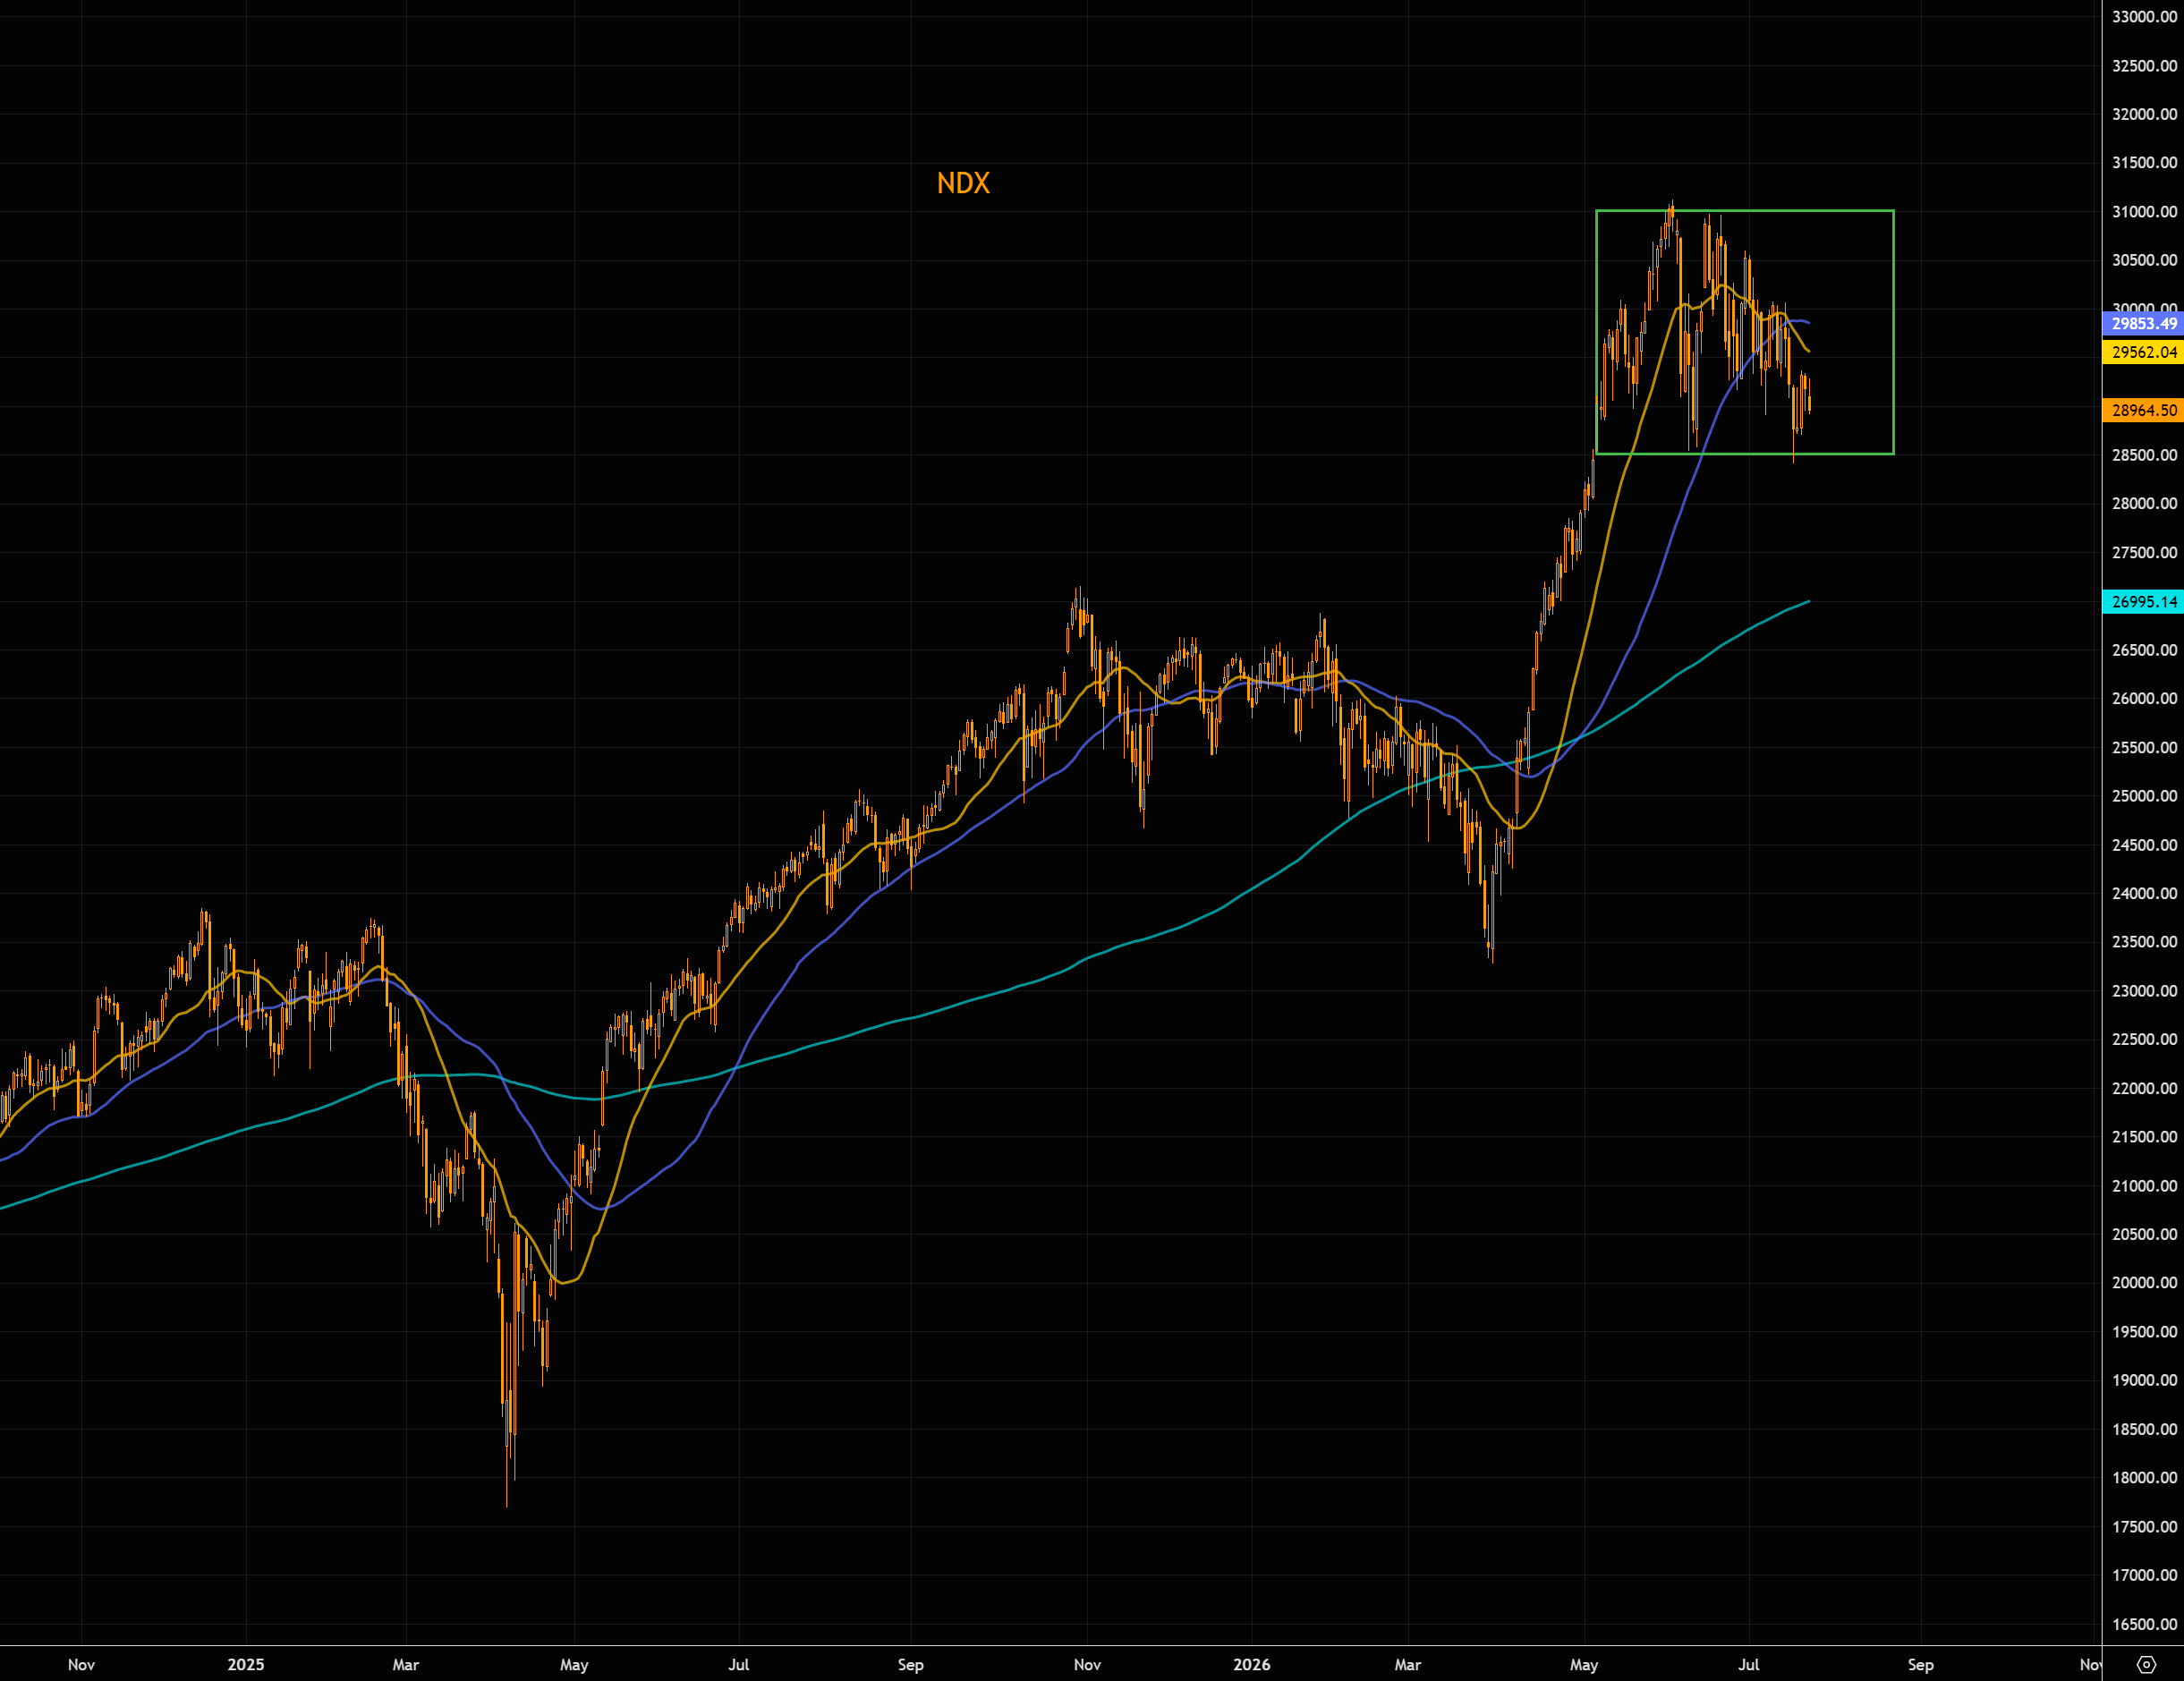
The index is now trading well below its 50-day moving average, while the 21-day has crossed below the 50-day, a mildly bearish technical development.
A break below 28,500 would leave little meaningful support until the 200-day moving average, currently sitting around 27,000.
Source: LSEG Workspace
Trapped
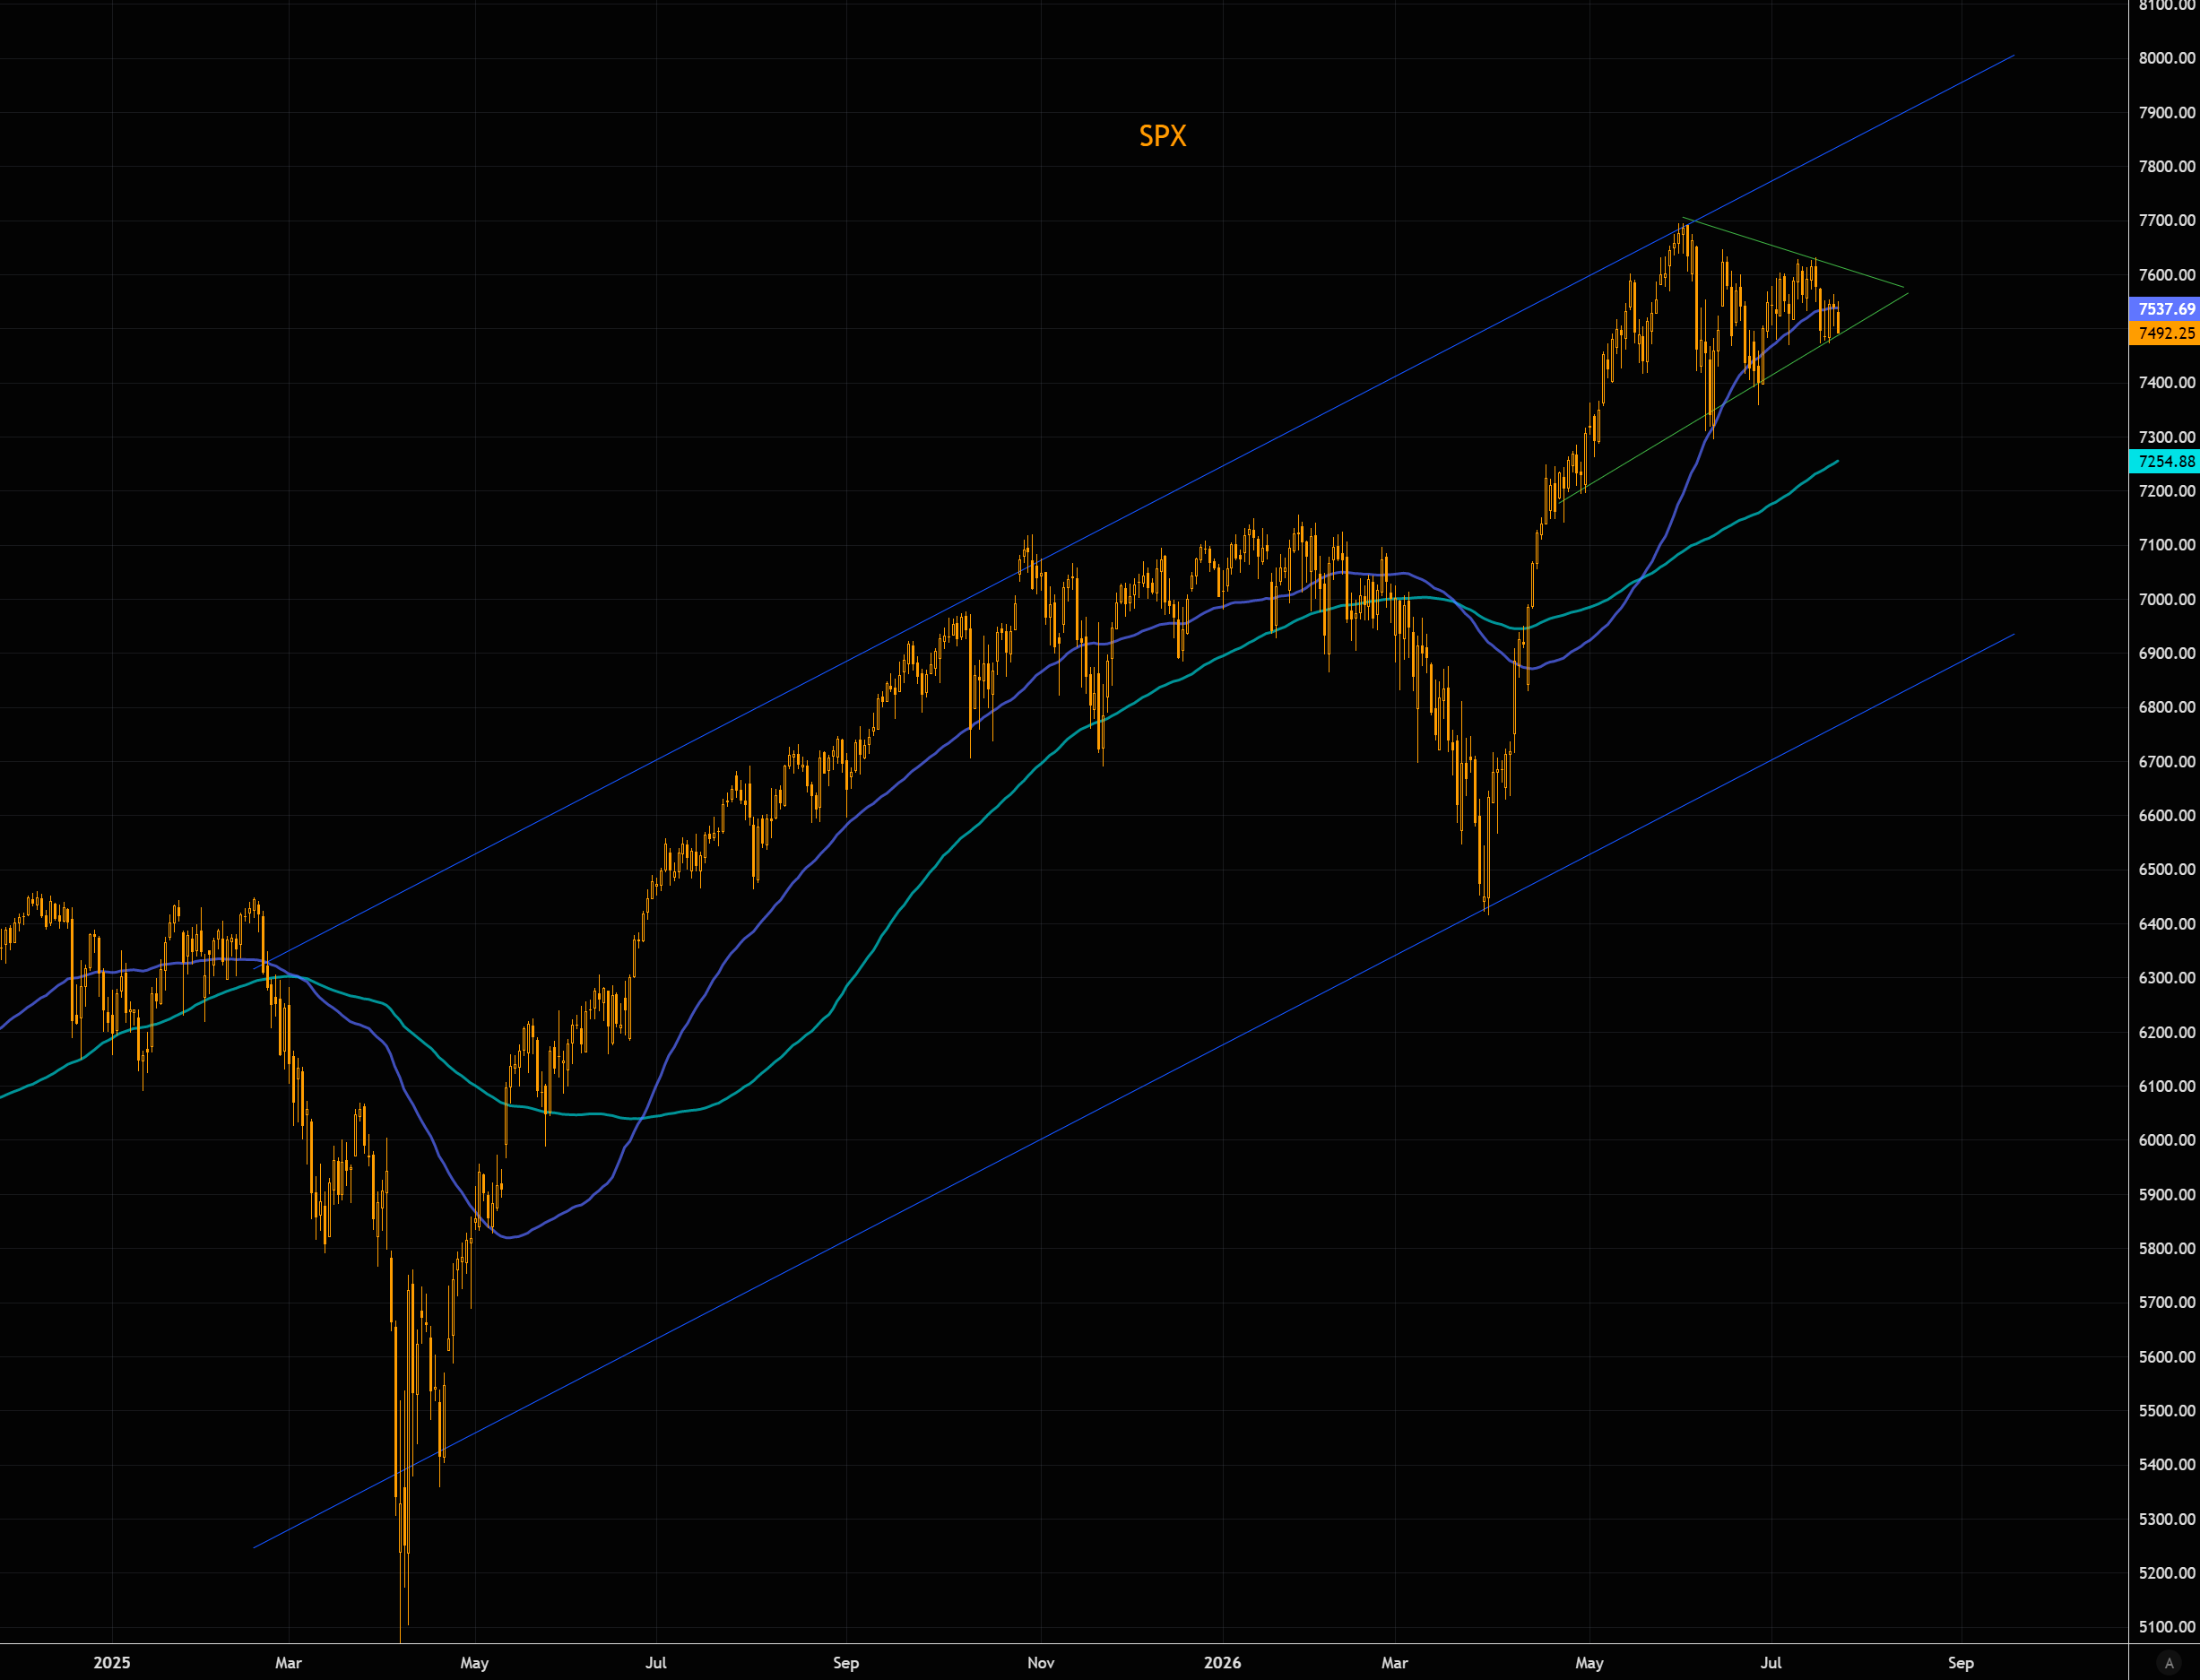
The SPX is becoming increasingly compressed within a triangle-like formation, with no clear short-term trend in place. A decisive close below the 7,500 level could trigger an acceleration to the downside.
The index is currently trading below its 50-day moving average, while the 100-day moving average remains considerably lower, suggesting there is still room before stronger longer-term technical support comes into play.
Source: LSEG Workspace
Massive in MAG
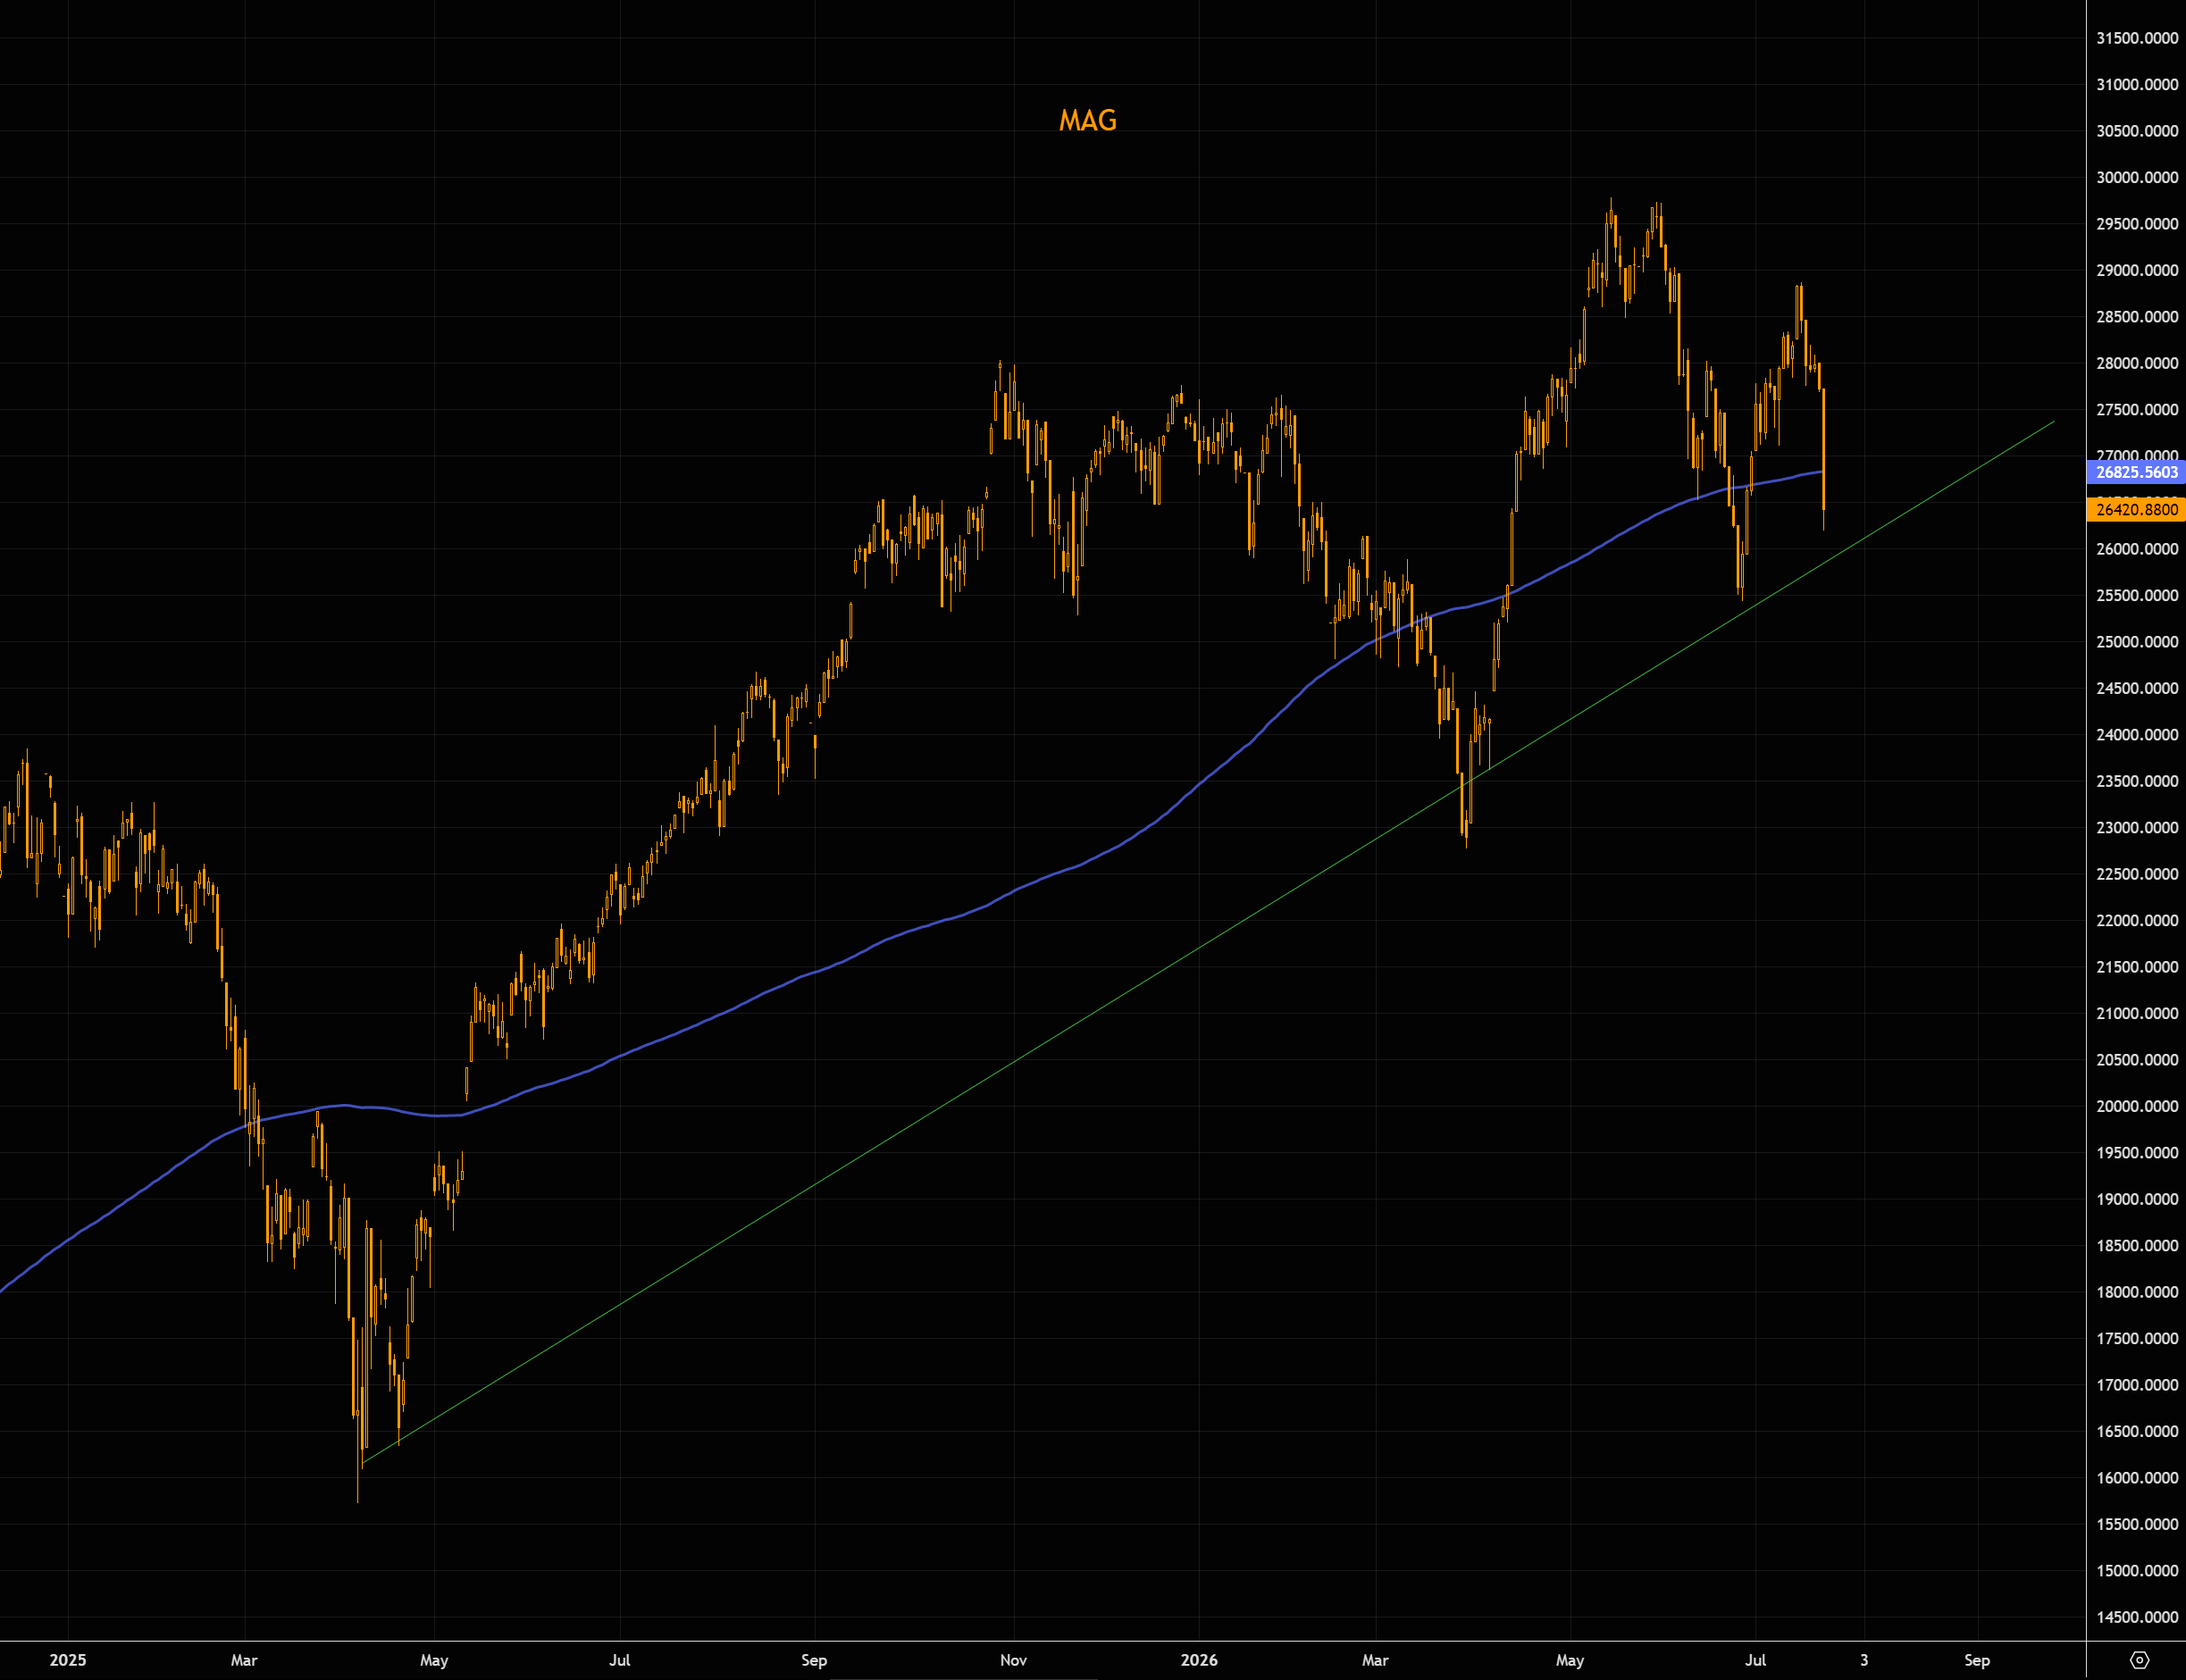
The Mag-7 has just posted one of its largest down candles in years. Yet despite the violence of the move, the group is now simply back trading at roughly the same levels as last September. The next key support is the long-term trendline just below current prices. The break below the 200-day moving average is worth noting, although less significant given the average remains largely flat.
Source: LSEG Workspace
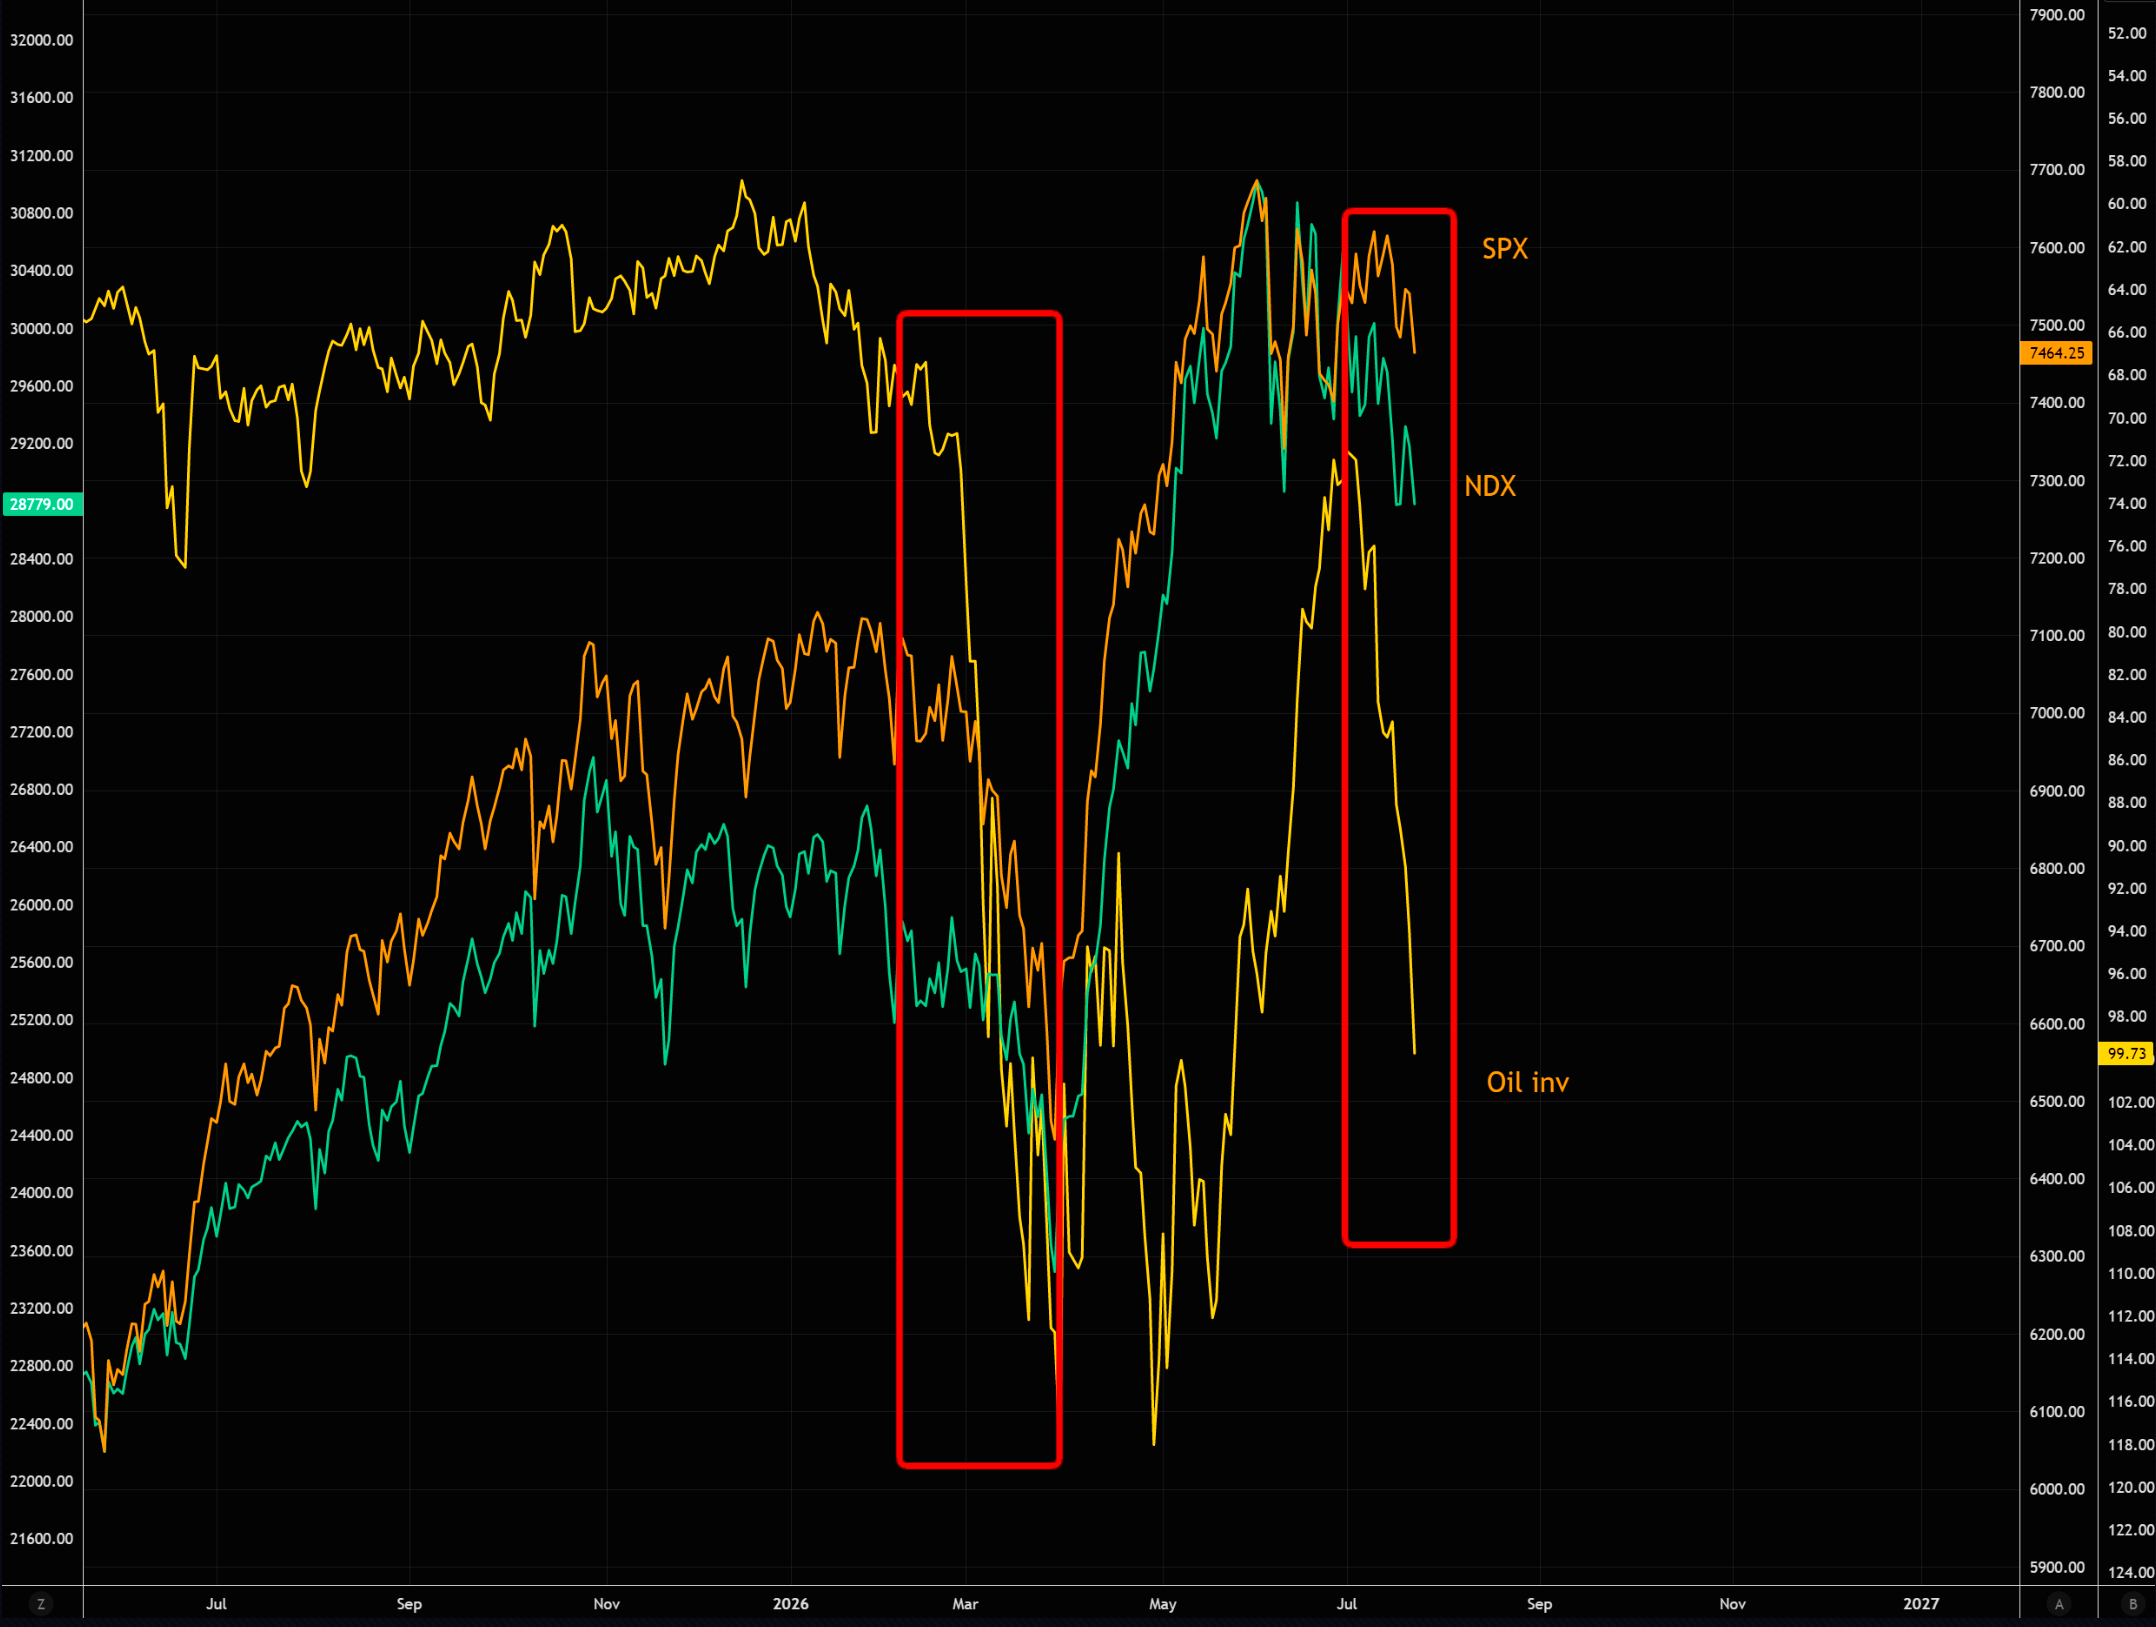
Gradually… then suddenly?
Equities have largely shrugged off the latest spike in oil prices. But if complacent investors start paying attention to crude again, the sell-off could quickly become far more severe.
Source: LSEG Workspace
Still underpriced
Outlined before the latest spike in vols…
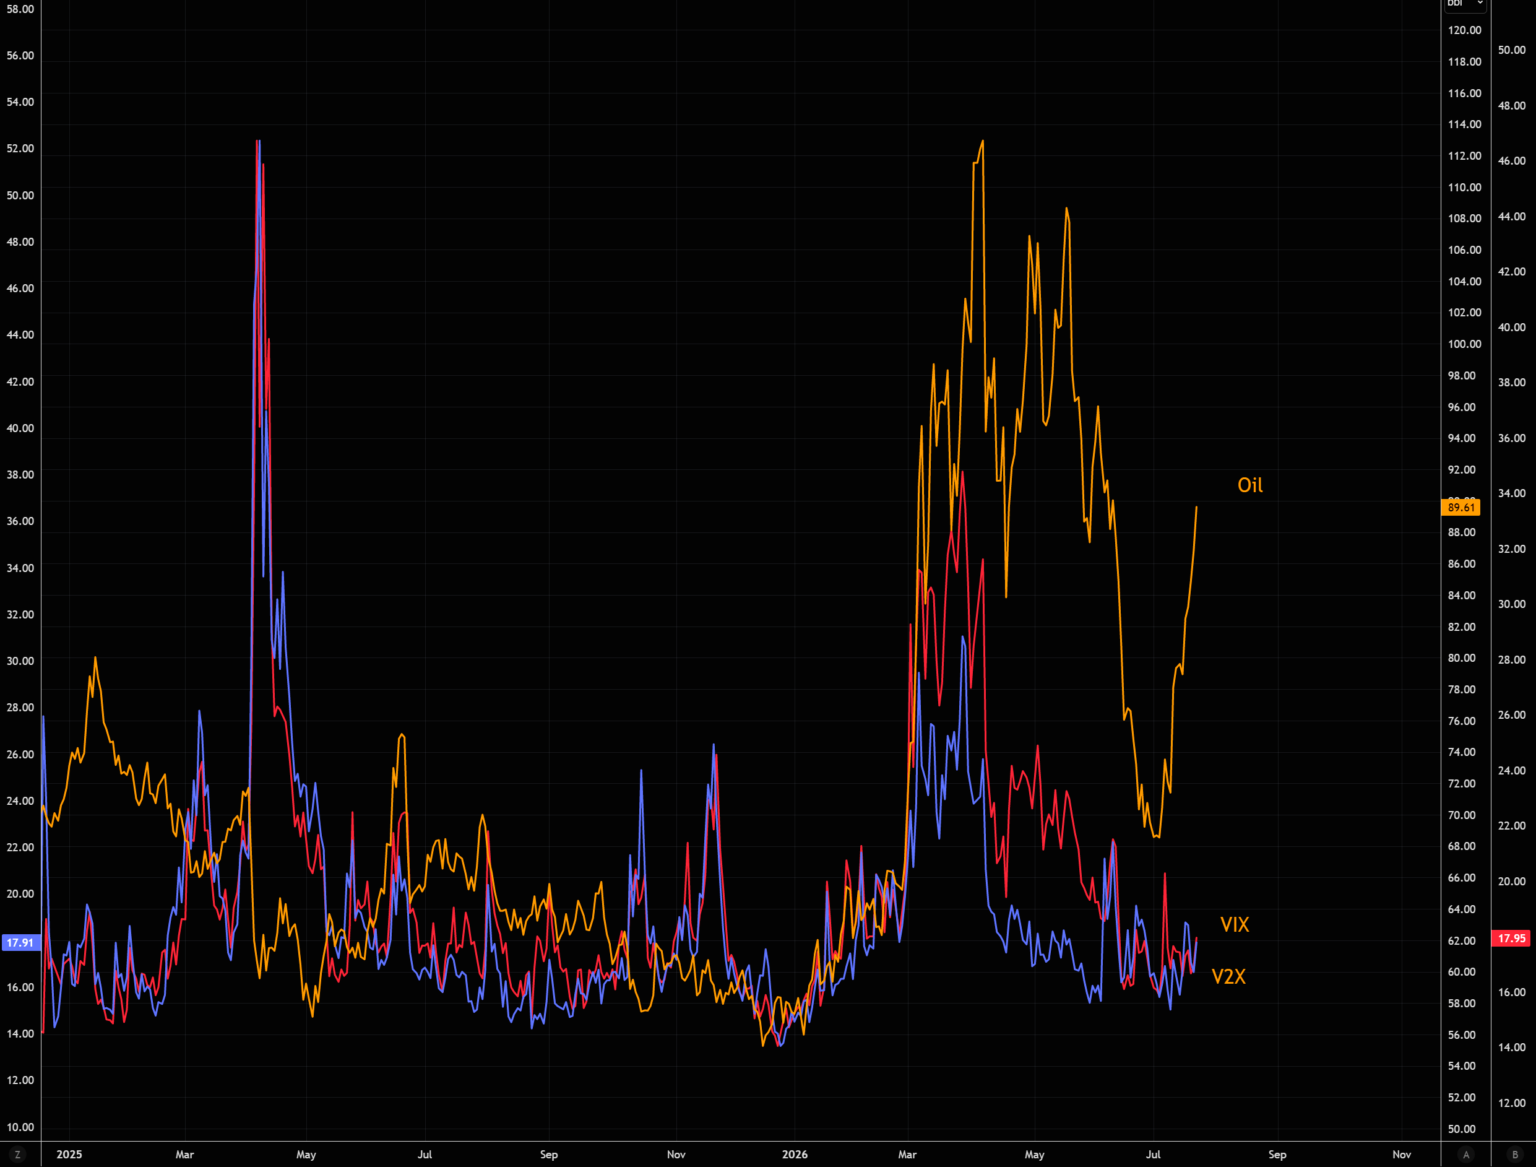
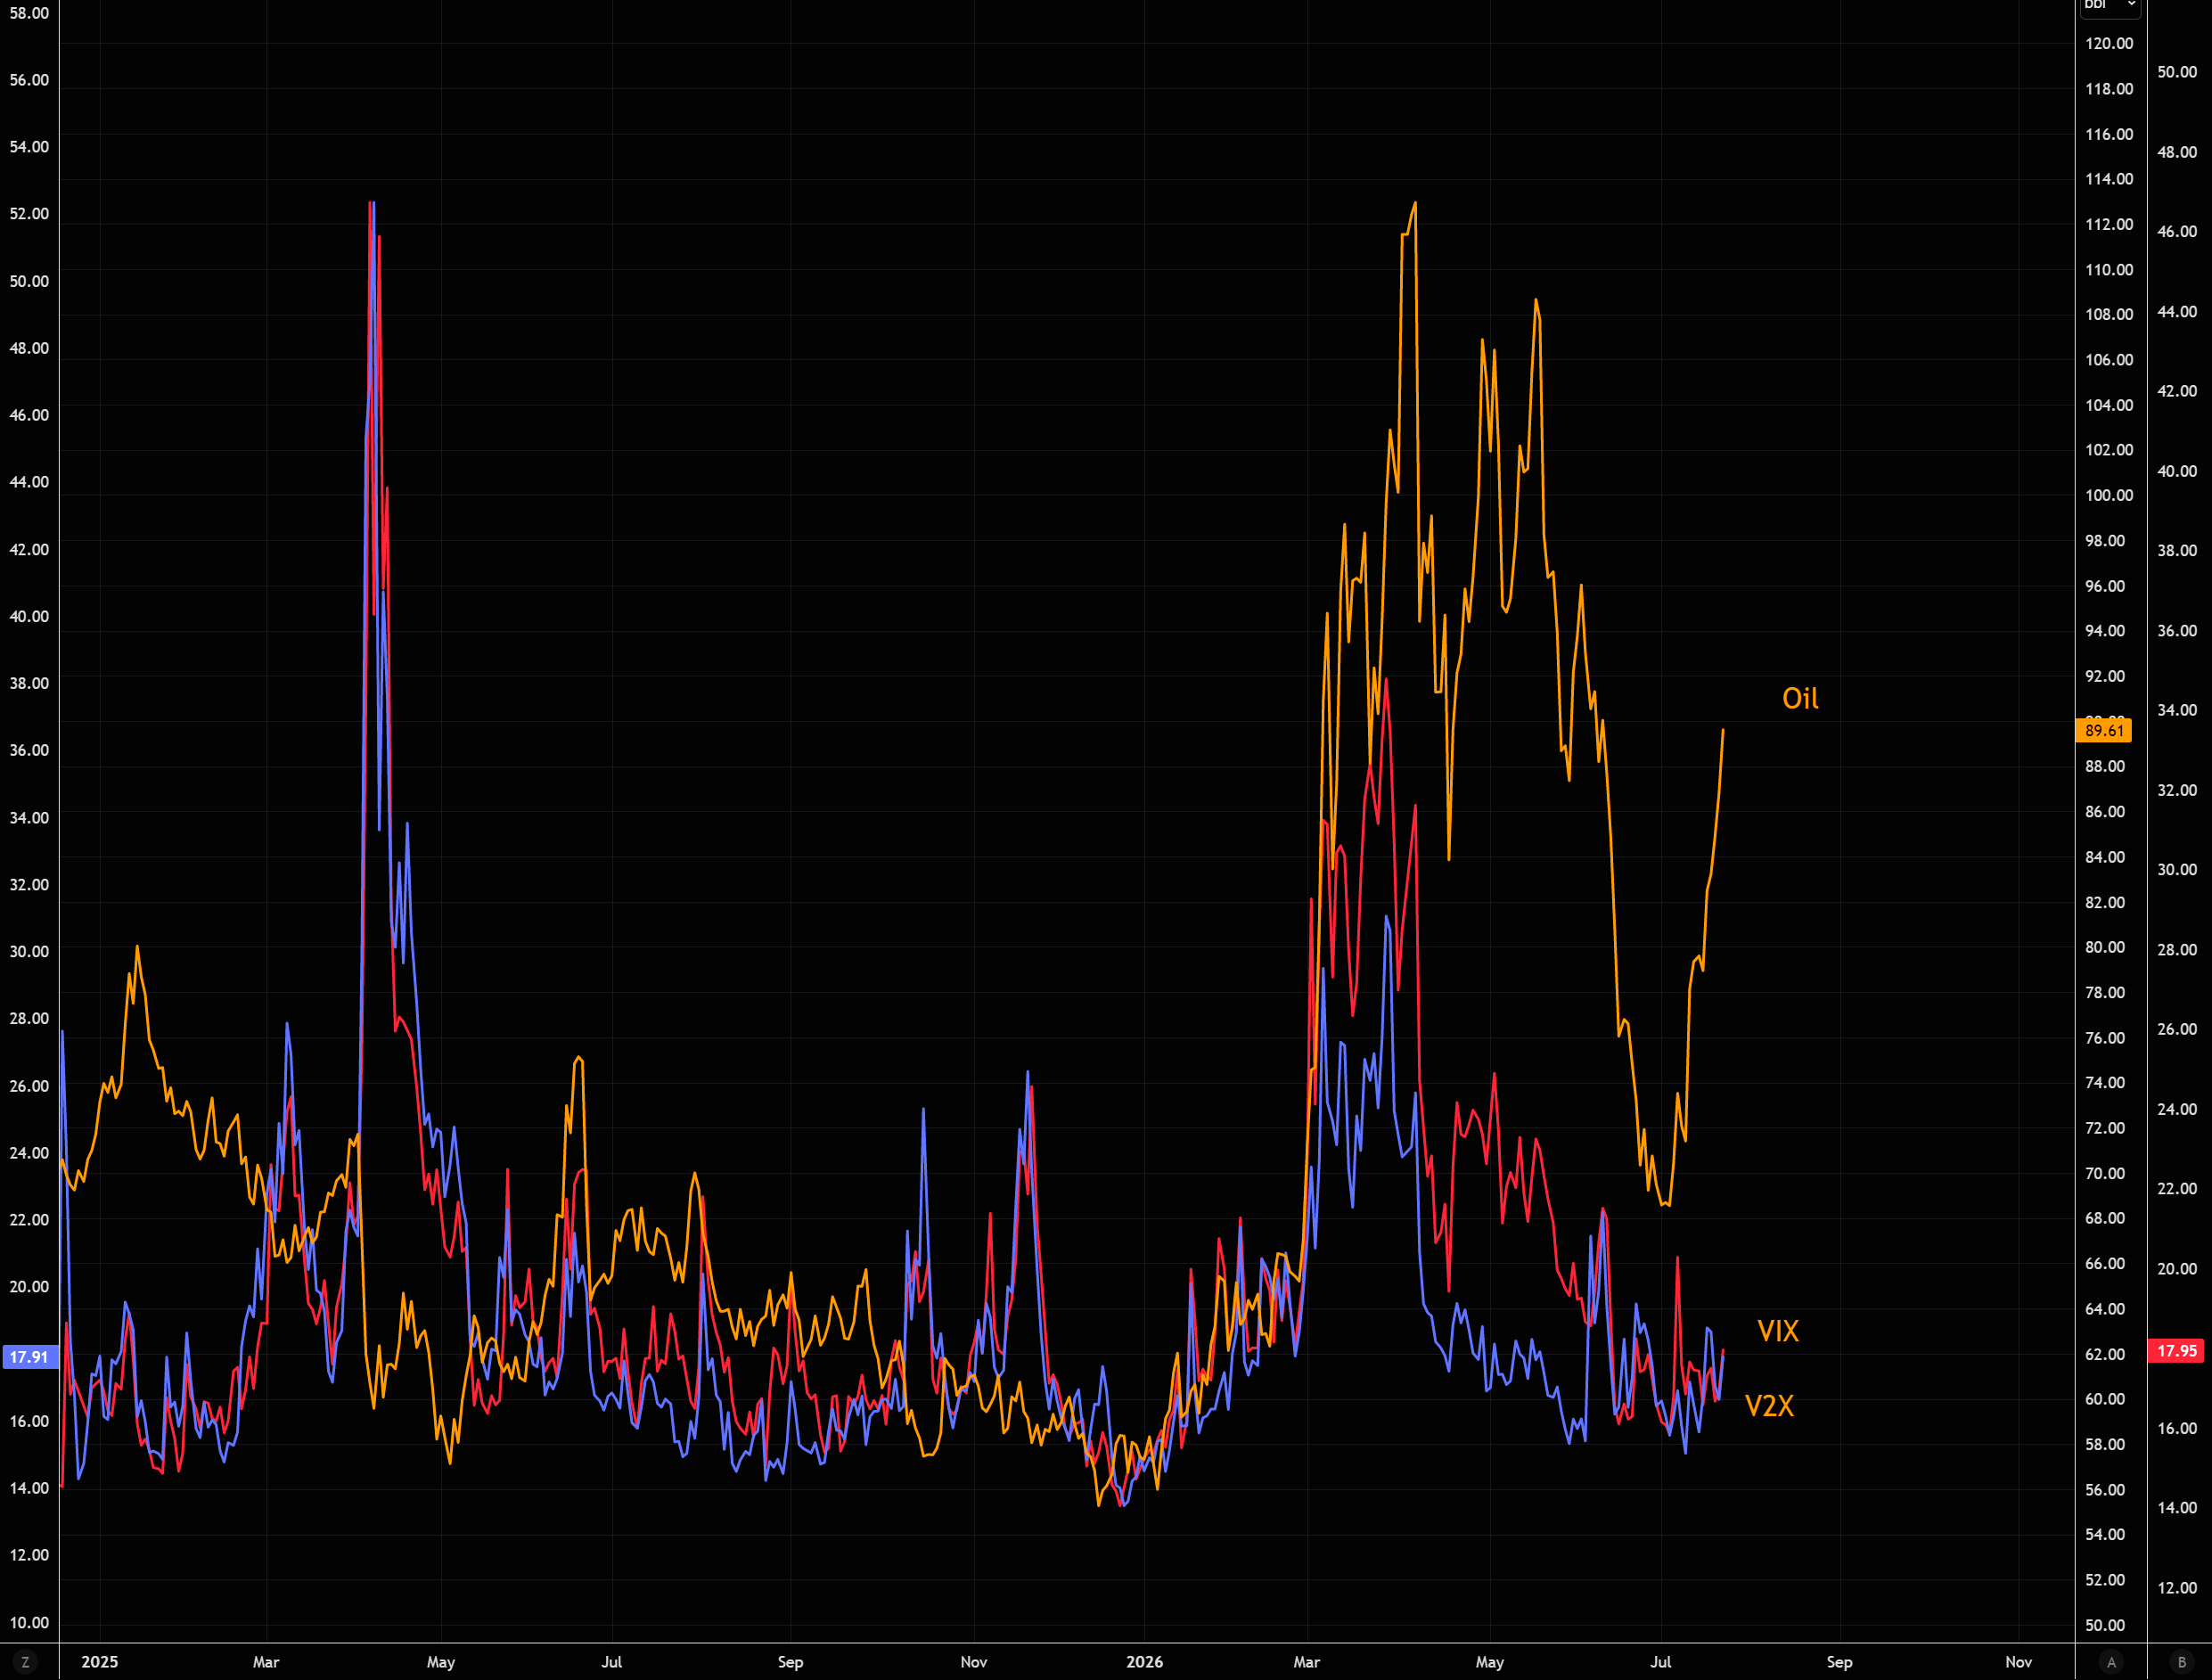
Most investors missed the latest squeeze in oil and are now starting to feel increasingly uneasy about what could happen if crude continues higher and begins spilling over into other asset classes. Europe remains one of the world’s biggest net energy importers, making it particularly vulnerable to another sustained move higher in oil prices.
Yet equity volatility continues to behave as if the oil move were largely irrelevant. VIX and V2X remain well below levels typically associated with a sustained rise in crude, suggesting cross-asset markets are still underpricing the risk of a broader spillover. ‘
Source: LSEG Workspace
Subdued
Tail-hedging demand remains subdued, dealer short VIX call exposure is limited, VIX ETNs have continued to see redemptions, and asset managers’ long VIX futures positioning sits in just the 1st percentile.
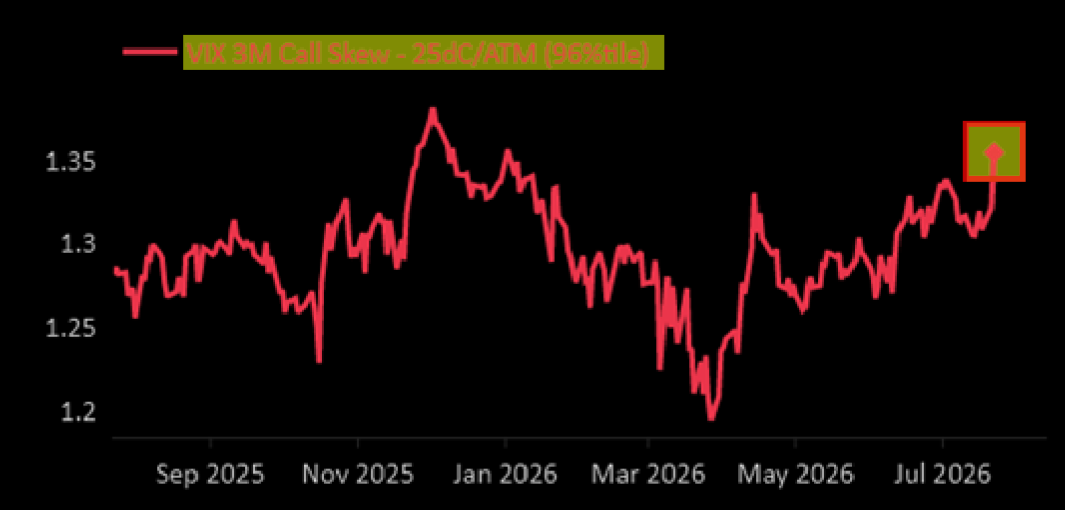
What stands out instead is VIX call skew according to McElligott, which ranks in the 96th percentile. Similar to the elevated VVIX, the options market continues to assign a hefty premium to upside volatility protection despite otherwise light volatility positioning.
As we outlined yesterday, VIX call spreads are attractive for the ones needing hedges. 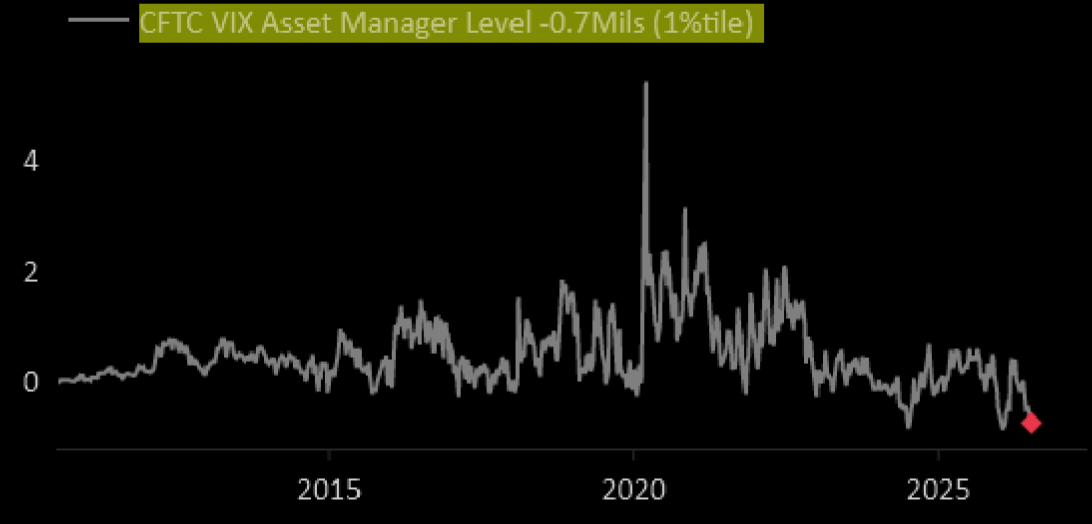
Source: Nomura
Could get fluid
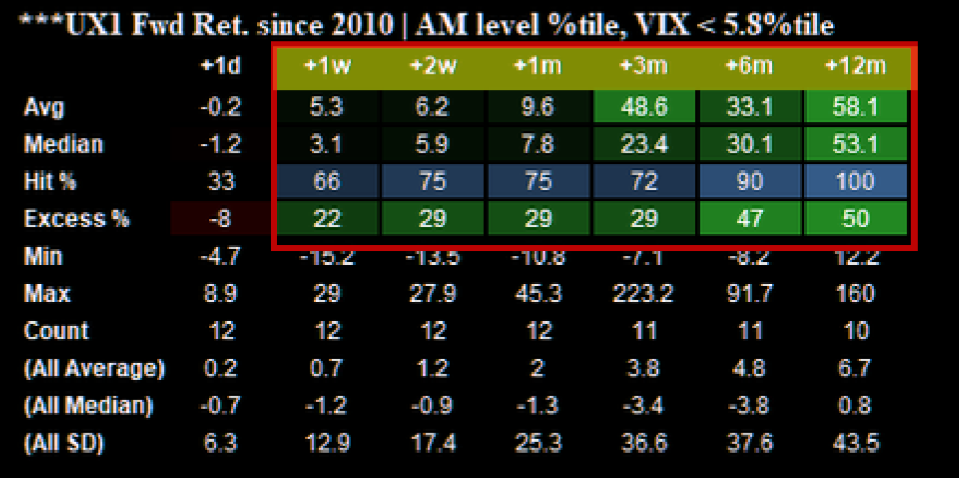
One reason for caution is that asset managers’ VIX futures positioning remains near historic lows. Historically, similarly depressed positioning has preceded some of the strongest forward gains in VIX futures, suggesting volatility could reprice sharply if market sentiment turns.
Source: Nomura
Tail hedging is picking up
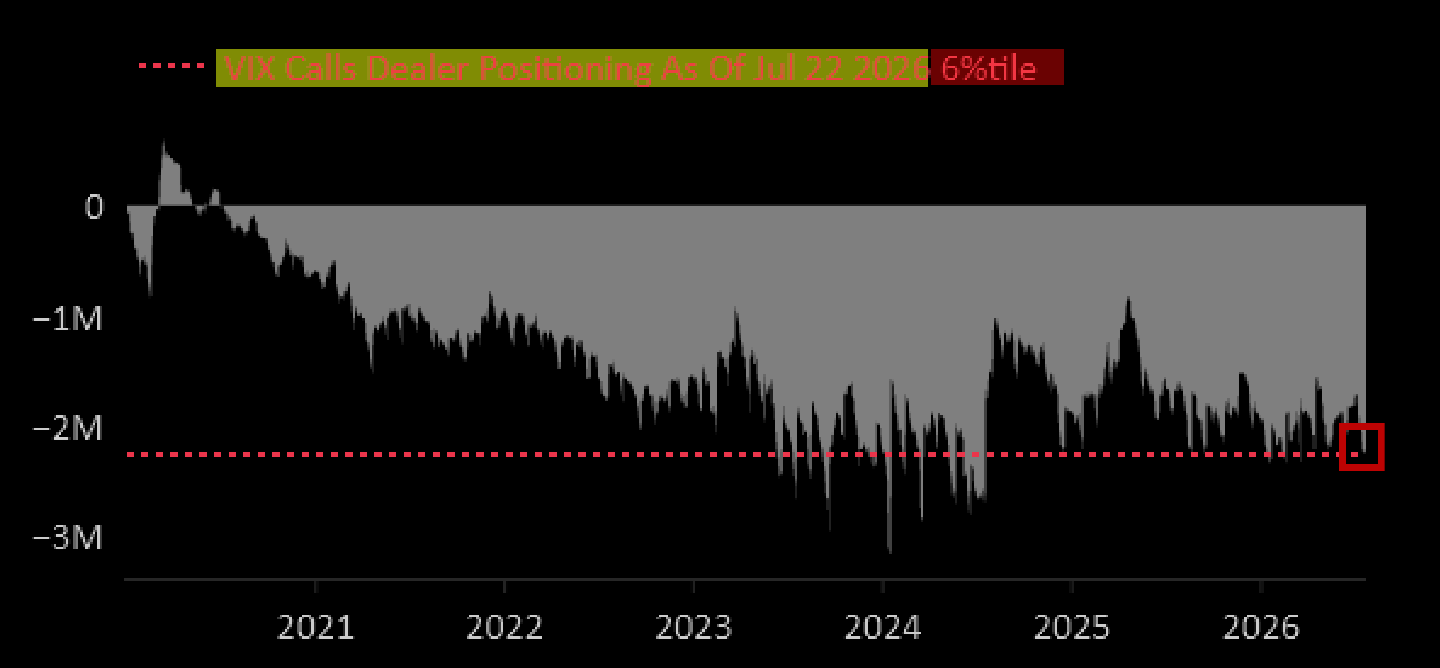
According to Nomura’s Charlie McElligott, demand for VIX upside structures, including outright calls, call spreads and call flies, has increased noticeably. While dealers are not yet facing a meaningful short-convexity problem, continued demand for upside VIX exposure could eventually create one.
McElligott believes the biggest source of future VIX call demand could come from dispersion traders who remain short index volatility. If market correlation spikes during a broader sell-off, these investors may be forced to buy VIX calls to hedge their positions, potentially amplifying the move higher in volatility. That is one reason VVIX has remained unusually elevated, suggesting investors continue to reach for downside protection.
Source: Nomura
Downside convexity
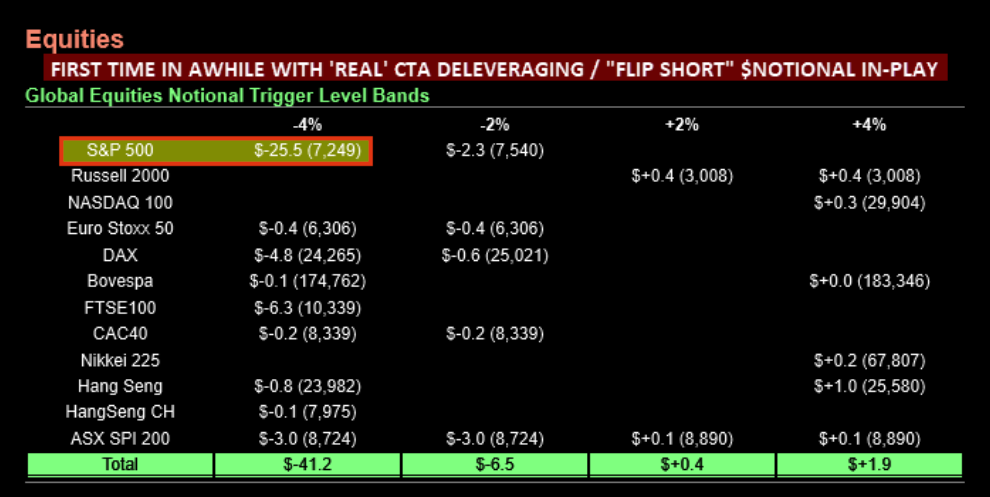
CTA positioning is becoming more fragile. According to Nomura’s Charlie McElligott, the three-month trend is the biggest driver of CTA equity positioning, accounting for more than half of the current long signal in the S&P 500 and most of the long exposure in the Nasdaq 100 and Russell 2000.
That trend is now starting to weaken as stocks move lower. If markets continue to fall, either quickly or gradually, the model could eventually flip from long to short, forcing CTAs to sell. The S&P 500 would see by far the largest selling pressure, with roughly $25.5 billion of futures potentially coming to market.
Source: Nomura
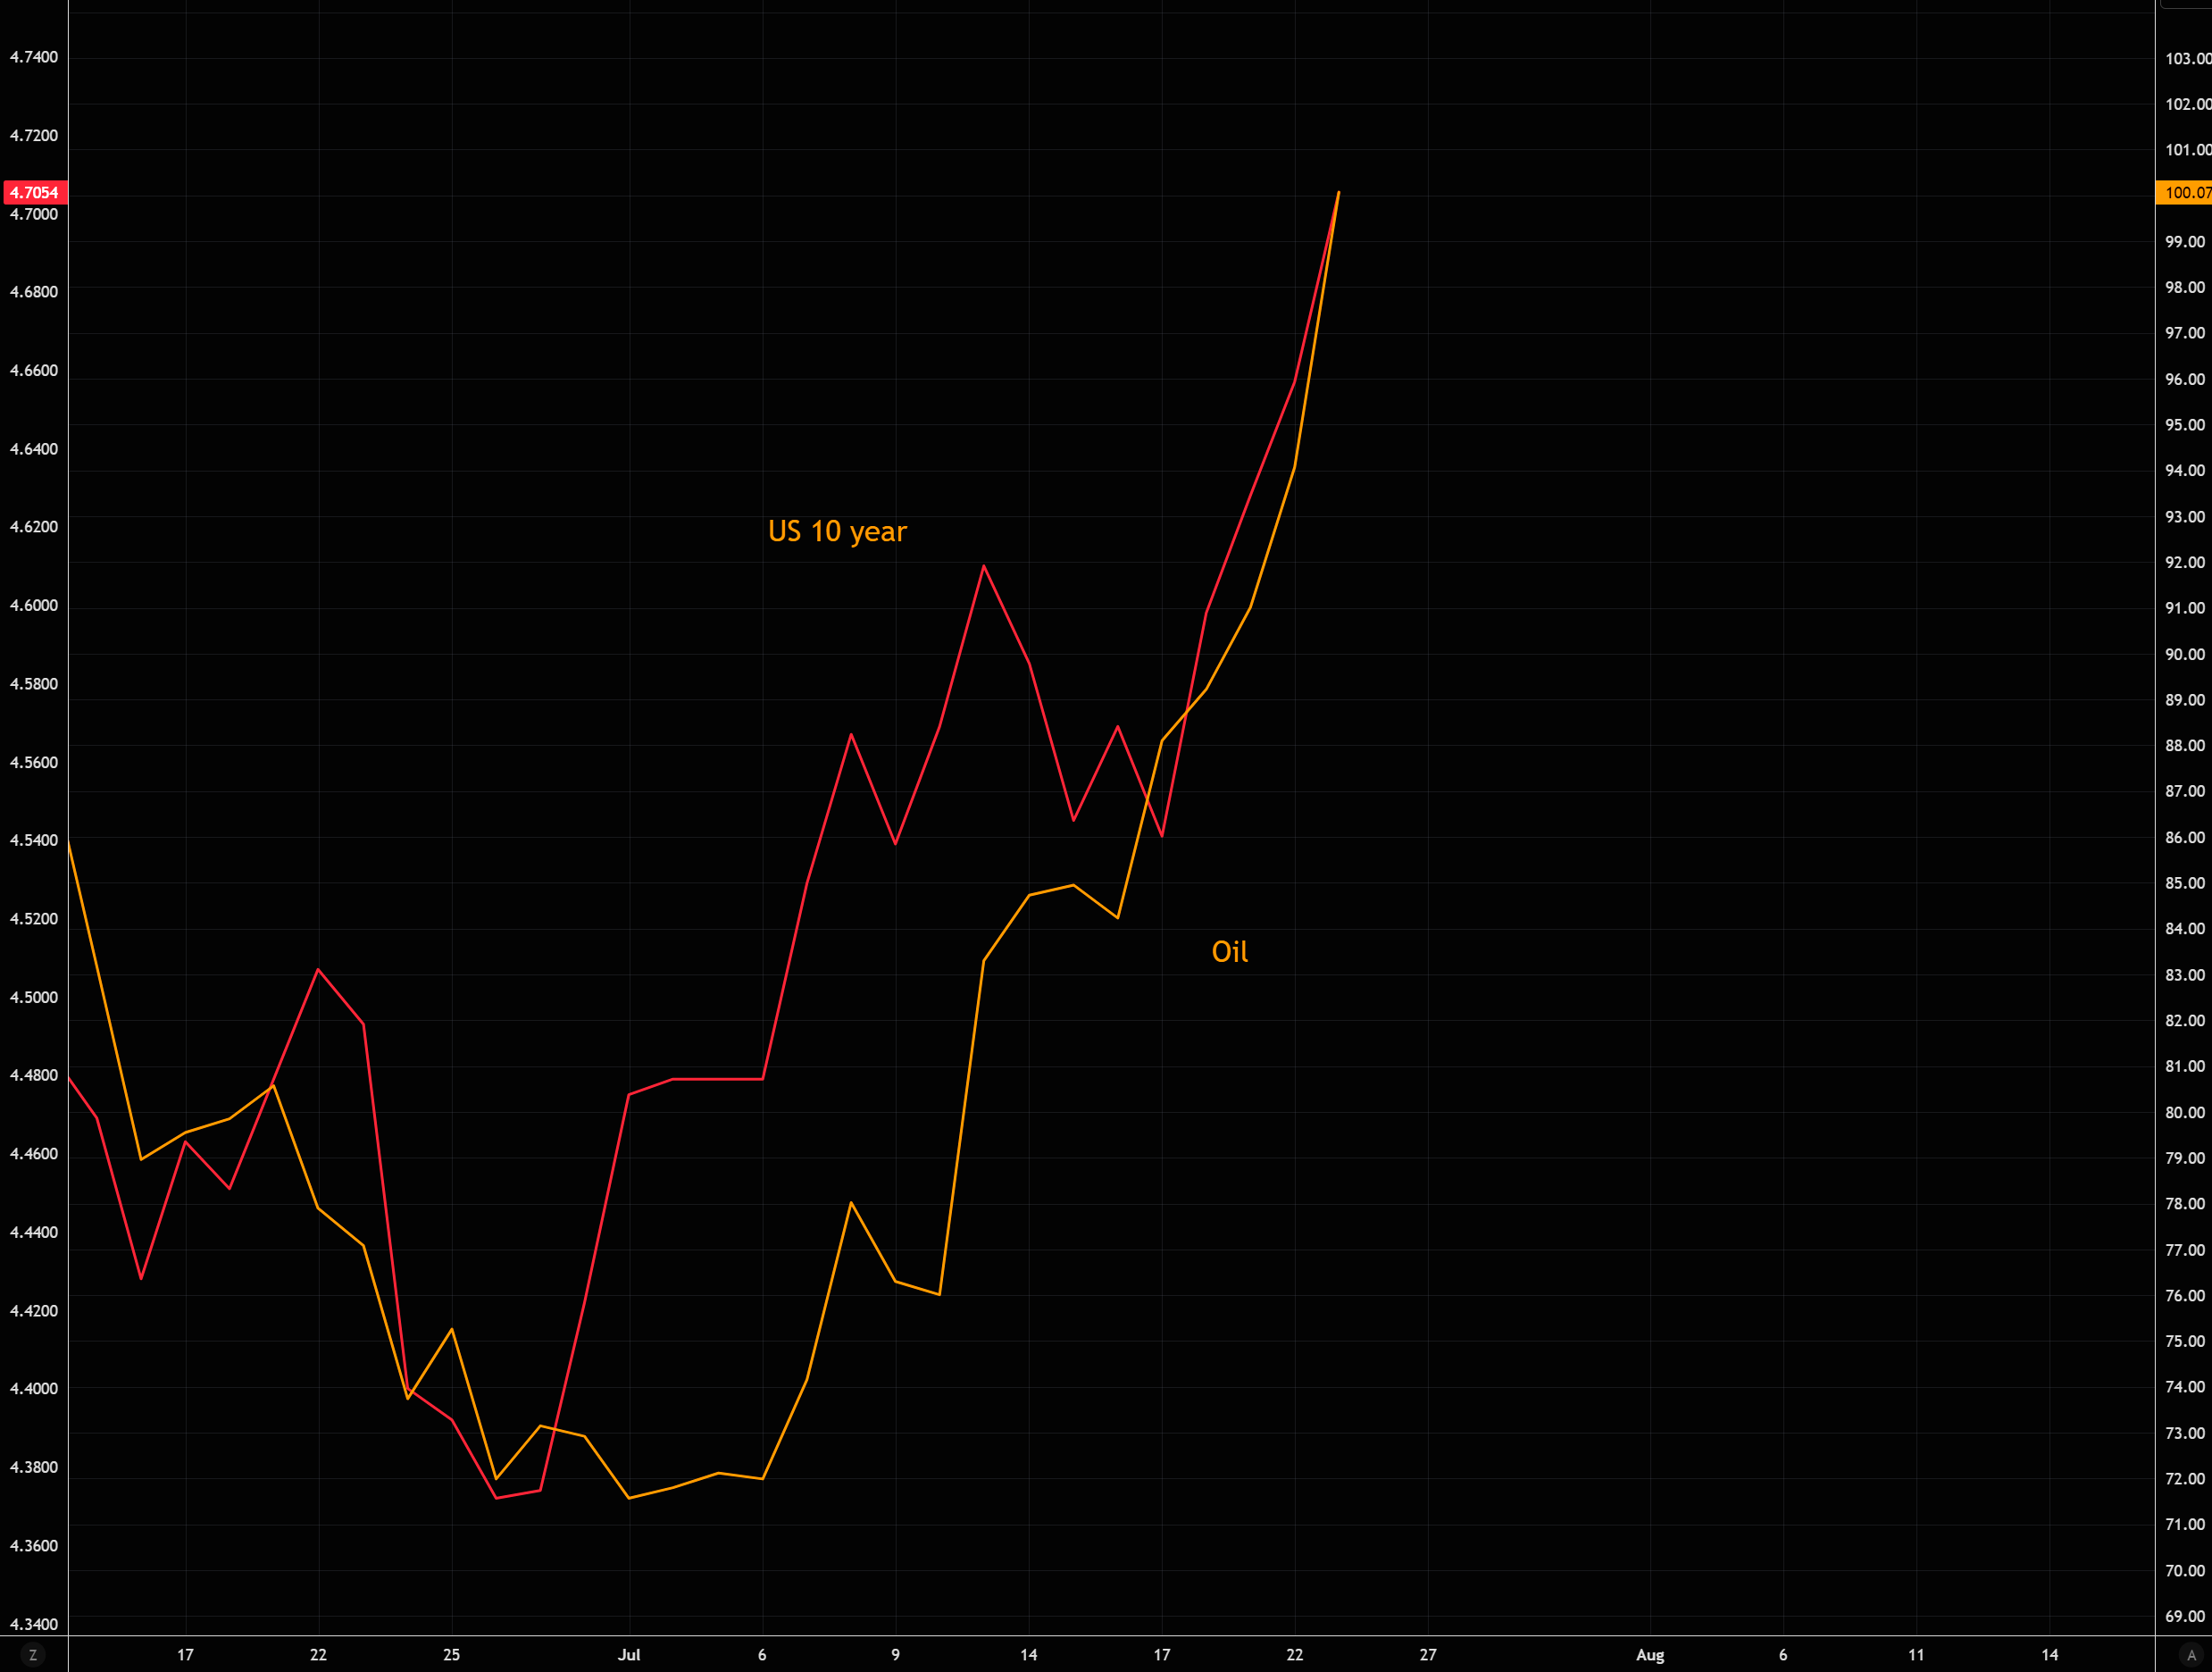
Up, up and away
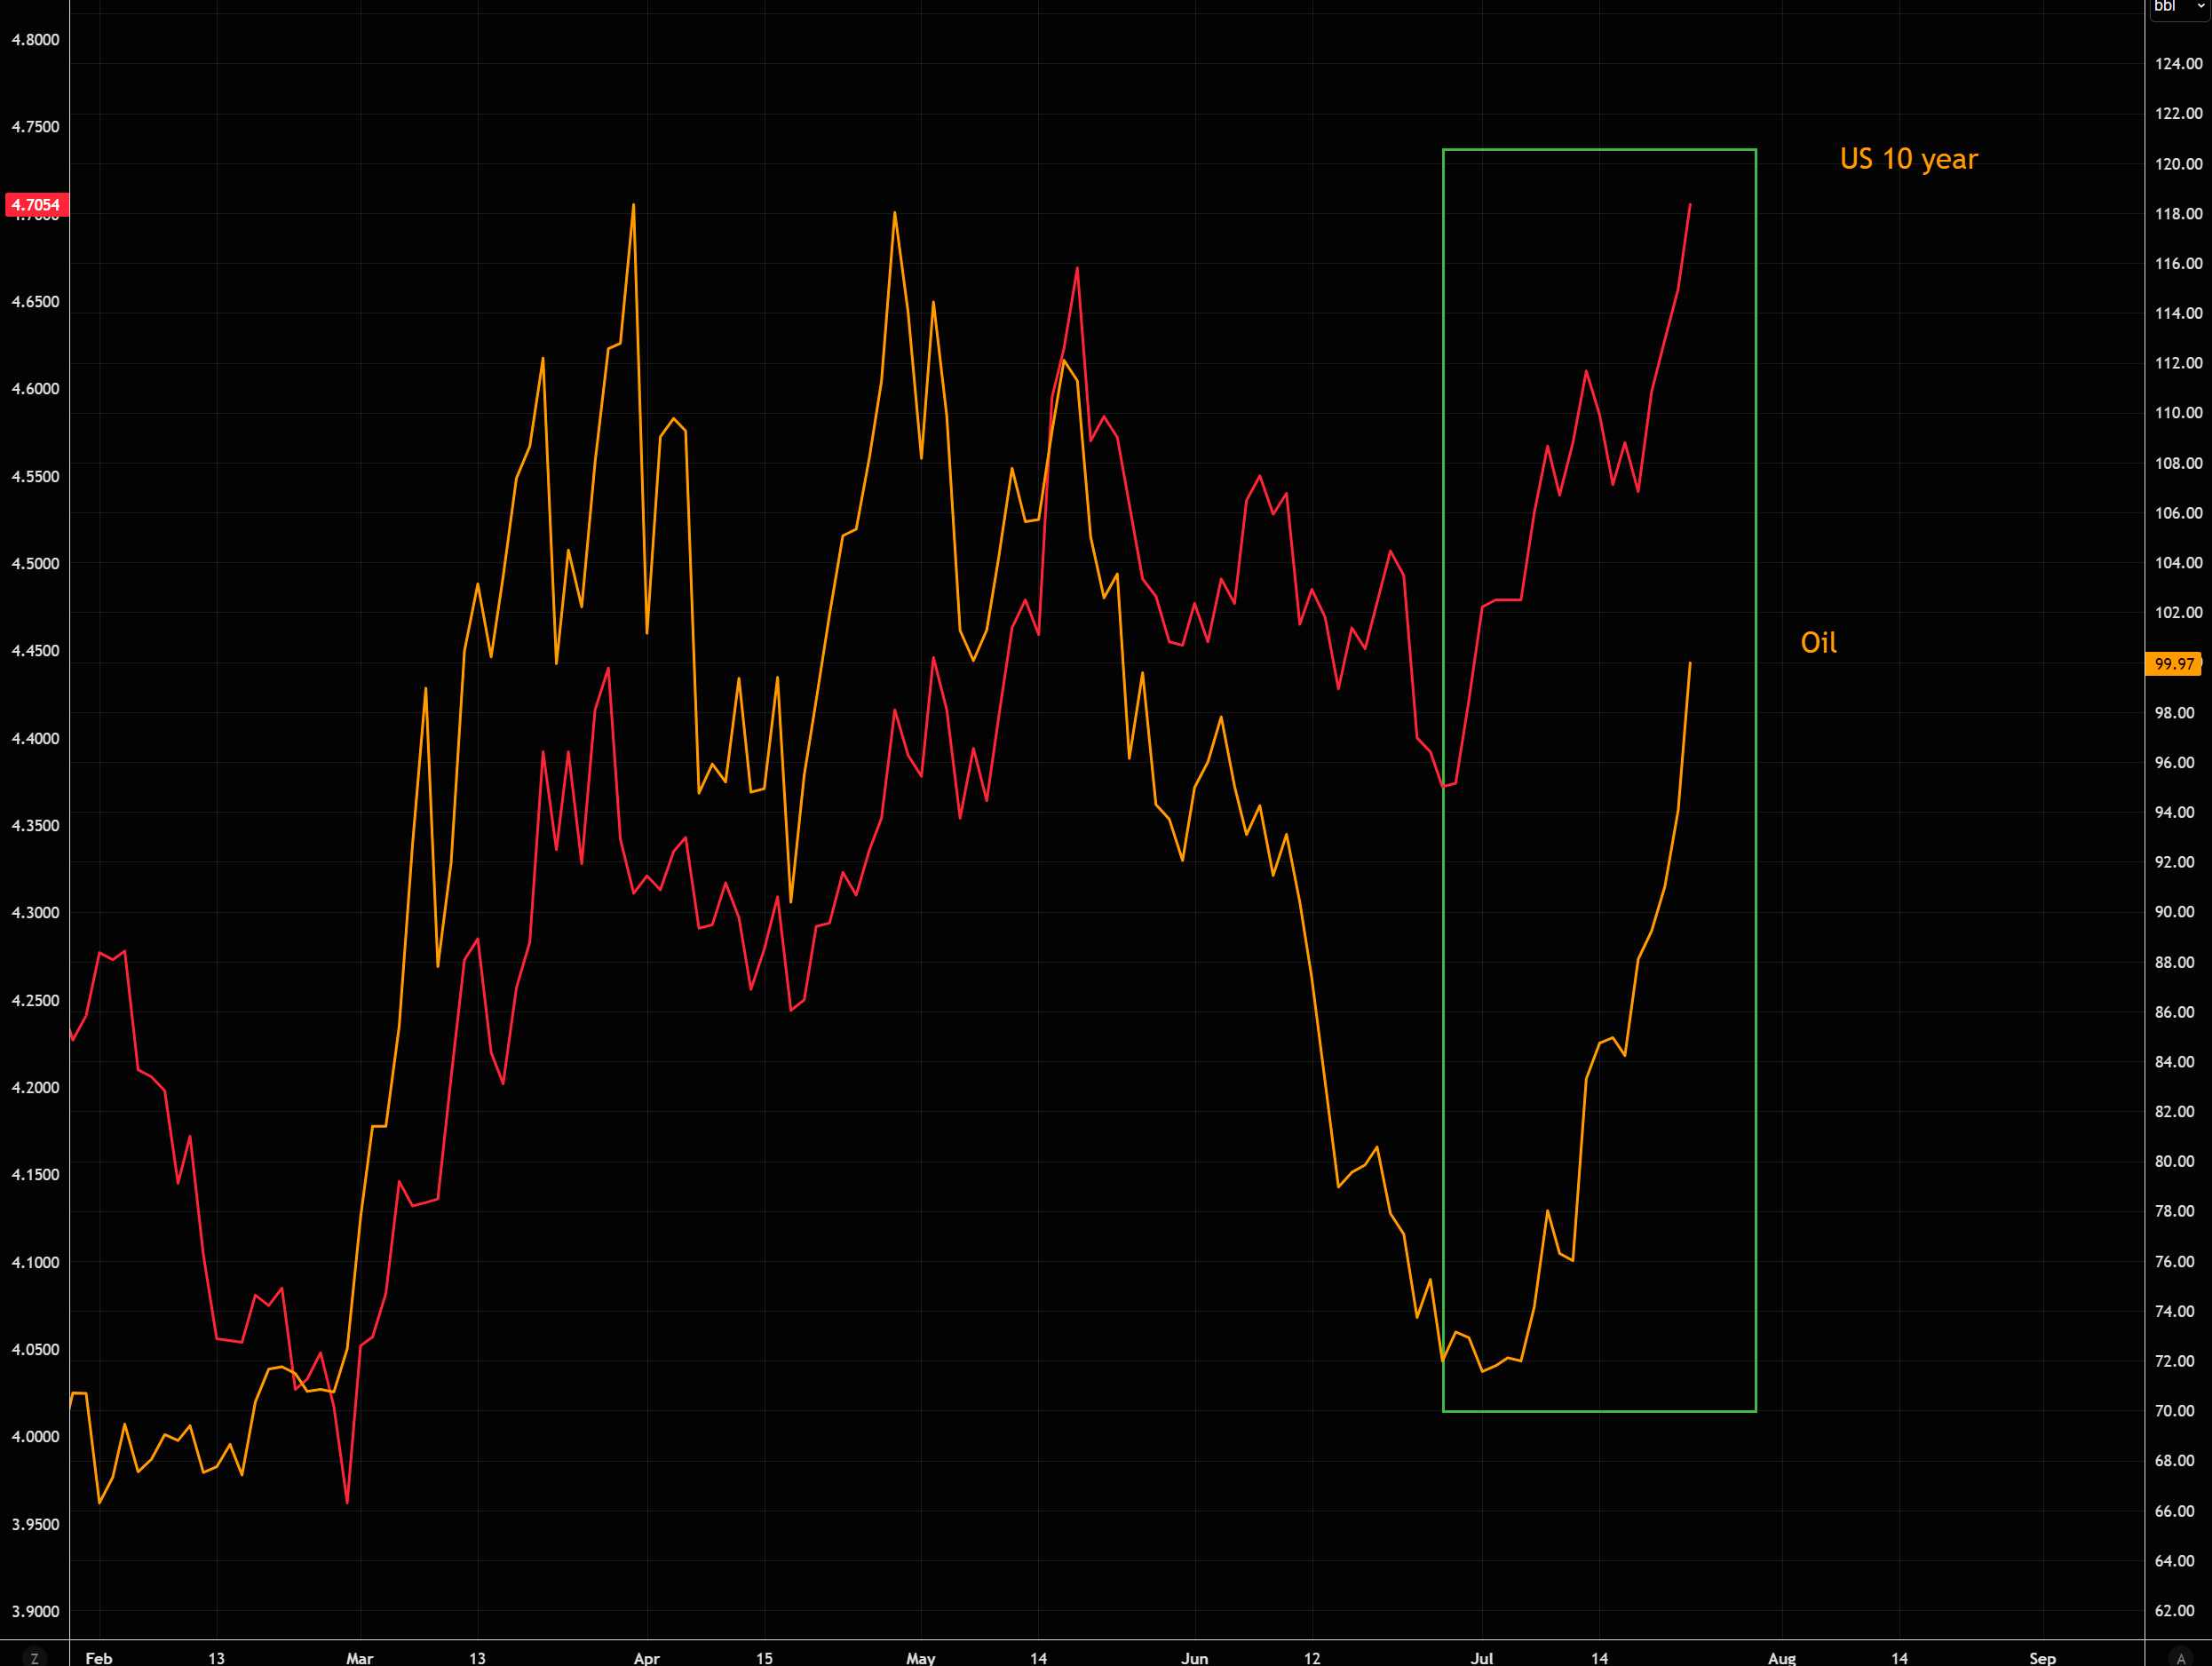
US 10 year and oil moving in perfection (again).
Rising yields, higher oil prices and weakening technicals are not yet being reflected in volatility positioning. If those pieces begin moving together, today’s orderly pullback could become considerably more disorderly.
Source: LSEG Workspace
Source: LSEG Workspace