
The stock market is driven not just by fundamentals or sentiment or technicals alone but by all of them in concert with one another. It follows then that an investor should try to incorporate each of them into her investment process in order to maximize its effectiveness.
And this is where I think many investors get lost. They try to focus on only one of these three. Fundamentals alone may work over the long run but cheap stocks can always get much cheaper in the short-term or they could just be cheap for a very good reason (I’ve learned this lesson more than a few times). Sentiment can also be very helpful but the crowd isn’t always wrong and markets can ‘stay irrational longer than you can stay solvent.’ And, as many traders know, the ‘trend is only your friend until it comes to an end.’
What I’ve found in my 20+ years of observing and trading markets is that looking at the forest, by putting all of these together, rather than the trees alone is absolutely crucial to making good decisions. So I thought it might be fun to look at the individual components of the model to see not only what they are saying about the markets but how they might be misleading when taken on their own.
For my fundamental component I use Buffett’s favorite valuation yardstick, total market capitalization-to-GDP. On its own it has roughly an 83% negative correlation with future 10-year returns in the stock market (based on 65 years worth of data). This means higher levels for this indicator are correlated with lower future returns and vice versa. Here’s what it looks like over the past 65 years or so:
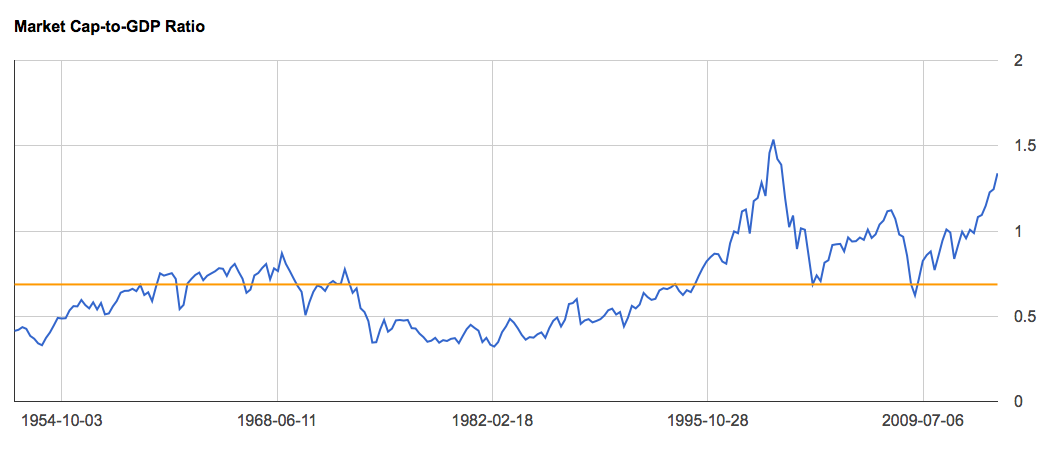 Even considering the fact that the internet bubble has pushed the average higher over the past ten or fifteen years, this measure still suggests stocks are priced significantly above their historical range. Based on its high correlation with future returns this suggests investors should expect a very low return from present levels over the next decade.
BUT… this has been the case for most of the past 20 years! An investor looking at this measure alone might have sat out a couple of major bear markets but also would have missed a couple of the most massive bull markets in history! So it’s probably not smart to use this measure in isolation. Adding other related asset classes (like bonds – we’ll come back to that) and other, unrelated indicators should help give a bit more clarity.
My sentiment measure tracks the percent of household financial assets invested in equities. Believe it or not this measure is even more highly negatively correlated with future returns than Buffett’s valuation measure above (closer to 90% – hat tip, Jesse Livermore). Here’s what it looks like over the same time frame:
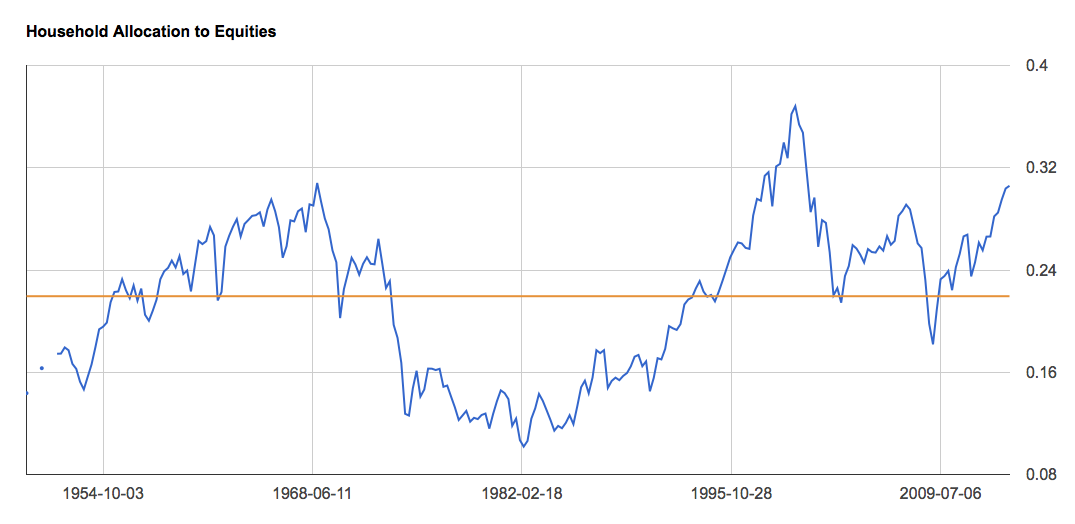 It’s also currently sitting significantly above its long run average suggesting returns should be far below average going forward. As I mentioned this is a better forecasting mechanism than the fundamental measure but even if the incredible euphoria of the internet bubble got you out of the stock market you may not have gotten back in over the past 15 years because we haven’t seen anything like the pessimism witnessed at the 1982 low.
Finally, I’ve added a third component to the model, inspired byDoug Short: a simple trend regression model based on Robert Shiller’s data going back nearly 150 years. With a negative correlation of roughly 74%, it’s not quite as effective at forecasting future returns as these other two but I think adding it, as a third independent component based on a very long-term trend, helps to make the model more robust. So here’s what the S&P 500 looks like relative to a regression trend line over the full time period:
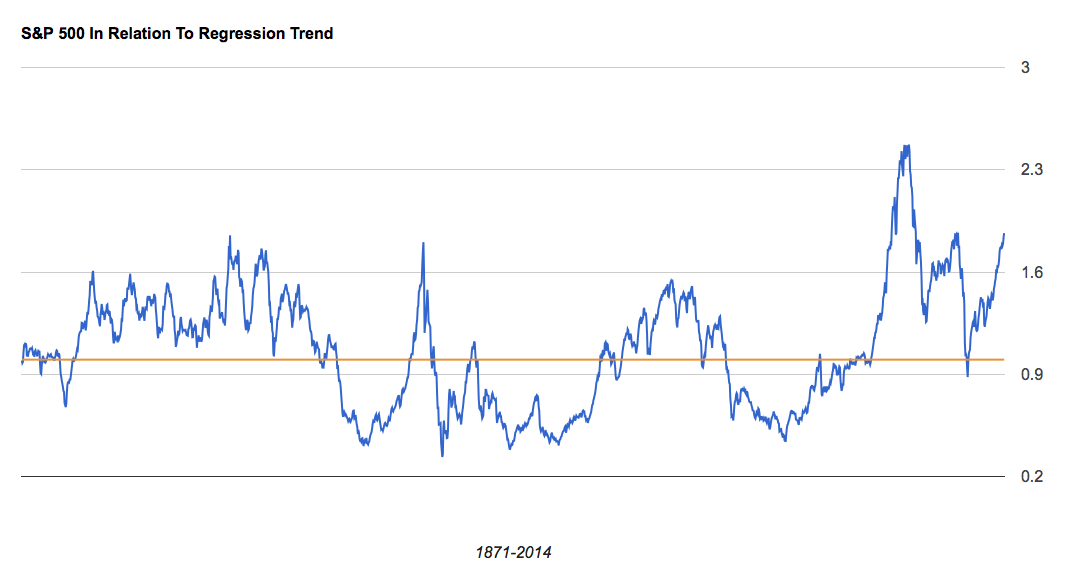 Once again this indicator shows the stock market to be trading very close to the top of its historical range. Still, like the fundamental model this one might have had you sitting out of the stock market for perhaps the past 20 years!
So even though we have three independent models we need a way to put them together and then to put them into some sort of context. What I’ve done is used each indicator individually to create a 10-year forecasting model. Then I’ve simply averaged them together each quarter. All told, the combination results in a correlation to future 10-year returns of about 90%. Here’s a chart of the model’s forecast returns as compared to actual 10-year returns for the stock market:
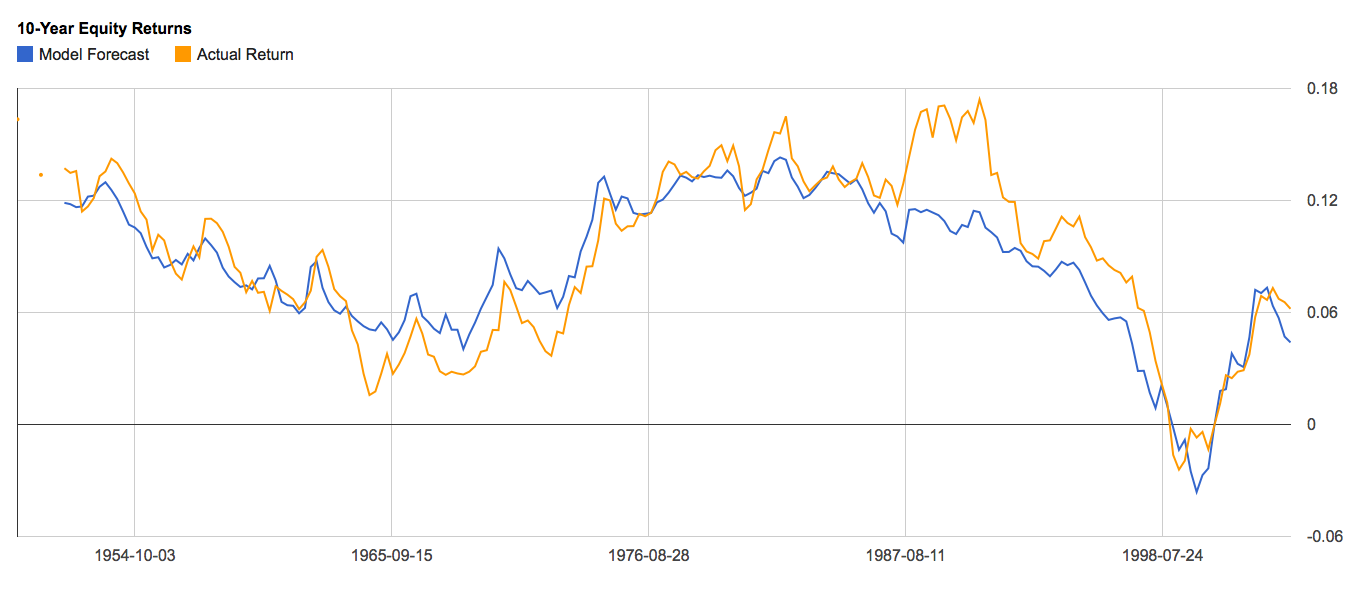 Where the model is farthest off the mark (where you see the yellow line far above the blue line) is in the late 80’s early 90’s. Stocks surged further and faster during the internet bubble than the model forecast they would. Removing those years, the model’s correlation value rises to about 94%.
So we know what the individual readings look like. What’s the model saying about future returns from here? As the chart below shows, the model forecasts a return of just 1.2% per year over the next decade:
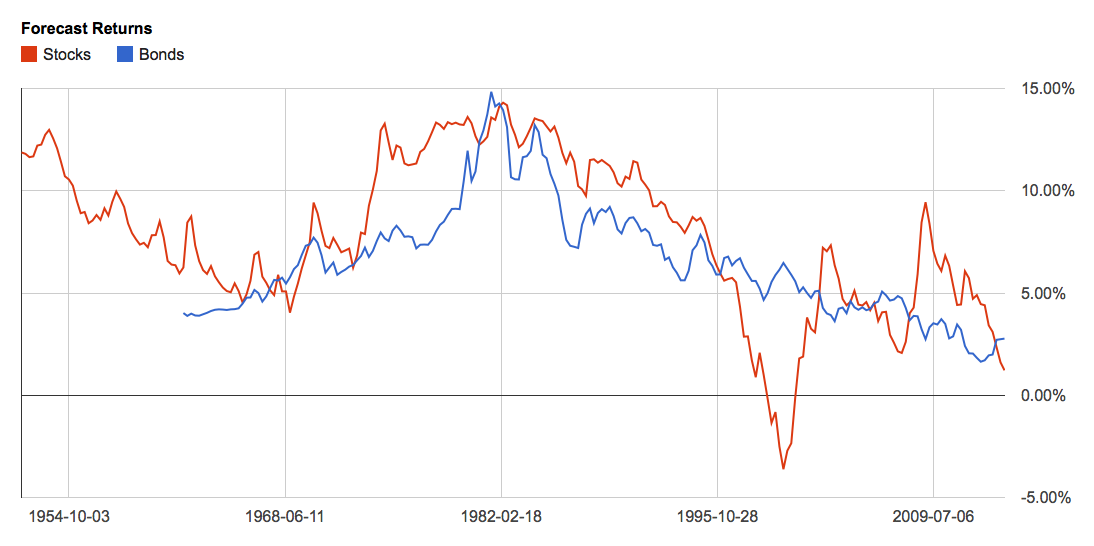 To add some context, in addition to the 10-year forecast I’ve put the yield of the 10-year treasury note on the chart, as well. Investors don’t look at potential returns in a vacuum; they compare potential returns of different opportunities, many times looking at the “risk-free” rate of treasury notes in the process. This next chart shows the difference between the model’s forecast return and the yield on the 10-year treasury note:
 When the blue line is above zero, stocks offer the better return; when it’s below, bonds do. And as I’ve shown before in “How To Time The Market Like Warren Buffett” this timing model works very well. Just buy whatever asset class is more attractive – trading only once per year – and you’ll kill a buy-and-hold approach.
I think this alone is validation of a multi-disciplinary approach. But adding one more super-simple component makes it that much more effective: before we go and sell our stocks because bonds are more attractive, we want to make sure we don’t sell too early in a bull market or buy to early in a bear market. As the chart above shows this model would have had you sell your stocks and shift into bonds all the way back in April of 1996 and then miss all the gains of the next 3 1/2 years.


