Annonce

Log ud Log ind
Log ud Log ind
Finans

Amerikanske inflation stærkt på vej nedad

Hugo Gaarden

torsdag 11. juni 2020 kl. 10:00

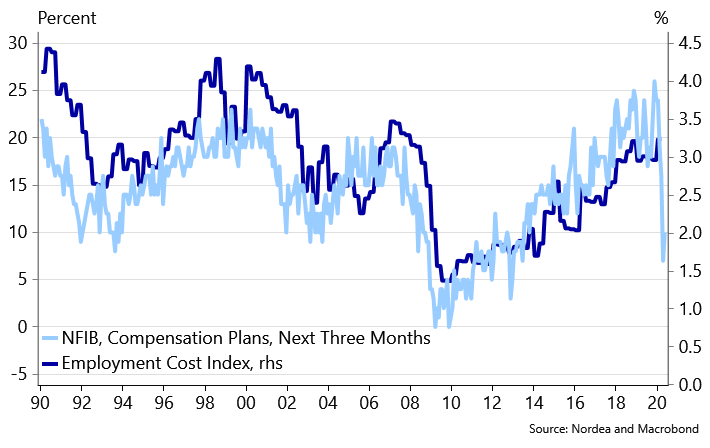
Kerneinflationen i USA faldt yderligere i maj med minus 0,45 pct. i forhold til april. Det er tredje måned i træk, at inflationen falder. Risikoen for deflation er øget. Der er også en tendens til, at lønningerne presses.

Uddrag fra Nordea:

US Macro Flash: Core CPI sets negative record

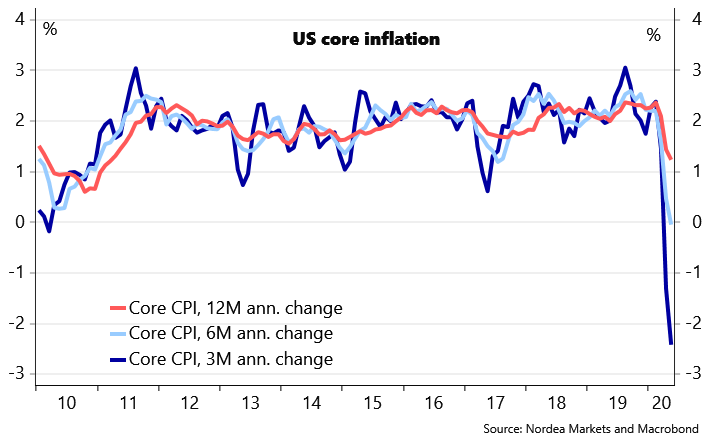
US core set yet another negative record in May, as the index declined for a third consecutive month. Deflation risks are heating uprising.

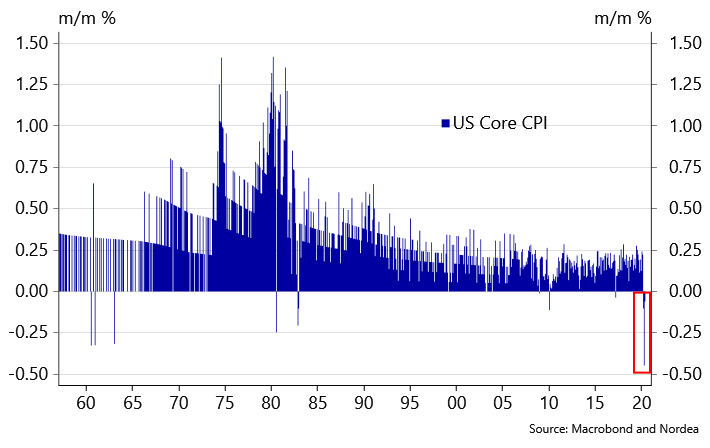
In April, a record was set as US core CPI suffered its biggest decline ever of -0.45% (with data back to 1957). That print was followed up today by a new record, as the May number showed core CPI declining for the third consecutive month. That has never happened before.

Chart 1. For the first time in history US Core CPI m/m declined three consecutive times

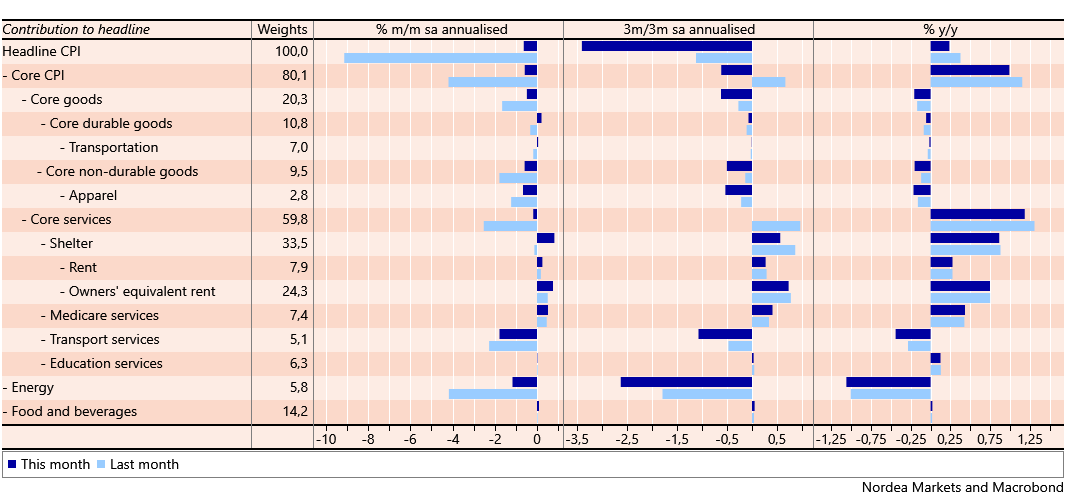
Looking at the details, core goods prices contributed more to the negative reading compared to services – the opposite pattern of the April numbers. Especially apparel and transport services continue to be a negative drivers, whereas medical services and various part of housing prices (which has been quite resilient during the corona crisis) are positive drivers.

Despite oil prices having squared some of its losses recently, the headline CPI number also declined 0.1% m/m, corresponding to a y/y reading of 0.1%.

Table 1. Dissecting the inflation numbers

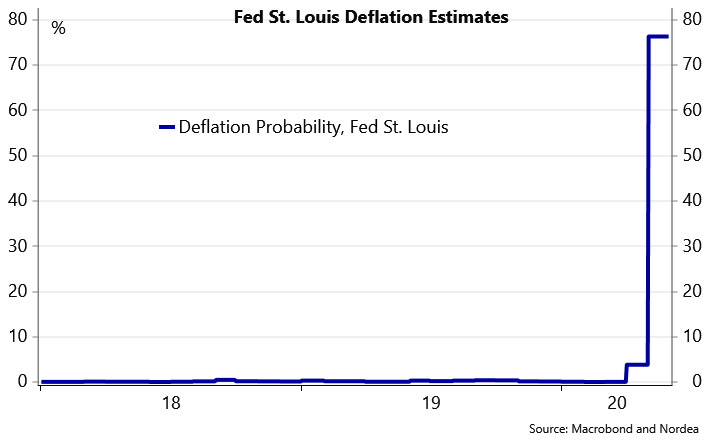
The negative readings should, in our view, be of big concern to the Fed. We will therefore also keep a close eye on how Chair Powell chooses to address the deflation risk at tonight’s FOMC meeting (Fed Preview: Finding the best forward guidance tool).

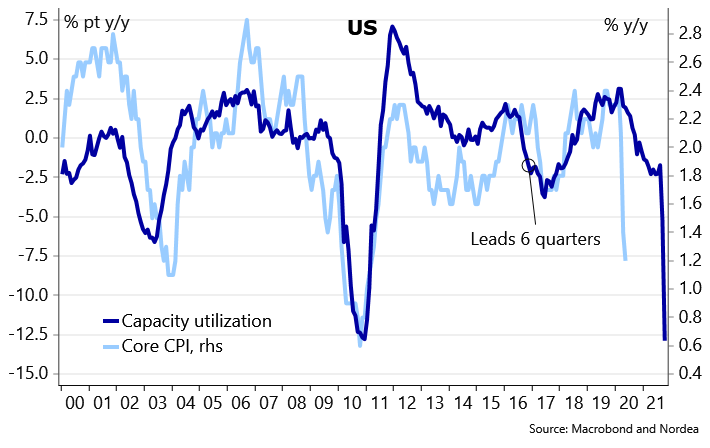
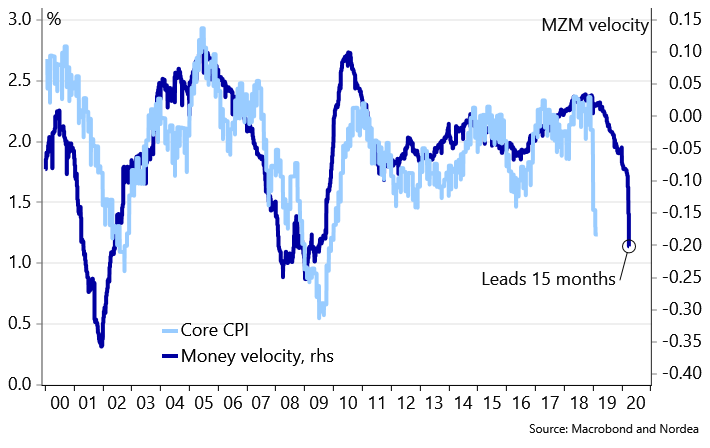
We have been flagging the risk of deflation for a while and we still see the risk as high (US: Deflation vs. hyperinflation risks). This also seems to be the conclusion from Federal Reserve St. Louis’ own deflation probability indicator which recently skyrocketed as well as other leading indicators (see charts below).

Chart 2. St. Louis Fed’s deflation probability indicator has skyrocketed
Chart 3. Indicators on wage growth are clearly pointing downwards
Chart 4. Capacity utilisation – which is a good leading indicator – is at an all-time low
Chart 5. Inflation momentum
Chart 6. Money velocity has collapsed

Tilmeld dig vores gratis nyhedsbrev
ØU Top100 Finansvirksomhed

Få de vigtigste om bank, realkredit, forsikring, pension
Udkommer hver mandag.

Jeg giver samtykke til, at I sender mig mails med de seneste historier fra Økonomisk Ugebrev. Lejlighedsvis må I gerne sende mig gode tilbud og information om events. Samtidig accepterer jeg ØU’s Privatlivspolitik.

Du kan til enhver tid afmelde dig med et enkelt klik.

[postviewcount]

Jobannoncer

CEO for Rejsekort & Rejseplan A/S
Region H
Controller/økonomimedarbejder – få den brede vifte af økonomiopgaver
Region H
Finance/Business Controller til Anzet A/S
Region Sjælland
Liftra ApS i Aalborg søger en Finance Controller med ”speciale” i Transfer Pricing
Region Nordjylland

Mere fra ØU Finans

Log ind

Har du ikke allerede en bruger? Opret dig her.

FÅ VORES STORE NYTÅRSUDGAVE AF FORMUE

Her er de 10 bedste aktier i 2022

Tilbuddet udløber om:
dage
timer
min.
sek.

Analyse af og prognoser for Fixed Income (statsrenter og realkreditrenter)

Direkte adgang til opdaterede analyser fra toneangivende finanshuse:

Goldman Sachs

Fidelity

Danske Bank

Morgan Stanley

ABN Amro

Jyske Bank

UBS

SEB

Natixis

Handelsbanken

Merril Lynch 

Direkte adgang til realkreditinstitutternes renteprognoser:

Nykredit

Realkredit Danmark

Nordea

Analyse og prognoser for kort rente, samt for centralbankernes politikker

Links:

RBC

Capital Economics

Yardeni – Central Bank Balance Sheet 

Investing.com: FED Watch Monitor Tool

Nordea

Scotiabank