Deutsche Bank: “The great tech reset” – er tech-aktierne sat nok ned nu?
Morten W. Langer
tirsdag 27. oktober 2026 kl. 8:24
Uddrag fra Deutsche Bank og Nomura
The great tech reset
The tech unwind continues, but the really interesting story is what is happening beneath the surface. Positioning has collapsed, volatility has exploded, and credit is flashing increasingly uncomfortable signals, even as the headline indices remain relatively resilient. From Deutsche Bank’s perfectly timed tech downgrade to the potential for another $225 billion in forced selling, today’s wrap looks at a market where the risks are becoming harder to ignore.
DB nailed the tech unwind. Now what?
Credit where it’s due. On October 9, Deutsche Bank’s Binky Chadha and team tactically downgraded tech from overweight to neutral, warning of an unfavorable risk/reward setup and a potential sharp reversal.
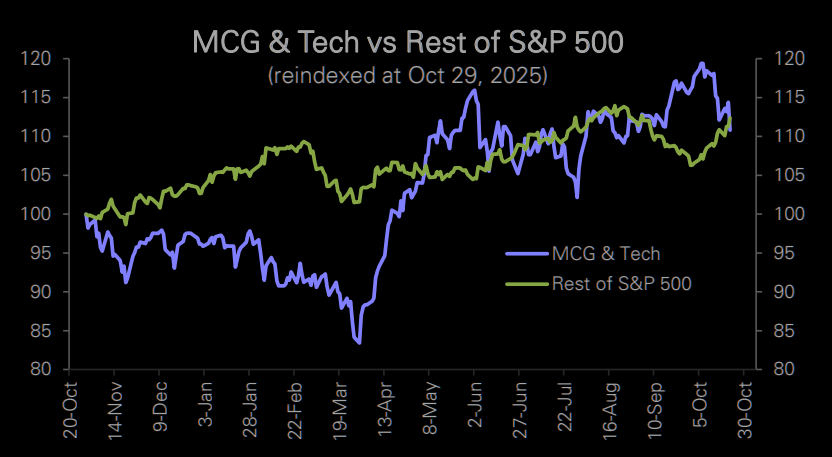
The timing was excellent. Mega-cap growth and tech have since fallen 7%, while the rest of the S&P 500 has gained 5%. That’s 12 percentage points of underperformance in just two weeks.
The interesting question now is whether the unwind has gone far enough.
DB
Not quite there yet
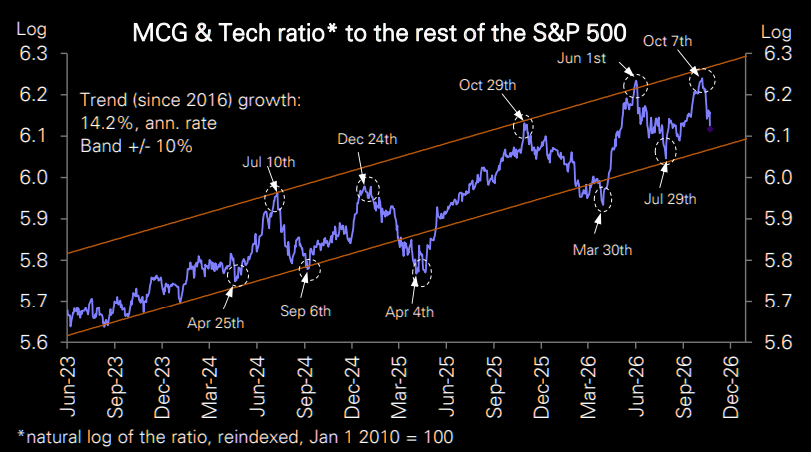
Despite the violent rotation, DB estimates tech has another roughly 5% of relative downside before reaching the bottom of its long-term trend channel. That lower boundary has provided support on several previous occasions. The unwind has been brutal, but the technical reset may not be quite complete.
DB
The great positioning reset
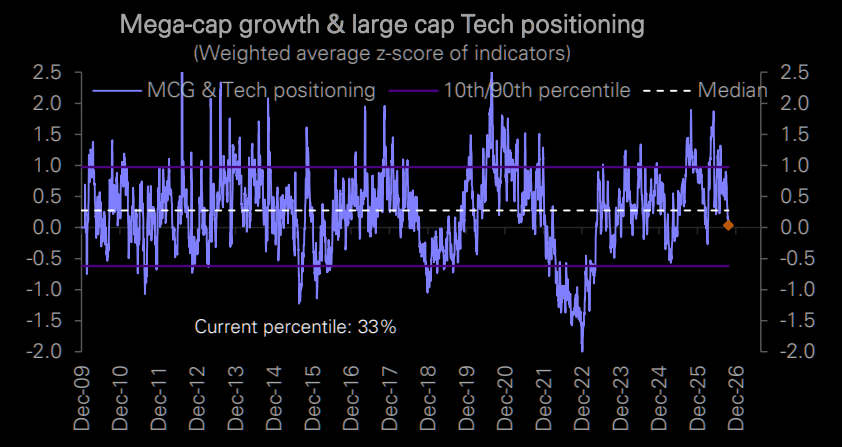
From crowded to neutral in just two weeks. DB estimates mega-cap growth and tech positioning has collapsed from the 85th percentile in early October to the 33rd percentile, the lowest in six months and approaching the lows seen during the Iran-war selloff. Whatever happens next, this is no longer the same positioning setup that existed when DB sounded the alarm.
DB
Still stuck
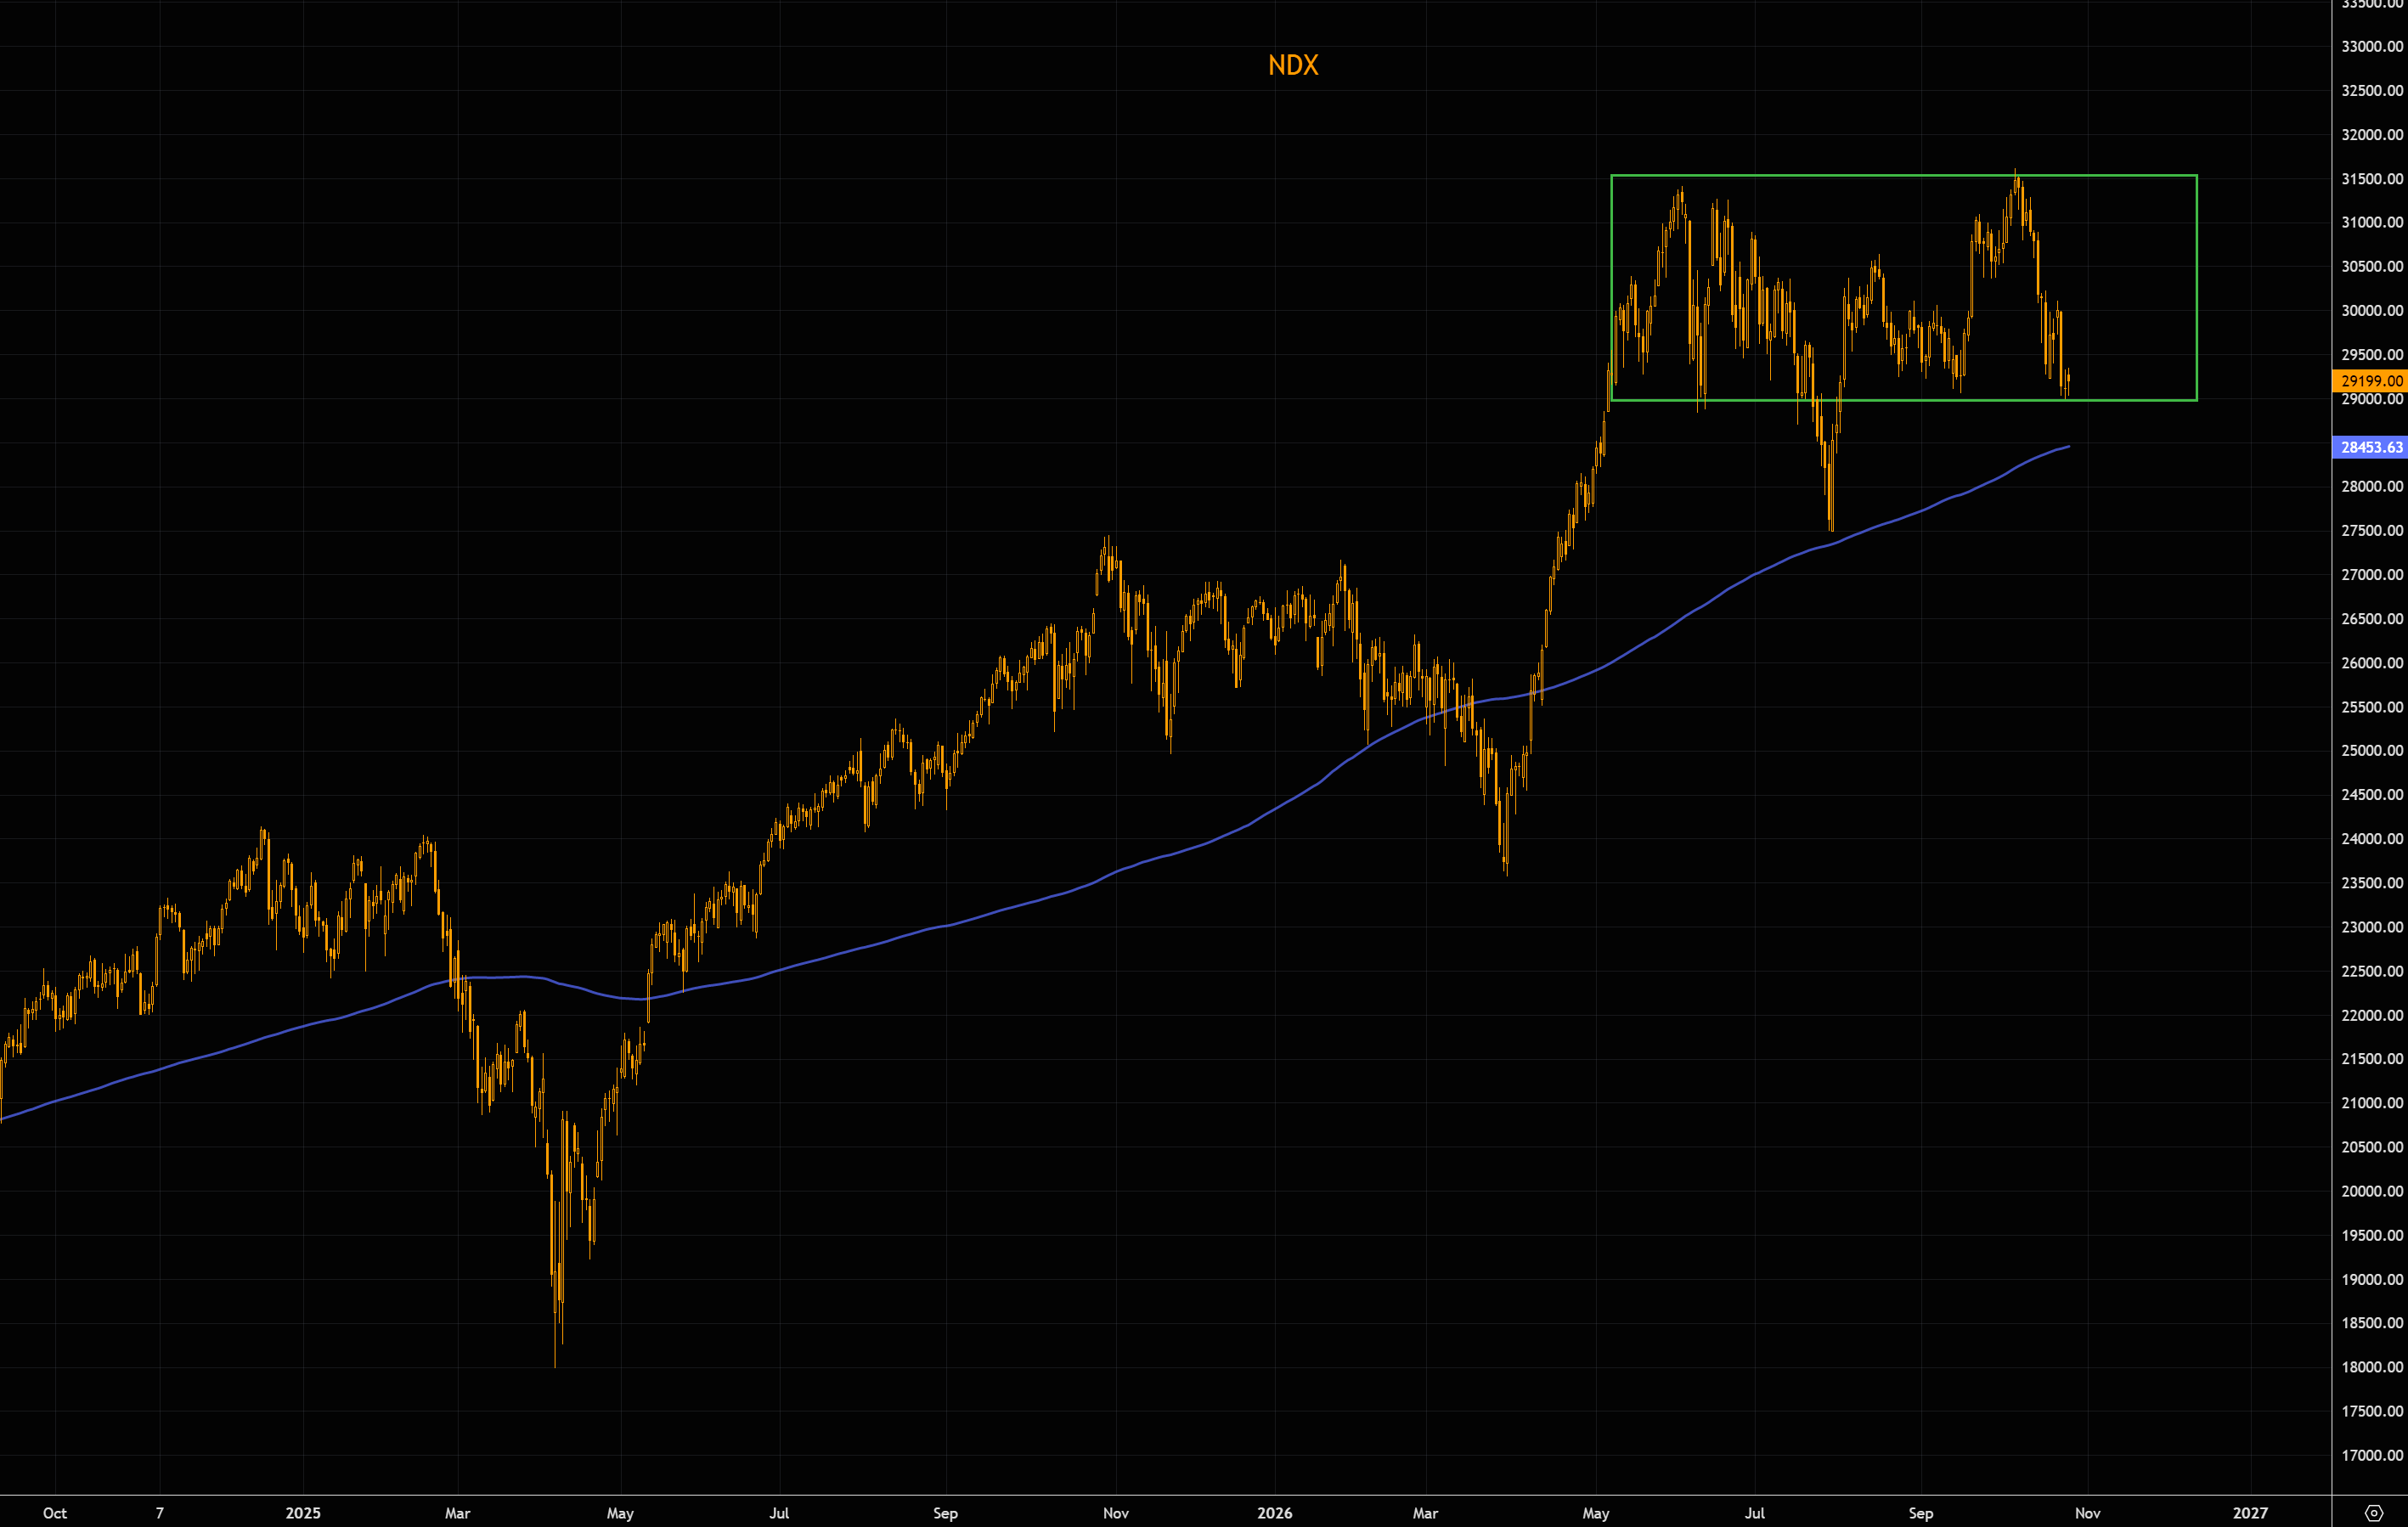
NDX remains stuck in the range that has been in place since May, despite all the narratives thrown at this market. 29k in futures remains the make-or-break level, with the 200-day moving average sitting just below at around 28,500.
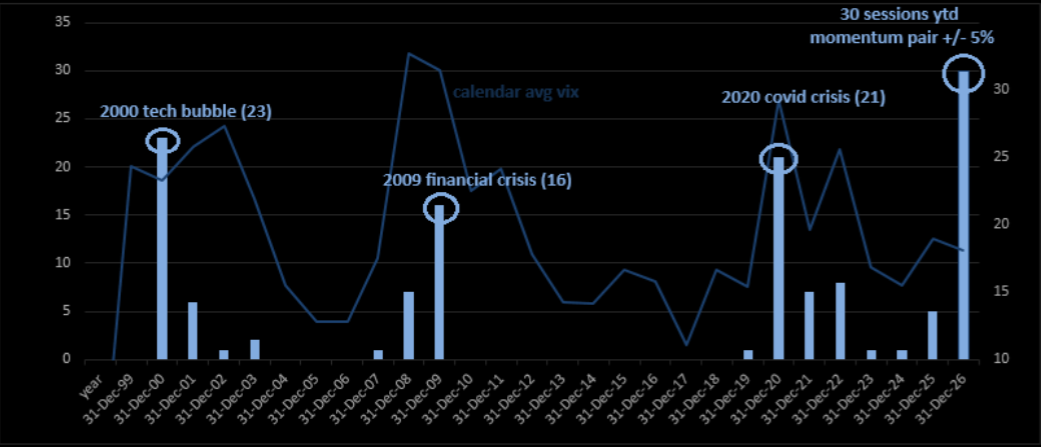
As GS’s Garrett points out, few charts capture trader exhaustion better than the extreme moves in the GS Momentum basket. The basket has recorded 30 daily moves of more than 5% in either direction in 2026, exceeding every other year in the dataset, including 2000, 2009 and 2020. And there are still two months left in the year.
GS
Tech fear repriced
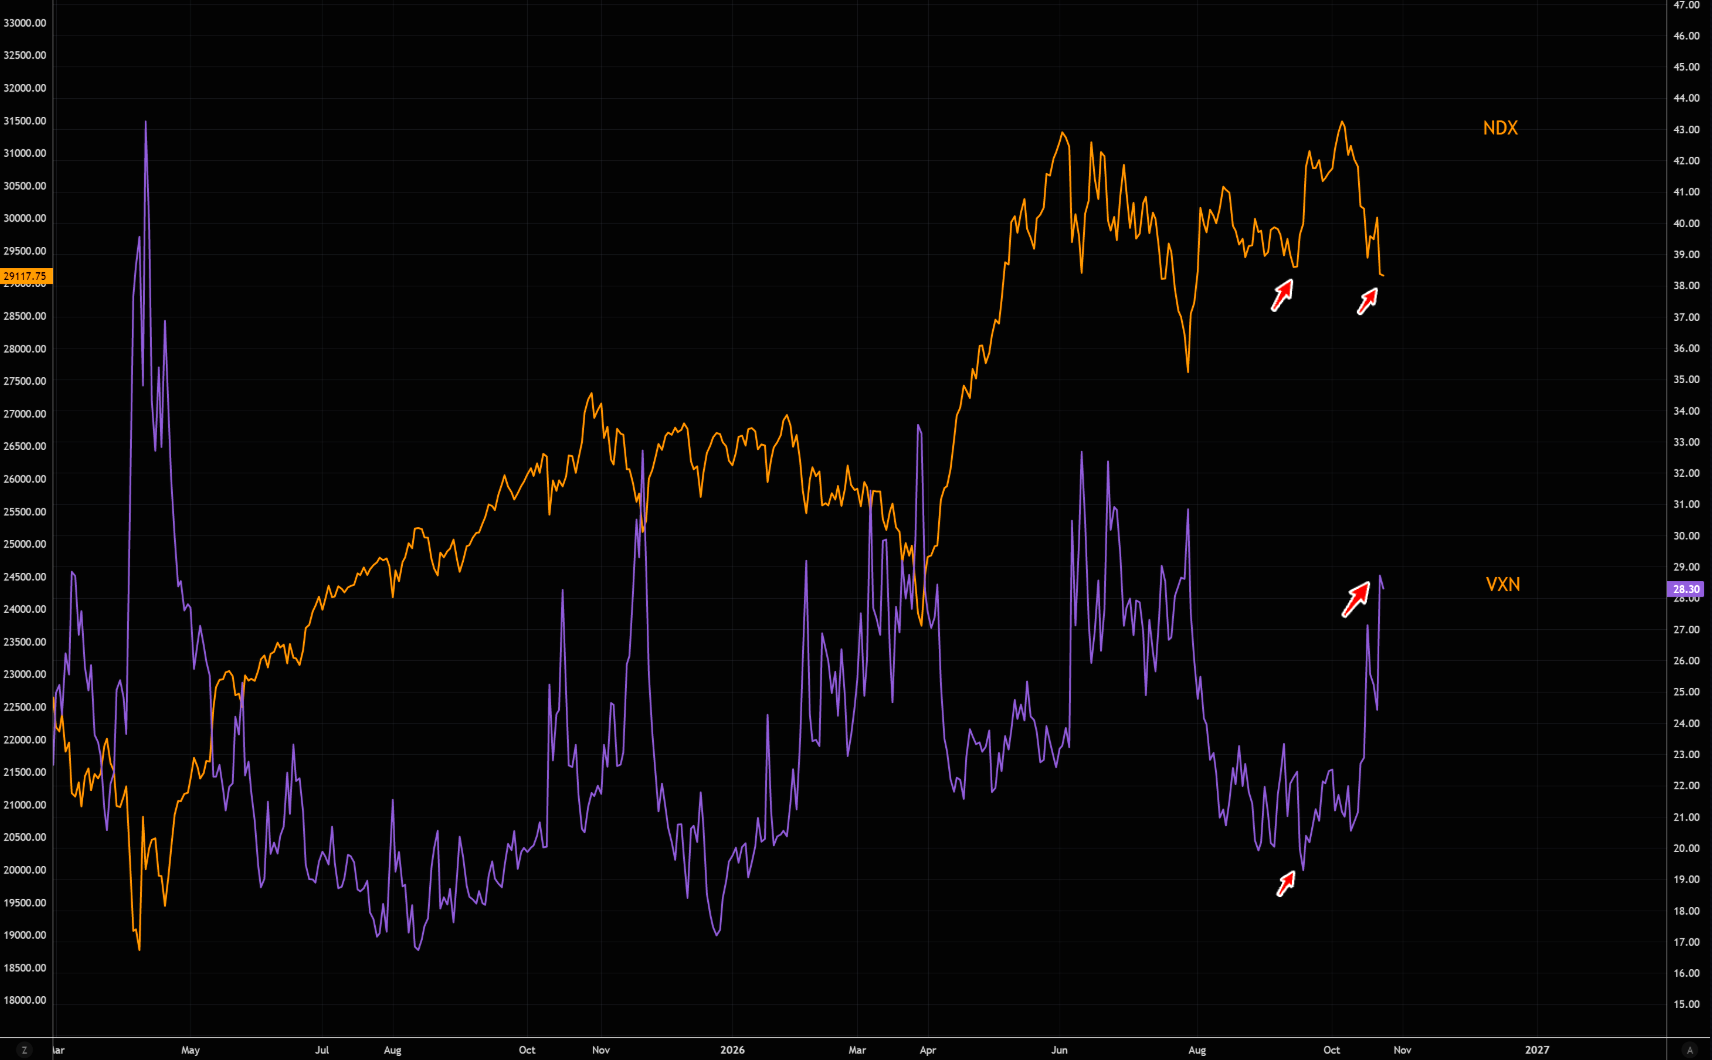
What a difference a month makes. Back in mid-September, tech volatility was depressed, with VXN hovering around 20 despite NDX trading at roughly the same levels as today. Fast forward to now, and VXN is near 28, with NDX essentially unchanged. Same index level, 40% higher implied volatility.
LSEG Workspace
Volatility meets credit
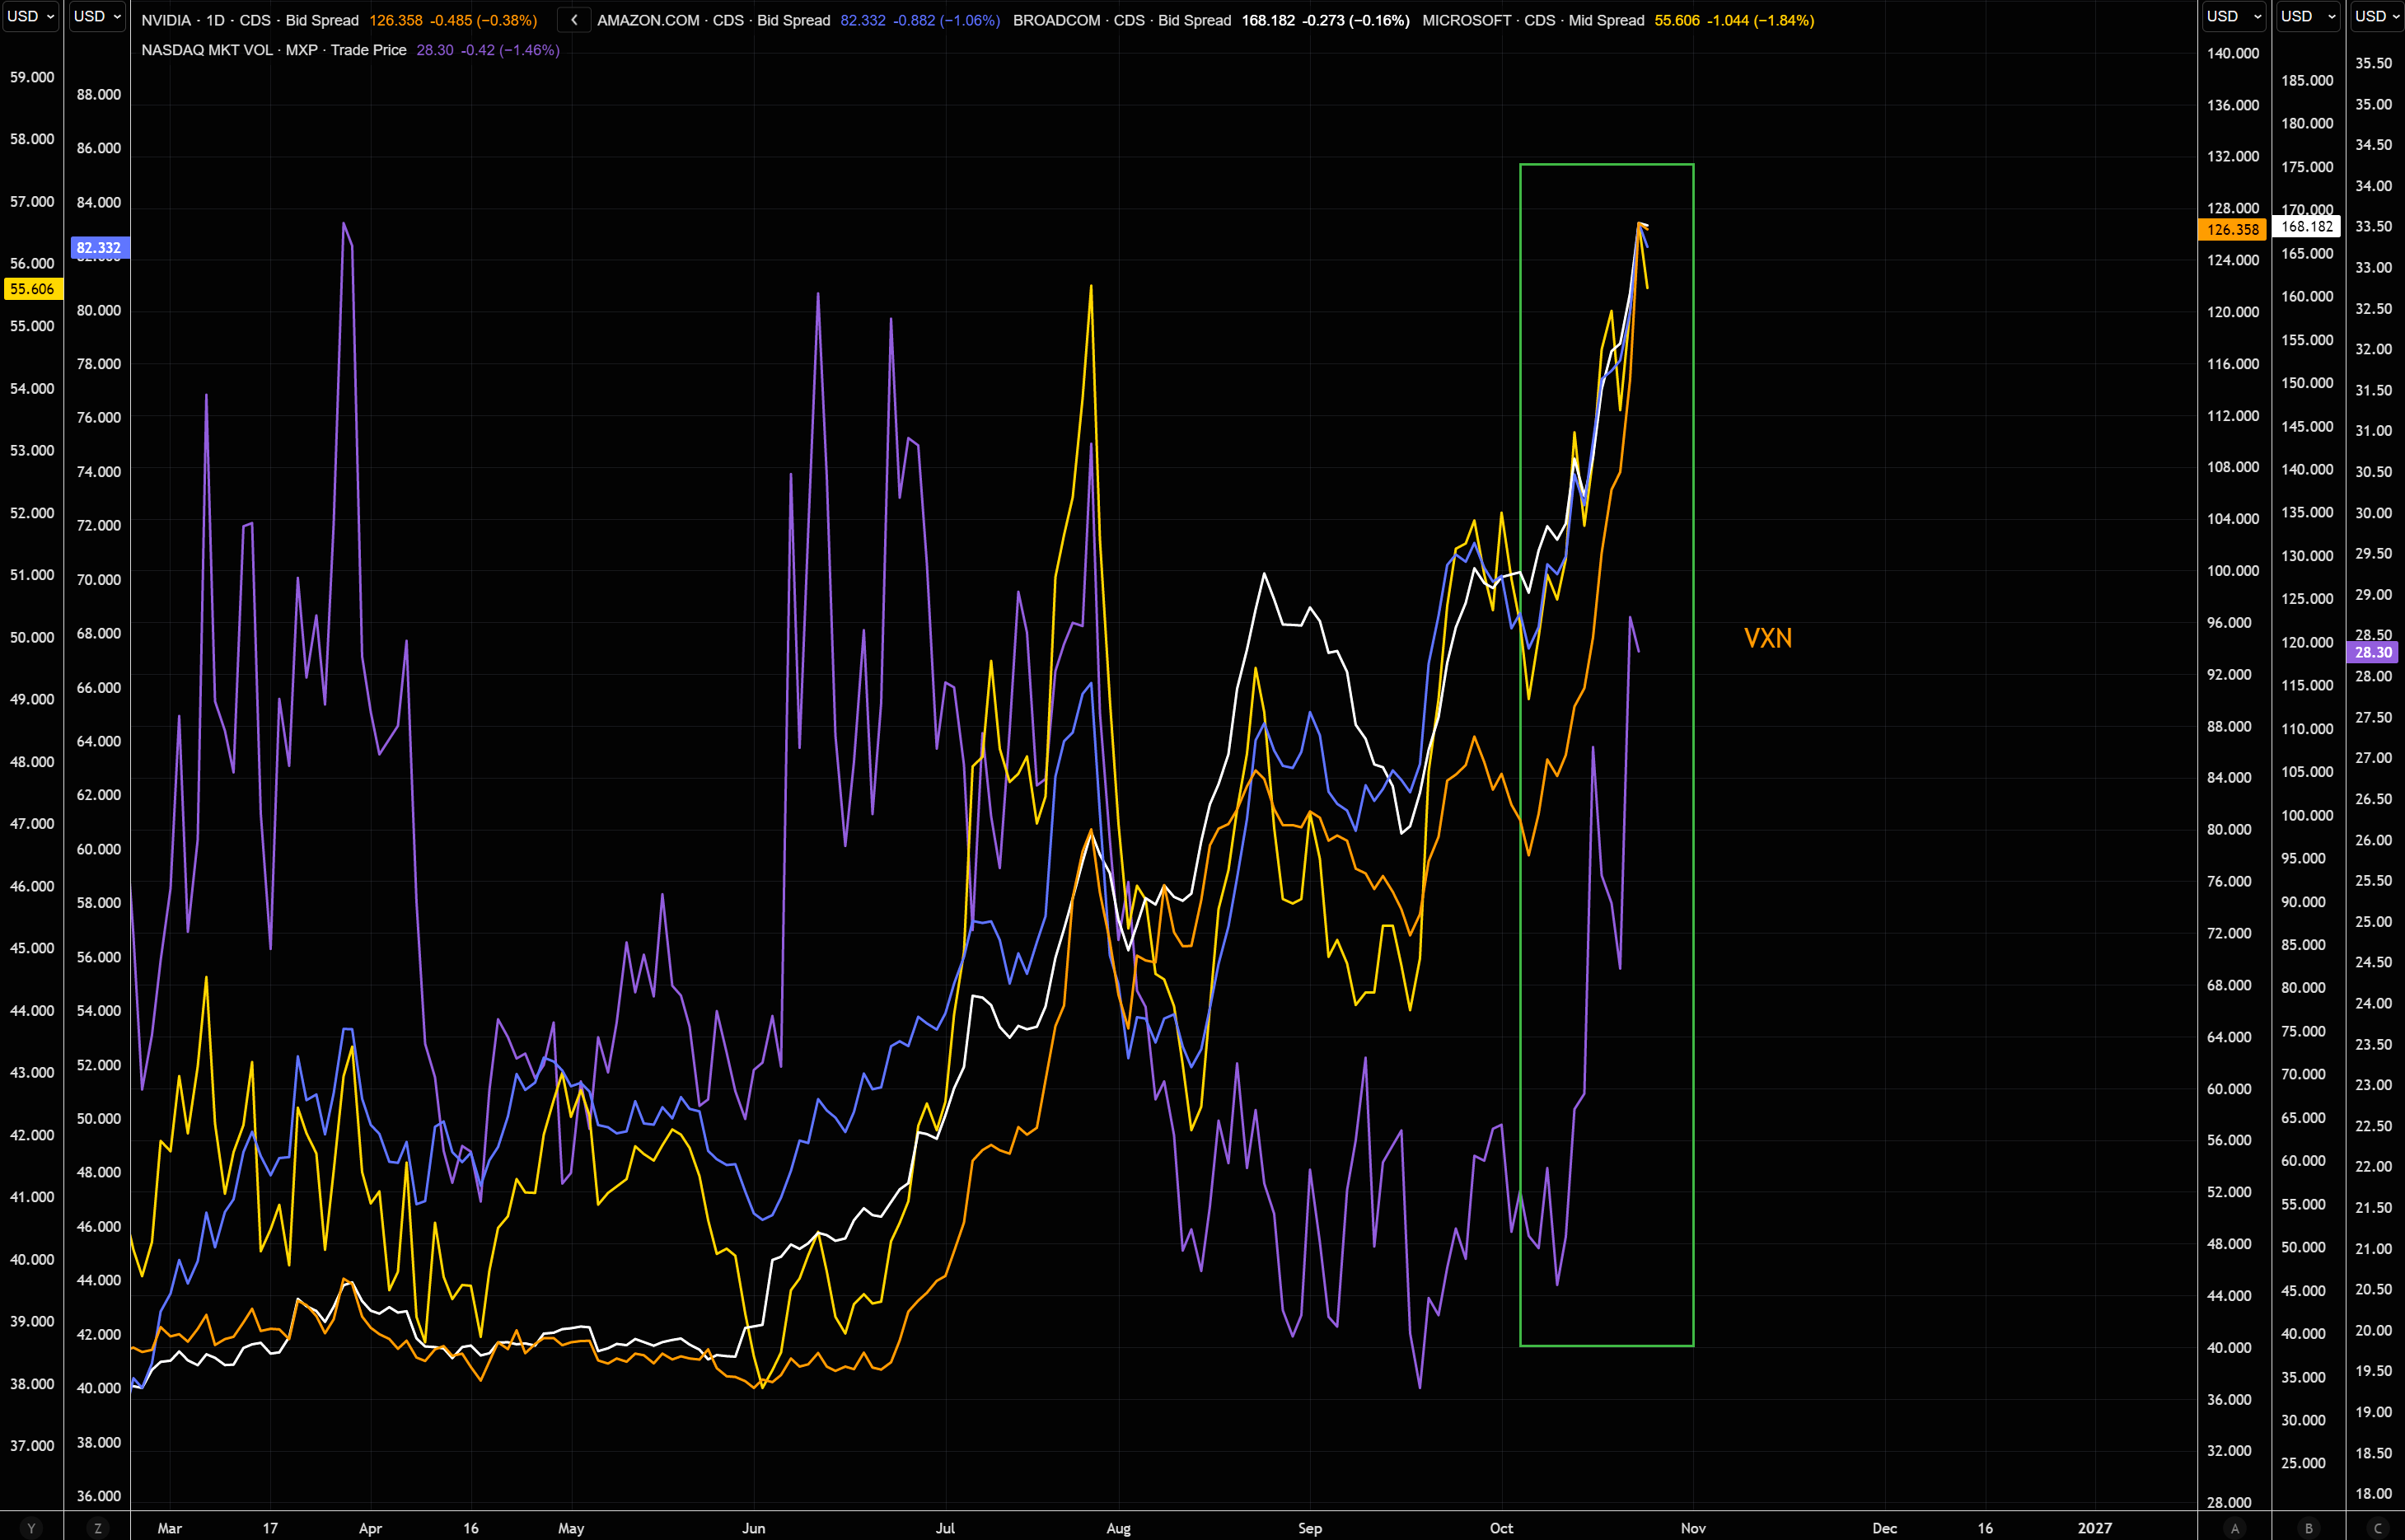
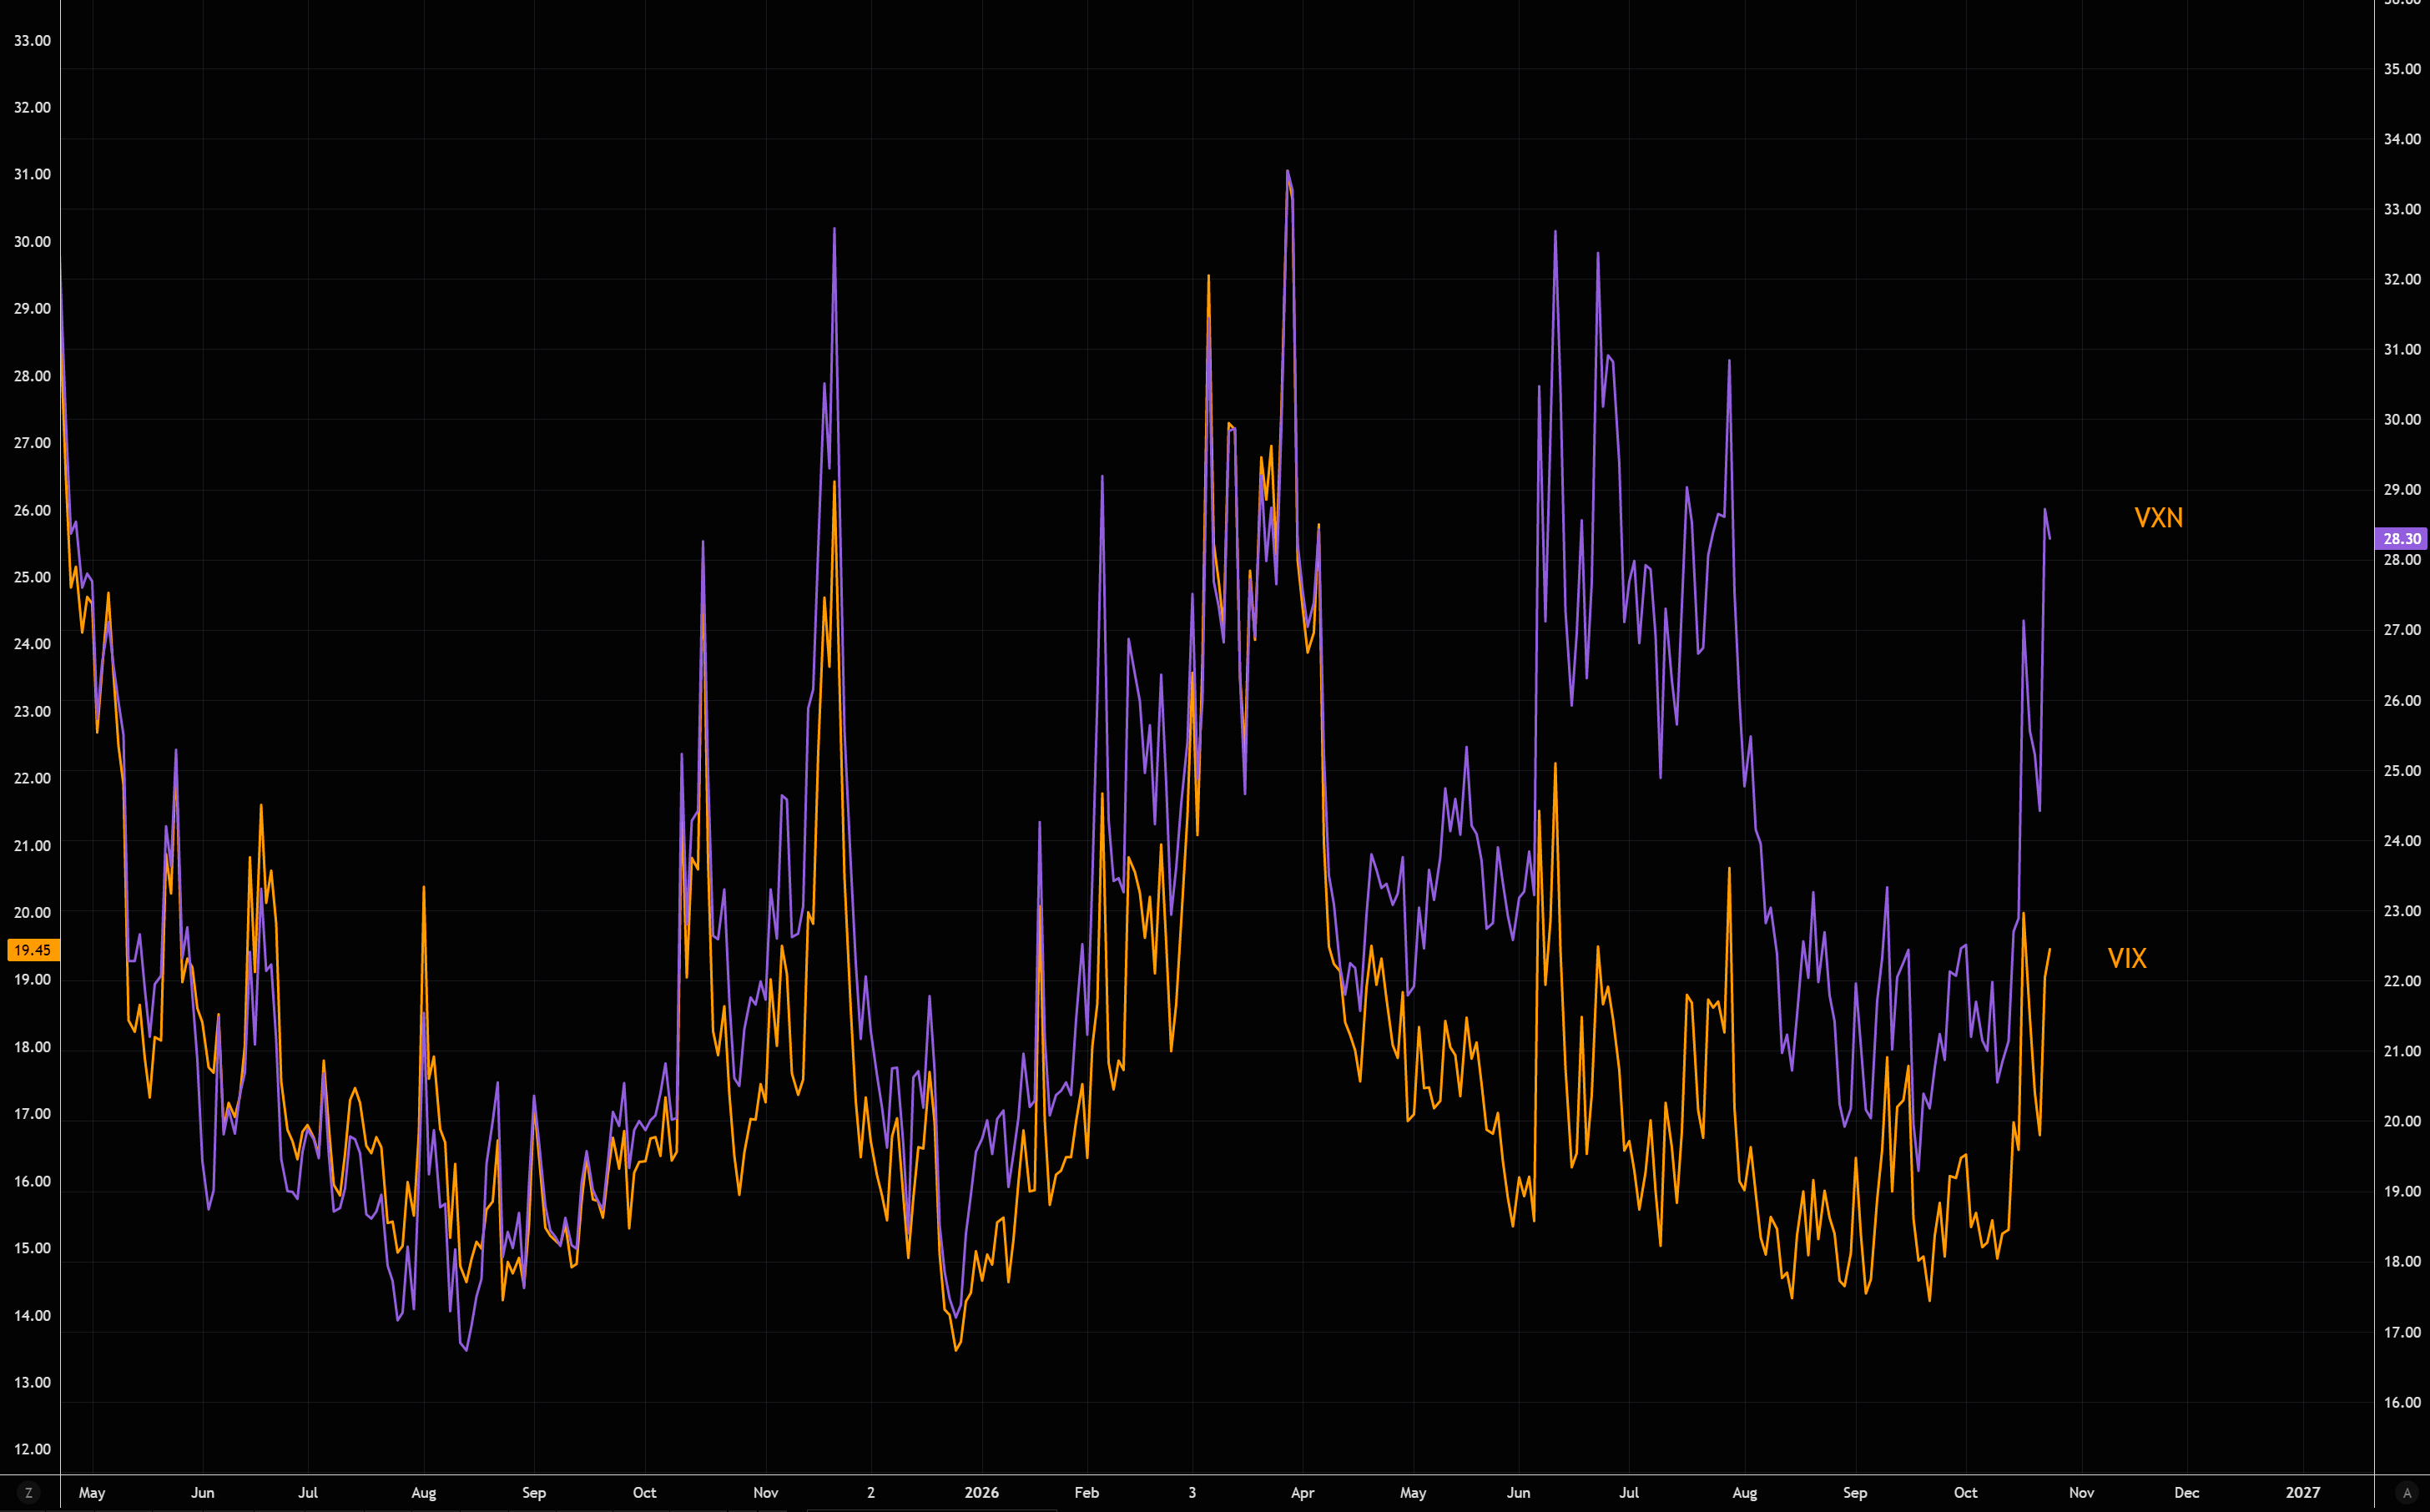
Tech volatility has exploded higher alongside widening CDS spreads, with VXN significantly outperforming VIX.
LSEG Workspace
Déjà vu, July
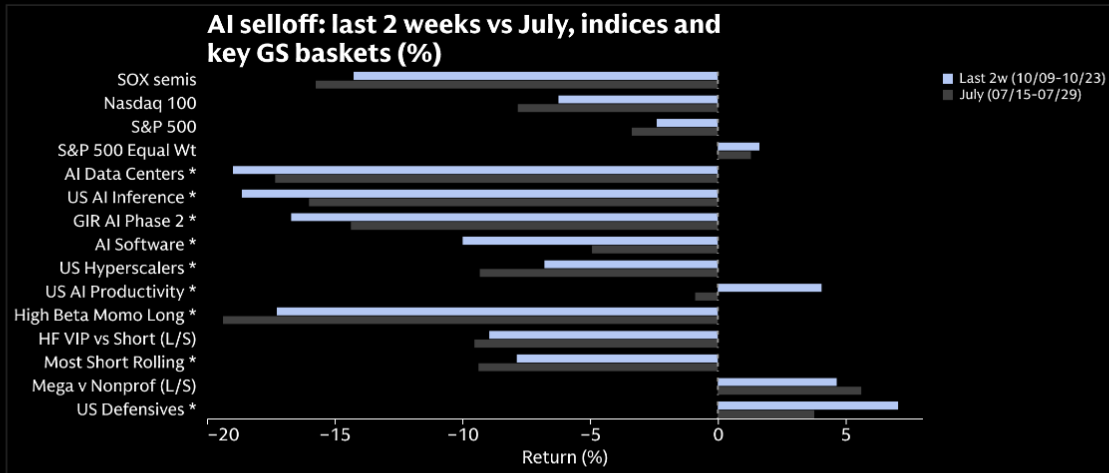
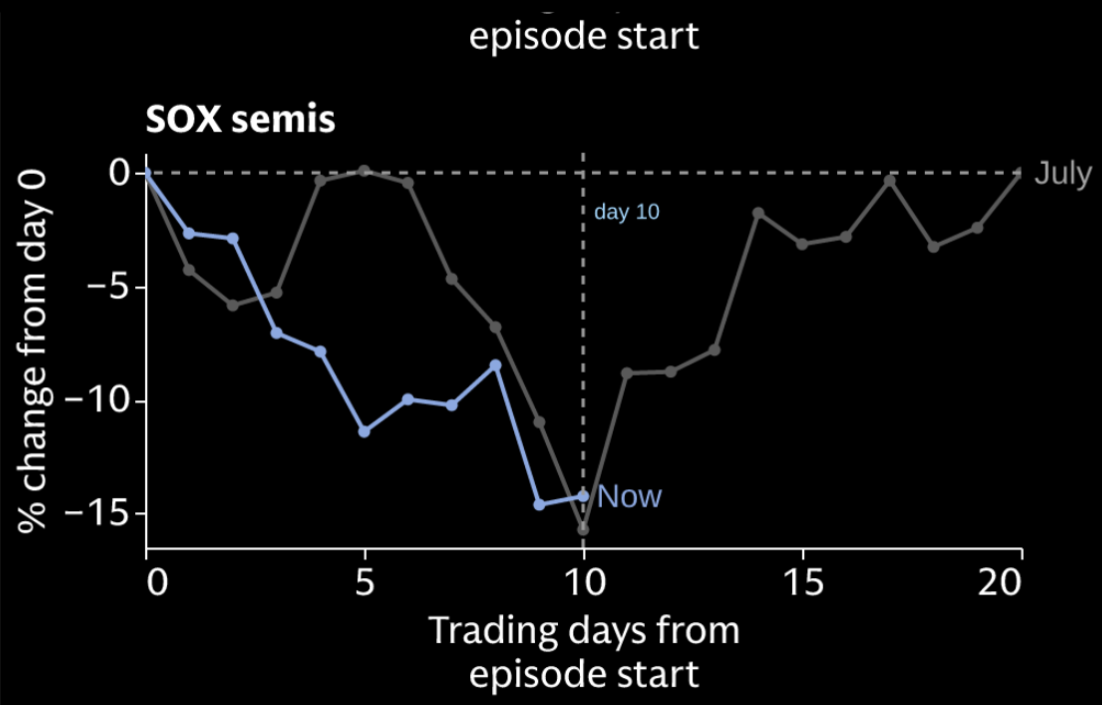
GS notes striking similarities between last week’s tech unwind and July’s selloff. Some $20bn of TMT has been sold over the past two weeks, approaching July’s $23bn. The hardest-hit trades have seen almost identical moves, but SPX has fallen just 2.4% versus 3.4% in July. AI stocks are increasingly moving together, yet index volatility remains relatively contained.
GS
GS
The cybersecurity bull lives on
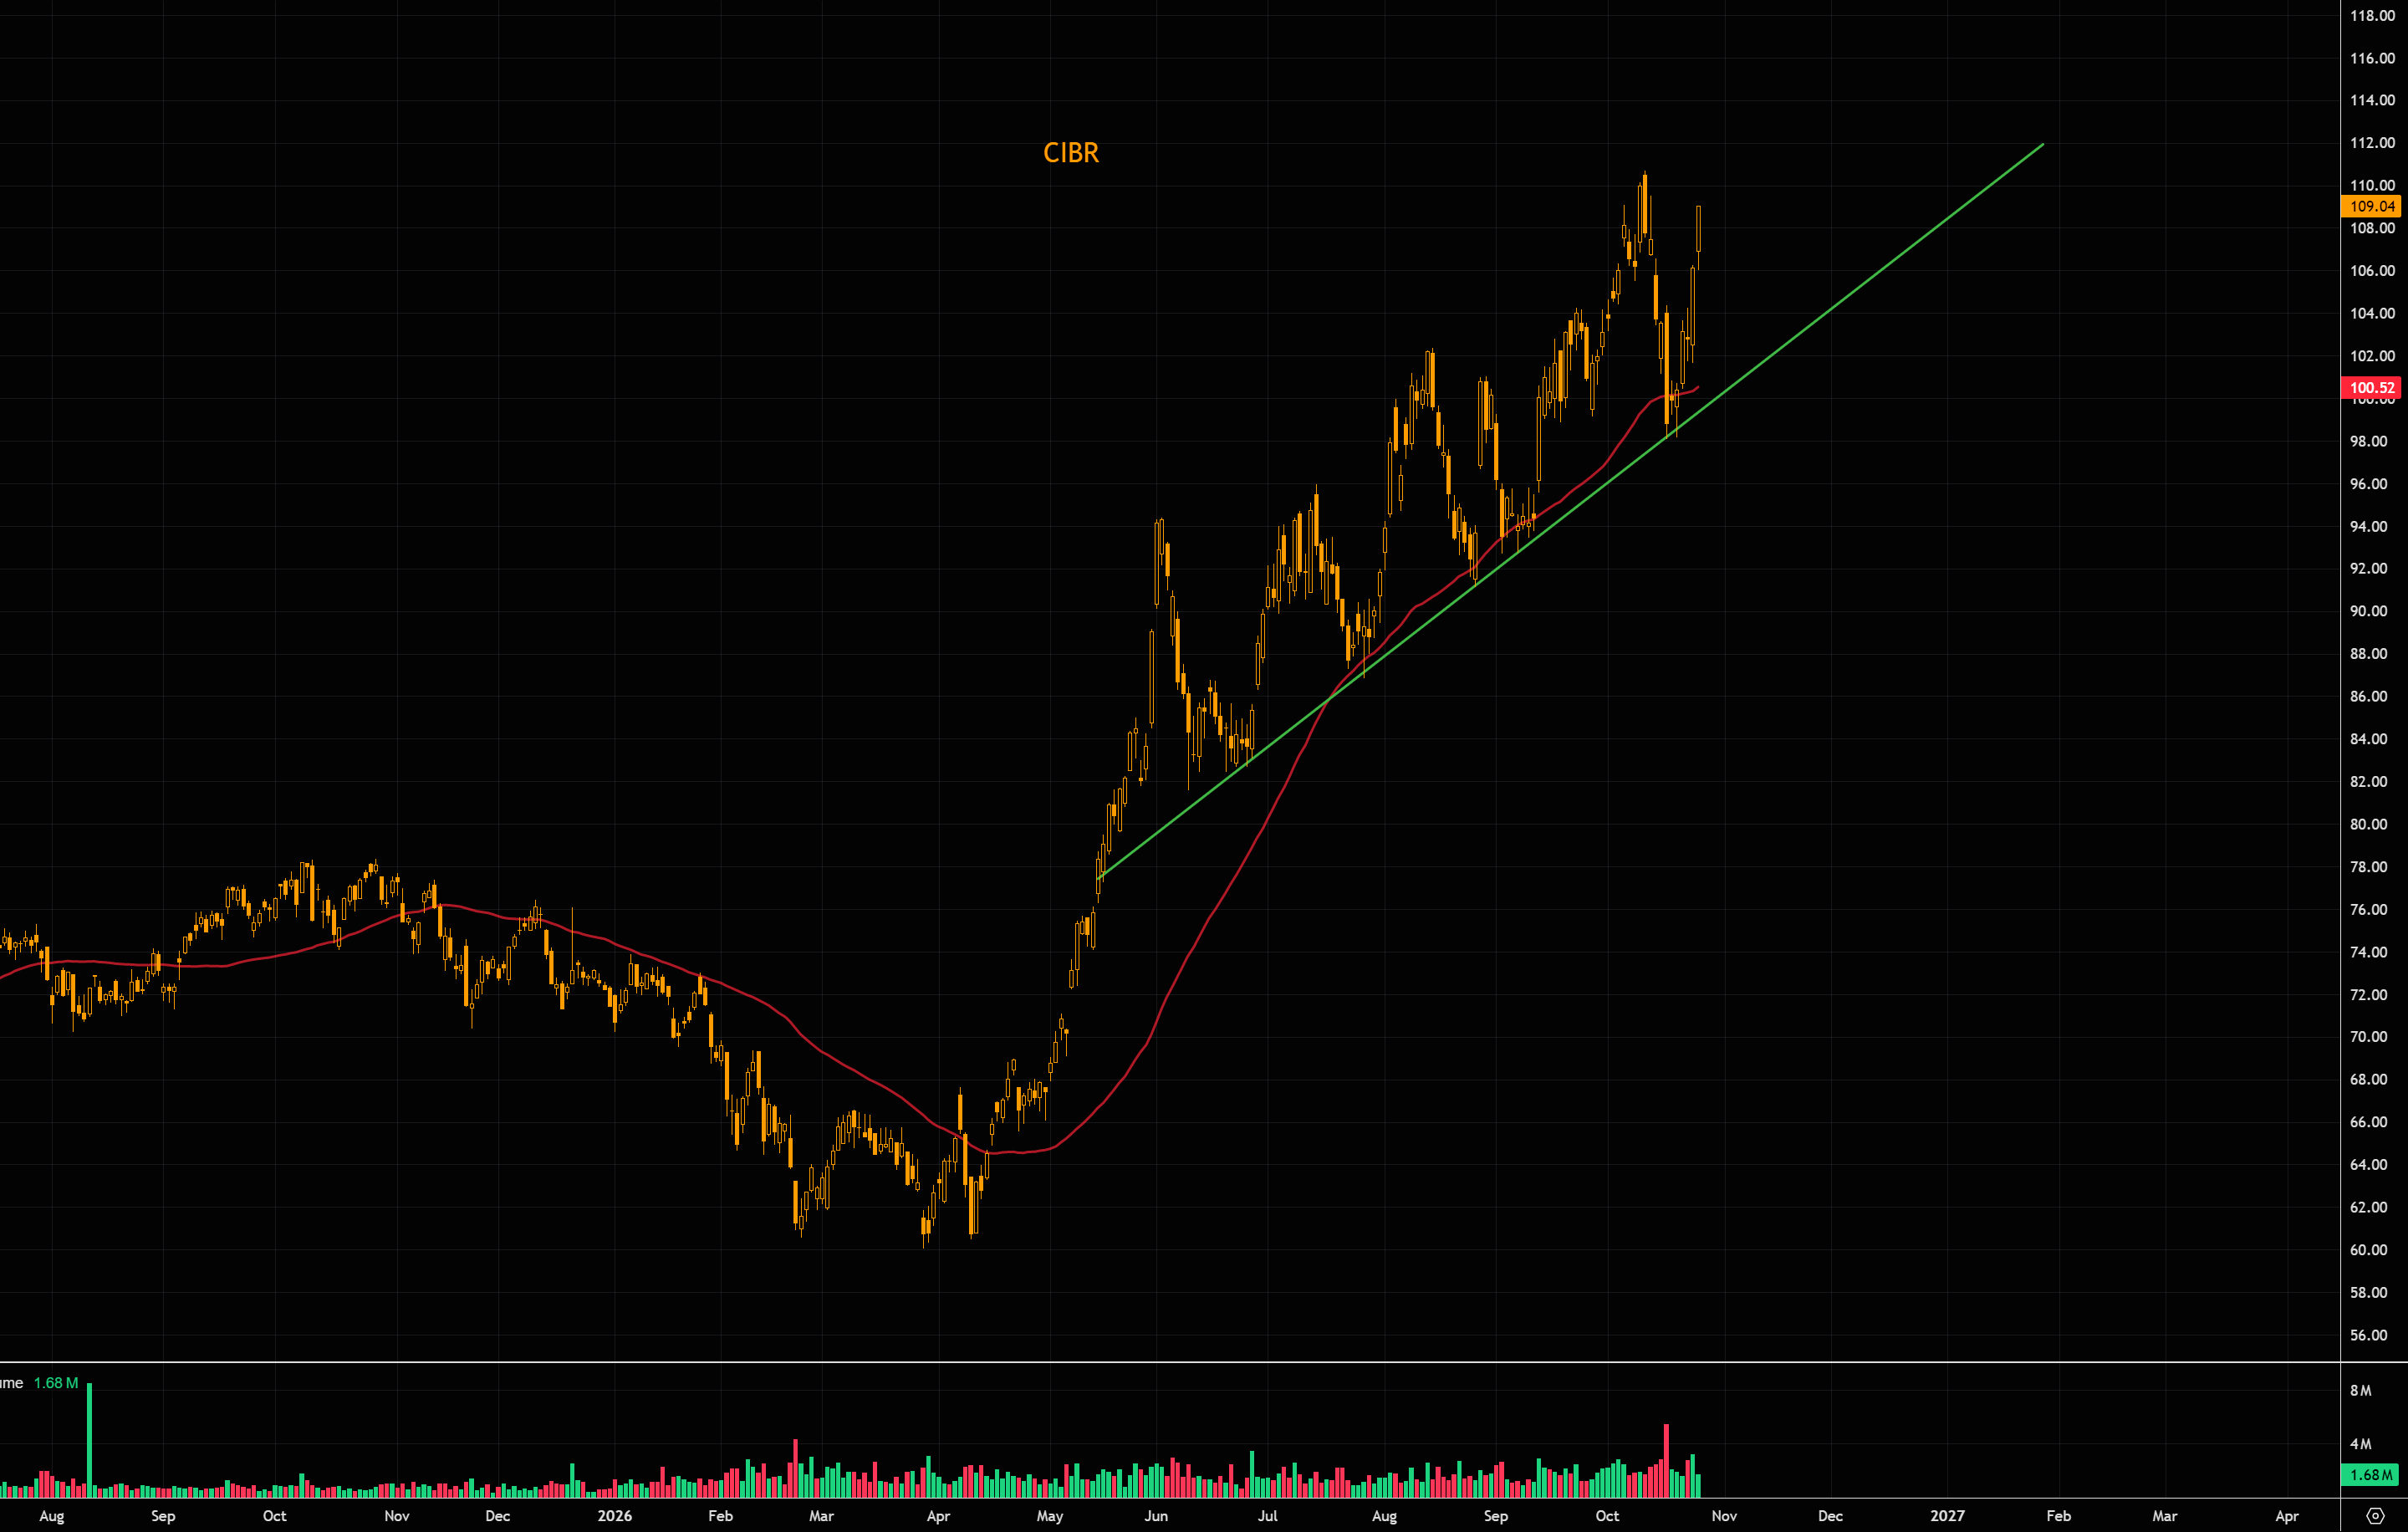
Buying dips toward the 50-day moving average and trendline support has remained a simple but profitable strategy in CIBR. While much of the AI trade has struggled, cybersecurity continues to display impressive relative resilience. The structural bull case remains intact, and the latest developments suggest the fundamental tailwinds are only getting stronger.
LSEG Workspace
Before you get too bullish
Something is very wrong in credit
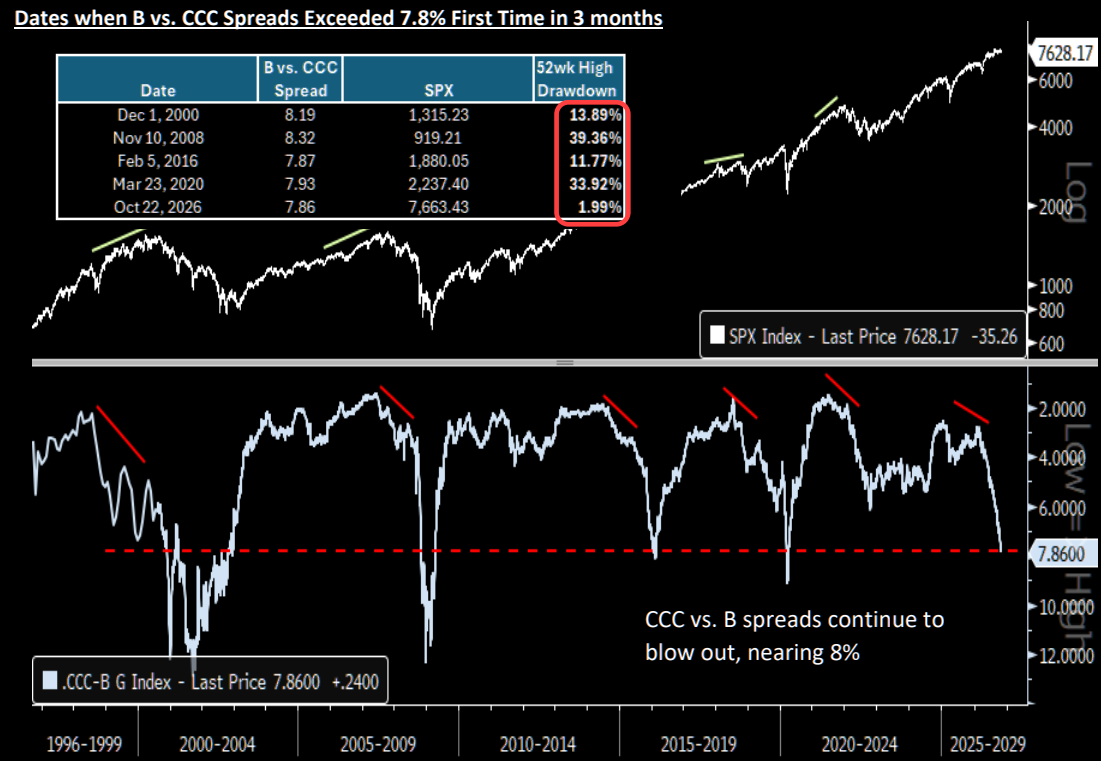
A remarkable disconnect. According to BTIG, the spread between B and CCC credit has reached nearly 8%, something seen only four other times since 1996. On every previous occasion, the S&P 500 was already at least 11.8% below its 52-week high. Twice, it was down around 30%. Today, the index is just 2% below its highs. Either credit is sending a false alarm, or equities have some serious catching up to do.
BTIG
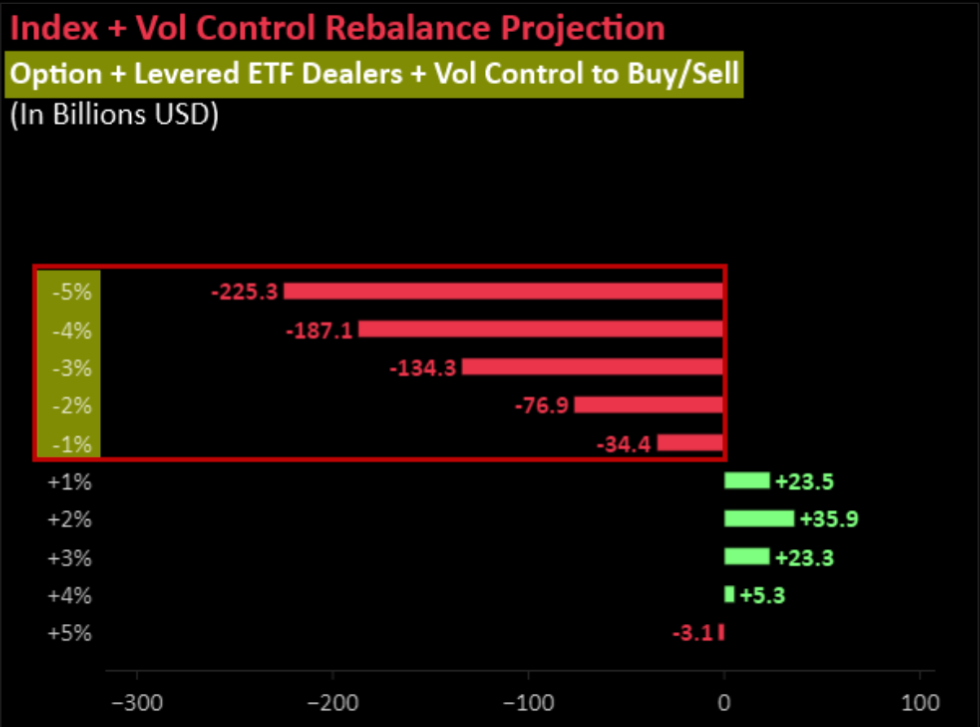
The $225 billion downside problem
The downside flow asymmetry is getting extreme. Nomura estimates that a further 5% equity decline could trigger roughly $225 billion of selling from index options, leveraged ETF dealers and vol-control strategies. A 3% decline could generate $134 billion of selling, while a 3% rally would produce just $23 billion of buying. The potential selling pressure is massively skewed to the downside. Not exactly a comforting setup.
Nomura
Pr. mdr.
349 kr.
Få straks adgang til denne artikel og alle andre artikler på ugebrev.dk
Alle artikler på ugebrev.dk
Om investering, finans, ledelse, samfundsansvar, life science og Bestyrelsesguiden.dk
Få dagens vigtigste økonominyheder hver dag kl. 12
Bliv opdateret på aktiemarkedets bevægelser, skarpe indsigter og nyeste tendenser fra Økonomisk Ugebrev – helt gratis.
Jeg giver samtykke til, at I sender mig mails med de seneste historier fra Økonomisk Ugebrev. Lejlighedsvis må I gerne sende mig gode tilbud og information om events. Samtidig accepterer jeg ØU’s Privatlivspolitik. Du kan til enhver tid afmelde dig med et enkelt klik.