Nordea forudser, at kronen kan blive styrket i andet halvår og nævner fire årsager, der peger i den retning: Efterspørgsel efter danske værdipapirer, en god likviditet i Nationalbanken, politiske risici i EU og de internationale aktiemarkeder.
DKK’o’meter: Four reasons why DKK could strengthen (markedly)..
The DKK outlook is clearly improving versus EUR, and we find (at least) four reasons why DKK could stand strong during the second half of 2020. There is a clear risk that a strong DKK could force Nationalbanken into action later this year.
The DKK outlook has improved a tad since Nationalbanken raised the policy rate by 15 bps in March to contain the DKK selling pressure. We argue that the pressure in EUR/DKK will likely be on the downside for the rest of the year, since most important factors speak in favour of a stronger DKK now.
We usually monitor the following four variables when assessing the EUR/DKK outlook:
- Hedge ratios of foreign assets in Danish pension funds
- Relative liquidity in EUR vs. DKK
- Political risks in the Euro zone
- Global equities
Currently all four point in the direction of a stronger DKK, which is the most uniform positive DKK outlook we have seen in years in our DKK’o’meter. Let us assess the drivers one by one.
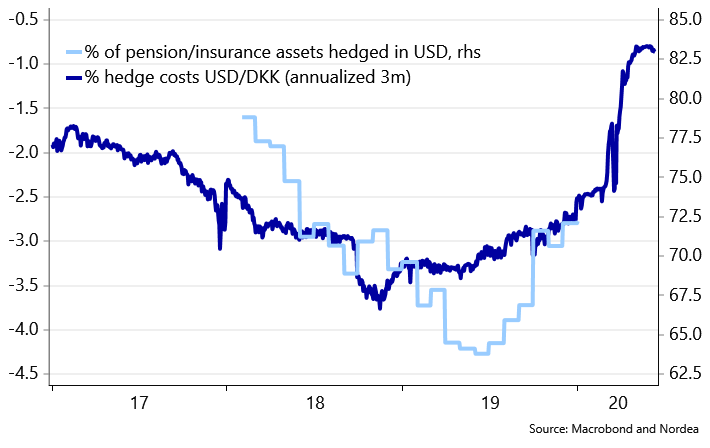
Driver 1: Hedge ratios
Hedge ratios of foreign assets in Danish pension funds remain subdued on the latest data we have from Nationalbanken. The hedge ratio of USD assets averages just above 70%, while the hedge ratio of EUR assets averages just above 15%. This is at least 5-10%-points below historical averages. If hedge ratios return to normal during 2020, it would likely lead to selling of foreign FX and buying of DKK in forward space to the magnitude of at least DKK 100bn since the total amount of USD and EUR assets in the sector is just above DKK 2000bn.
Price is a driver of hedging activity. Hedging ratios have started to climb since USD hedging costs have been moving slowly but surely lower since late 2018. The swift move to 0% on the policy rate from the Fed during the Corona crisis has led USD hedging costs to the lowest levels since 2015. This could even speak in favor of ABOVE average hedging ratios going forward. USD selling is very likely to materialize during 2020, as a result of the changed playing field due to lower FX hedging cost.
Chart 1: When USD hedge costs cheapen, hedge ratios usually increase..
Driver 2: ECB QE / EUR liquidity
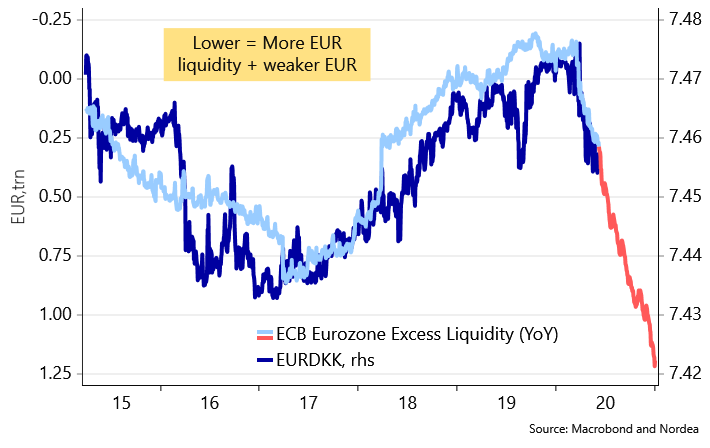
Since the ECB introduced QE as a policy tool, EUR/DKK has traded fairly tightly correlated to the yearly development in EUR excess liquidity. If the ECB prints a lot of EURs, EUR/DKK trades in the low part of the range, while the opposite is the case, when the ECB has had a less expansive monetary policy.
The mechanics are straight forward to us. Given the EUR/DKK “peg”, the number of EURs in circulation relative to the numbers of DKKs in circulation should be the biggest driver of EUR/DKK spot. Since the DKK sector liquidity is relatively stable as % of GDP compared to the EUR liquidity, we argue that the EUR liquidity is the main thing to watch.
Given the ECBs current policy mix of: EUR 1350bn in PEPP purchases, EUR 360bn in APP purchases and easier TLTRO-III terms, it wouldn’t be a major surprise to see at least an EUR 1250-1500bn increase in excess EUR liquidity over the year. Unprecedented volumes that should put a potential big downside pressure on EUR/DKK until the DKK liquidity is increased accordingly. The below chart even suggests that EUR/DKK will be forced below 7.4330, which has been the most recent DKK selling intervention threshold from Nationalbanken.
Chart 2: More EURs = lower EUR/DKK. An unprecedented flood of EUR liquidity is about to hit markets
Driver 3: DKK liquidity
DKK liquidity remains tight as DKKs have left the system due to FX intervention earlier this year (and in 2018/2019) and due to an increase in the Government deposit at Nationalbanken. Around 13bn DKKs have been paid out in aid packages so far, which is far below the projections from the Danish administration.
Recent trends suggest DKK 1-2bn are being paid out per week (follow the data here), which is far short of the 1-1.5bn DKK a day that Nationalbanken projects in the liquidity forecast. We struggle to see why a sudden pick-up in the payment pace should arise, since the incentives to seek money in aid packages are less clear than a month ago.
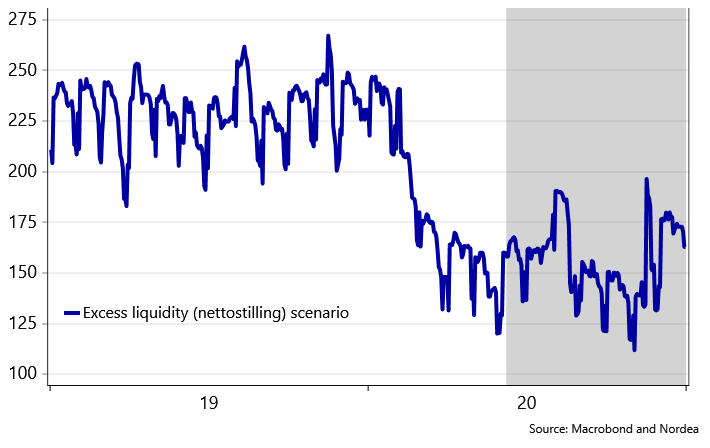
DKK liquidity will for this reason likely remain tighter than anticipated by the central bank, but it will likely still increase towards DKK 170-175bn. A tight DKK liquidity is a DKK spot positive story, which may ultimately force Nationalbanken into action (via selling DKKs in the market, if we are right on the EUR/DKK spot call). It will likely take a lot of DKK-selling (>50bn DKK) from the central bank before a rate cut comes into play since the sector liquidity could need a welcomed boost by some DKK selling from the central bank.
Chart 3: DKK liquidity to remain fairly tight unless FX intervention comes into play..
Driver 4: Credit / political risks in the Euro area
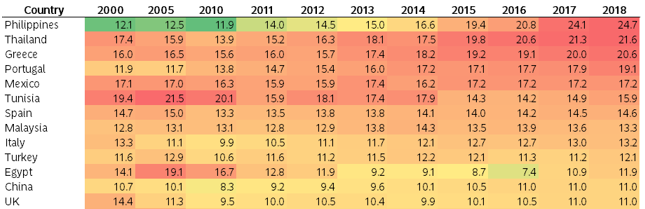
Below you will find a heat-map of Tourism as % of GDP in countries with more than 10 million inhabitants (Nordic countries are included). Note that Spain, Greece, Italy and Portugal are all heavily dependent on tourism as well, which is a reason to remain a little skeptical on the credit story in the Euro area despite tailwinds for the “Next Generation EU” debt deal and a humungous ECB QE program. DKK markets will likely look attractive in comparison.
Chart 4: Heatmap of Tourism as % of GDP
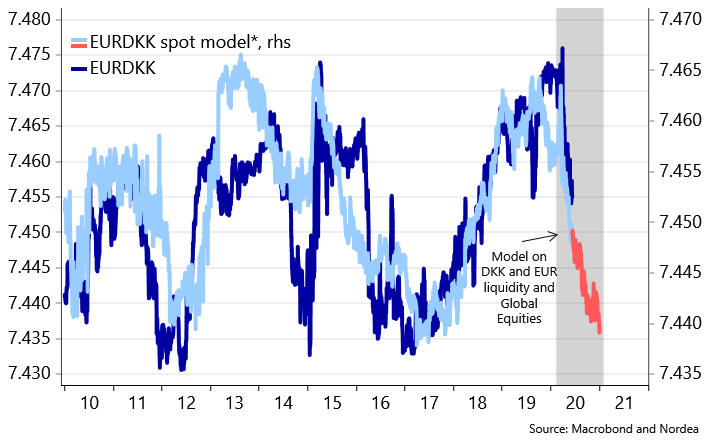
If we sum it all up in a regression model, we get a clear signal of downside risks in EUR/DKK spot, also even if we stress the model with a 20-25% setback in global equities. The liquidity effect from the flood of EUR liquidity is bigger than the equity market effect in the OLS-model.
Chart 5: Even if the stress global equities by 25%, we get that liquidity effects will take EUR/DKK lower
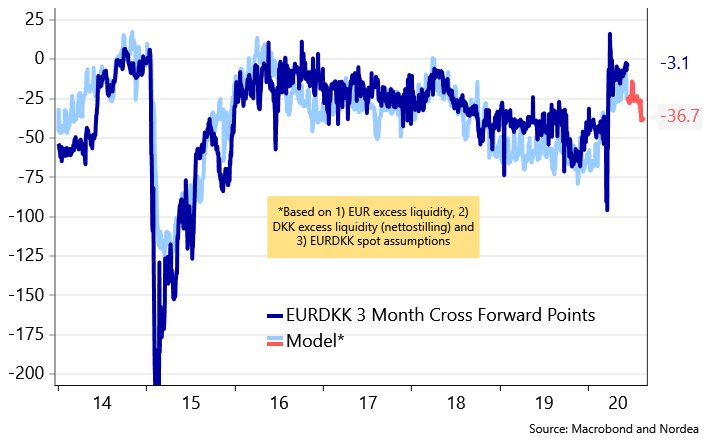
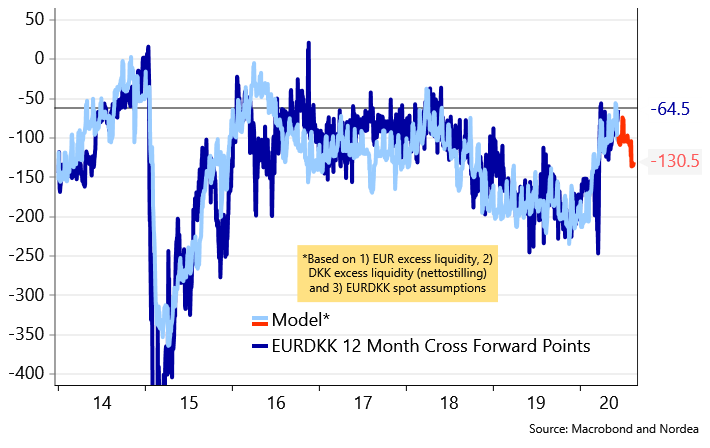
How are things priced in forwards?
DKK rates are priced to narrow a bit versus EUR (OIS-spreads) with 4-4.5bps of lower DKK-EUR spreads priced in over the coming 12 months. This is also reflected in FX forward space as the short end is the cheapest roll (it is essentially “cost-free” to roll short).
If we are right i) that EUR/DKK will move lower, maybe even towards intervention territory and ii) that DKK liquidity will move a tad higher, it should lead EUR/DKK forward points further into negative territory. It may make sense to increase the average tenor (towards 6-9 months) in EUR hedges because of this story and to increase the hedge ratio of EUR assets, accordingly.