

Resume af analyse fra Bank of America:
- Aktiemarkedet er ekstremt todelt. De store AI-, Mag7- og biotechaktier holder sig stærke trods markant højere renter, mens bredden i markedet forværres kraftigt. Omkring 400 S&P 500-aktier ligger under deres 50-dages glidende gennemsnit, og 300 under 200-dages gennemsnittet. Indsat tekst
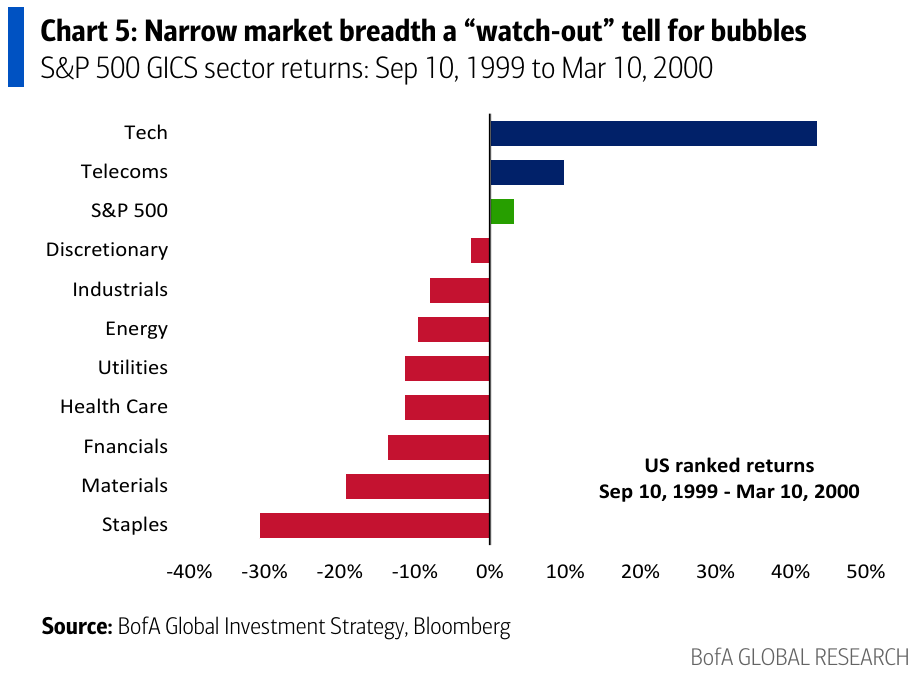
- BofA’s Michael Hartnett ser klare paralleller til 1999. Dengang steg tech mere end 40 pct. i de sidste seks måneder før toppen i marts 2000, mens næsten alle andre sektorer faldt. Den samme koncentration ses nu omkring AI. Indsat tekst
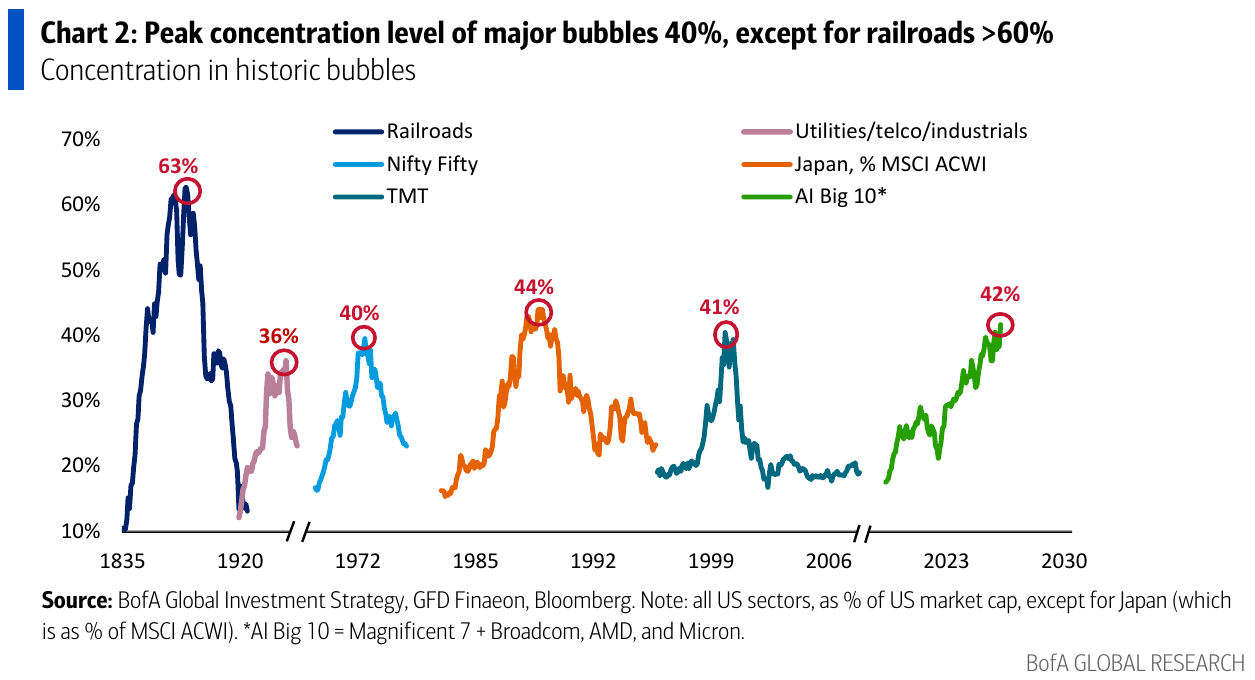
- AI-boblen kan stadig blive større. De ti største AI-relaterede aktier udgør nu omkring 42 pct. af markedsværdien. Historiske bobler toppede typisk omkring 40 pct., men jernbaneaktier nåede helt op på 63 pct. i 1881. Indsat tekst
- Den historiske advarsel er, at store investeringsbooms normalt slutter med kreditproblemer. Jernbaneboblerne i 1873 og 1881 brast efter overinvesteringer kombineret med kreditstramninger, likviditetsproblemer og kapitaludstrømning. Indsat tekst
- AI-investeringerne er endnu ikke på historiske ekstremniveauer. Hyperscalernes capex ventes at nå 1.200-1.400 mia. dollar og 3,5-4 pct. af BNP i 2027, fortsat under de cirka 5 pct. af BNP, der blev nået under jernbane- og fiberboblerne. Indsat tekst
- Den store forskel fra tidligere investeringsbooms er renterne. Jernbaneboomene blev understøttet af faldende obligationsrenter. I dag er den amerikanske 10-årige rente omkring 5,33 pct., samtidig med at olieprisen er over 100 dollar. Det øger risikoen for, at finansieringsomkostningerne bliver det, der knækker AI-boomet. Indsat tekst
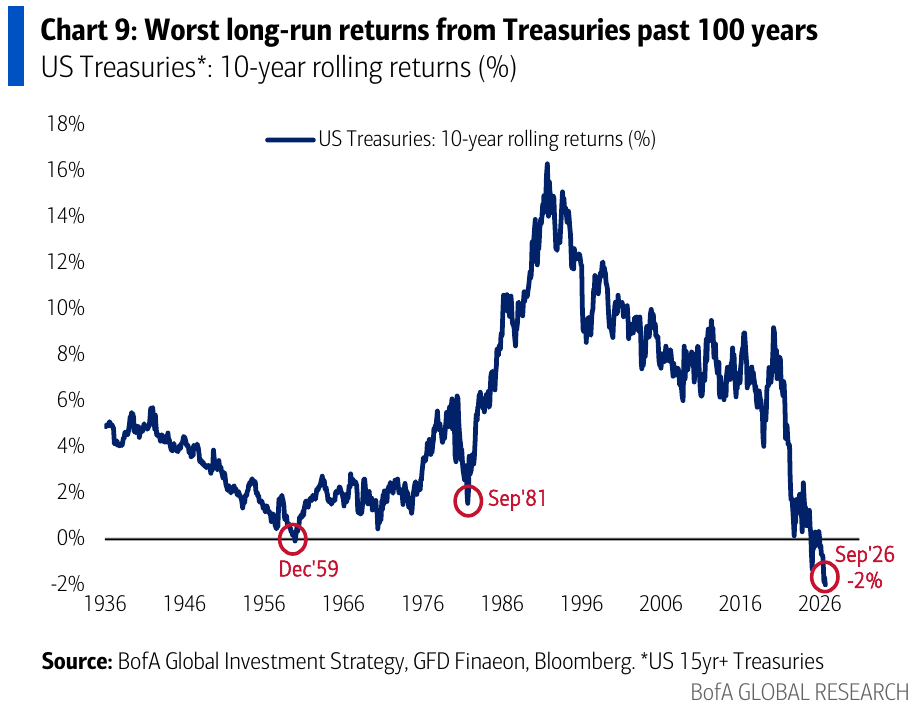
- Hartnett anbefaler nu at begynde at købe obligationer. Hans contrarian-syn er, at de ekstremt dårlige langsigtede obligationsafkast historisk har været tegn på attraktive indgangspunkter. 10-årige rullende Treasury-afkast er nu omkring minus 2 pct., det dårligste i omkring 100 år. Indsat tekst
- Særligt amerikanske tech-obligationer begynder at se interessante ud. Investment-grade tech-obligationer er faldet ca. 9 pct. på et år, mens renterne er steget fra 4,5 til 6,2 pct. Oracle-obligationer giver omkring 8,4 pct., Meta 7,5 pct. og Google 6,9 pct. Indsat tekst
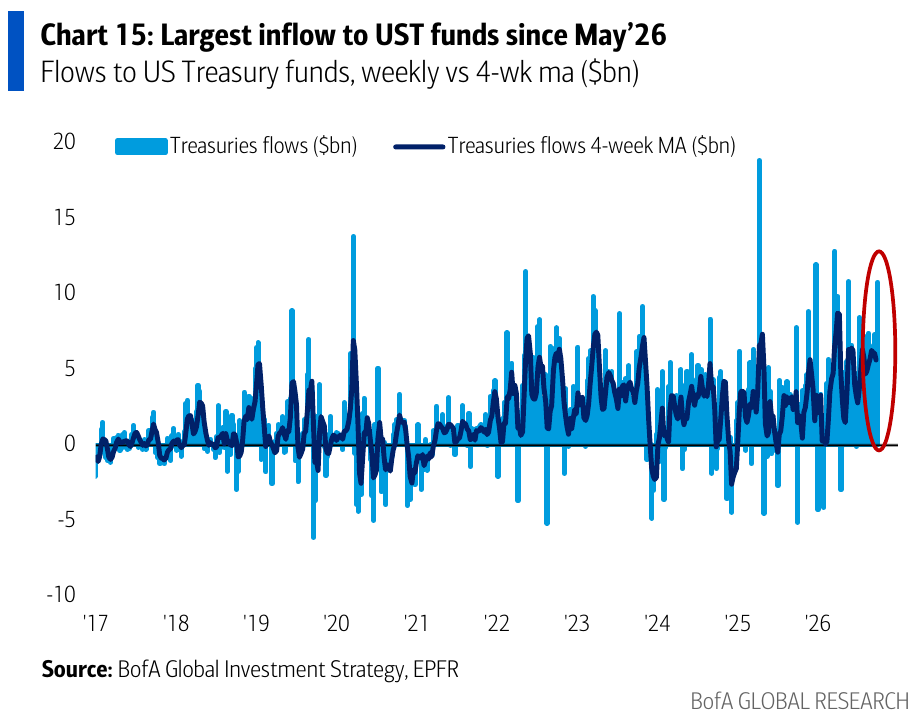
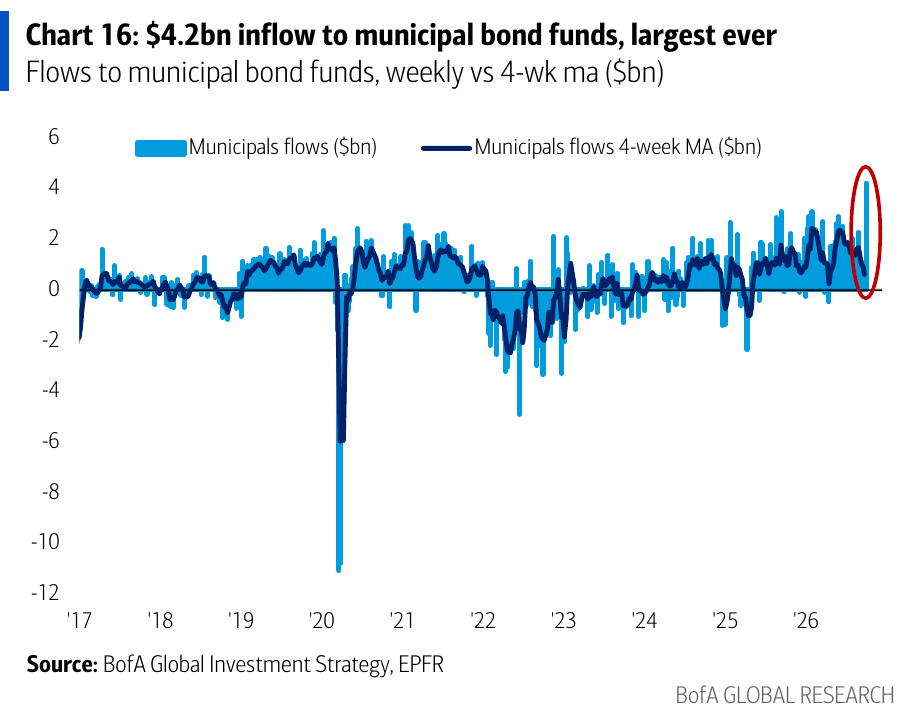
- Investorerne er begyndt at flytte penge ind i obligationer. Seneste uge gav 18,8 mia. dollar i obligationsindstrømning mod 15,8 mia. dollar til aktier. Lange obligationer havde den største tilgang siden maj 2025, mens municipal bonds oplevede den største tilgang i dataseriens historie. Indsat tekst
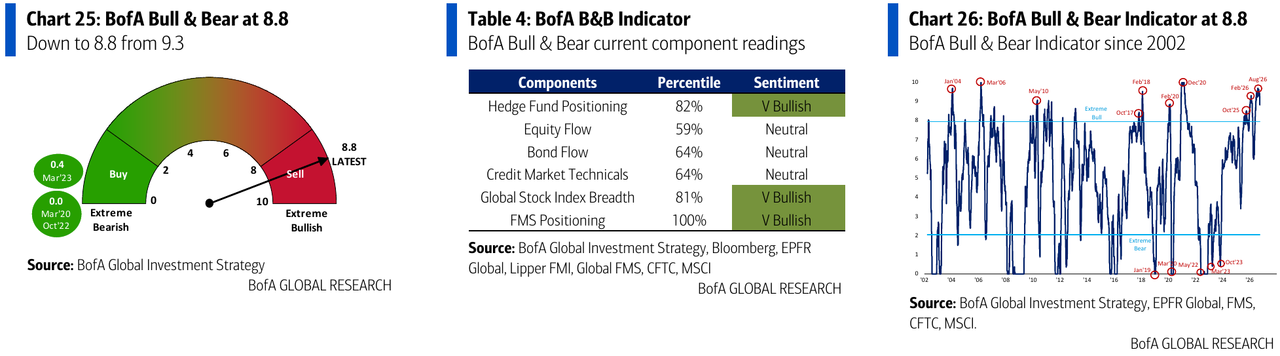
- Risikosignalerne er tiltagende, selv om markedet endnu ikke er knækket. BofA’s Bull & Bear Indicator er faldet fra 9,3 til 8,8 og er fortsat i klart “sell”-territorium. Samtidig er private BofA-kunder rekordtungt investeret i aktier med 66,3 pct. af porteføljerne og rekordlave 9,4 pct. i kontanter. Hartnetts hovedbudskab er derfor, at aktier priser fortsat AI-boom ind, mens obligationsmarkedet i stigende grad priser økonomisk nedtur og kreditrisiko ind.
Uddrag fra Bank of America og Zerohedge
In his latest Flow Show, titled “A Tail of Two Cities”, Hartnett starts with his weekly scoreboard. Another week, another leg down for gold, which went from -1.1% YTD to -3.8% and now trails cash by a comfortable 6.5 points. Meanwhile, bond holders are still being reminded that “safe haven” and “positive return” are two different things:
Scores on the Doors: oil 61.8%, global stocks 12.1%, US stocks 12.0%, US dollar 3.8%, cash 2.7%, HY bonds -0.3%, IG -3.2%, bitcoin -3.4%, gold -3.8%, govt bonds -4.1% YTD.
It’s quarter-end, so he also lists the Q3 winners and losers. Bitcoin came out on top after its spring plunge, and Korea managed to be one of Q3’s worst performers while still being up 98% on the year:
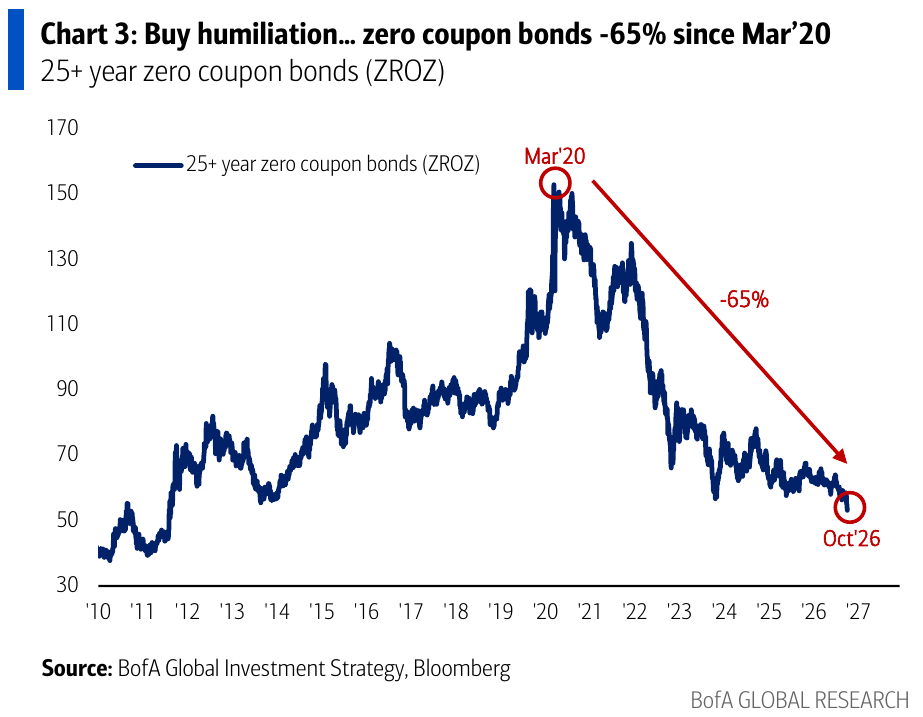
Q3 Winners & Losers: winners… bitcoin 43%, oil 42%, software 18%, Mag7 11%; losers… zero-coupon bonds -15% (Chart 3), semis -11%, industrials -10%, Korea -8%.
“Rates Don’t Matter When You’re Curing Cancer”
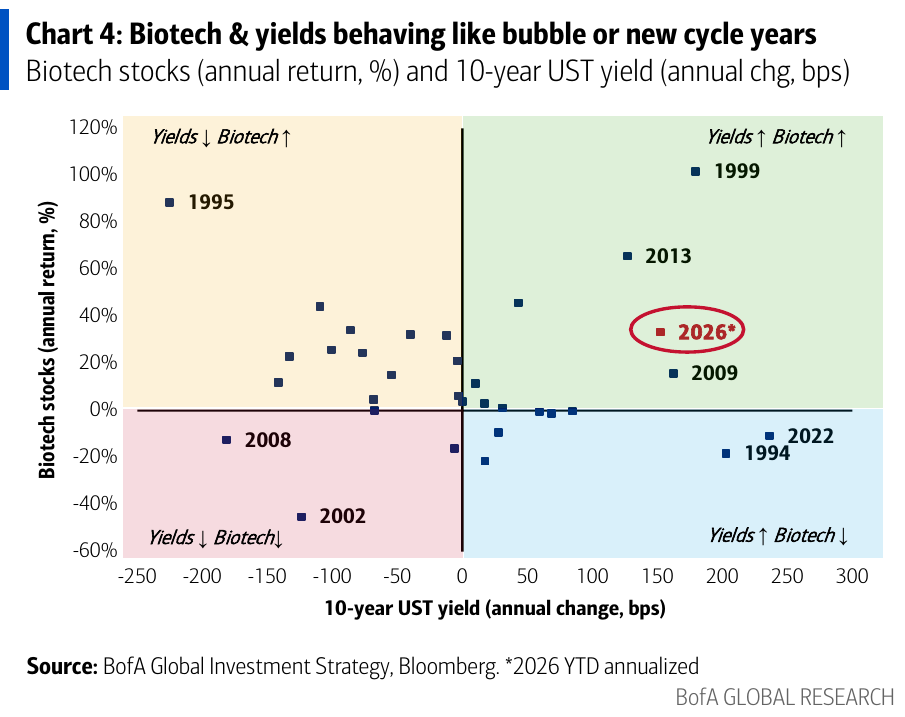
That’s this week’s Zeitgeist quote, and the chart behind it is one of the more eye-opening ones in the note. In 2026, biotech stocks and 10Y yields have both surged together. That combination shows up only in bubble years or in the start of new cycles: 1999, 2009, 2013. Whether 2026 turns out to be a bubbly 1999, or boomy 2009, is the trillion-dollar question.
The Price Is Right: The Best Of Times, The Worst Of Times
Which brings us to the Dickens pun in the title: Hartnett sees two very different markets in one index:
Best of times, worst of times… tighter financial conditions crushing equity breadth… 400 SPX stocks trading below 50dma, 300 stocks <200dma as market trading “long artificial intelligence” (NDX), “short artificial irrelevance” (SPW), confident MAG7, AI, biotech (Chart 4) impervious to higher rates, 1999 analog intact (Chart 5).
“Short artificial irrelevance” may be the best line of the year, and the data backs it up. As we noted on Monday, the Goldman tech desk found the median stock 16% underwater as breadth craters to dot-com lows, even as the index sits at record highs. A day later, the share of stocks above their 200DMA dropped below half:
Hartnett’s 1999 template shows how lopsided things got just before the top. In the six months to the March 2000 peak, tech rose more than 40% while staples fell 30% and every sector except tech and telecoms went down. Pretty much like right now.
Tale Of The Tape: Risk-Off Until The Dollar Peaks
Last week Hartnett gave us the two triggers for a risk-off deleveraging cascade. This week he lists the assets already showing deleveraging-style price action, and it’s a long list:
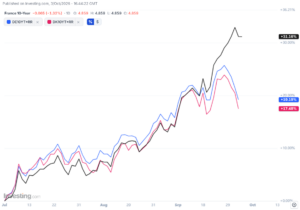
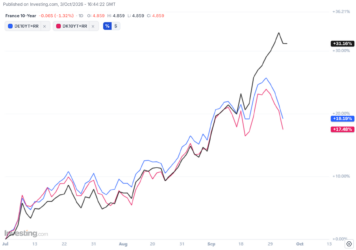
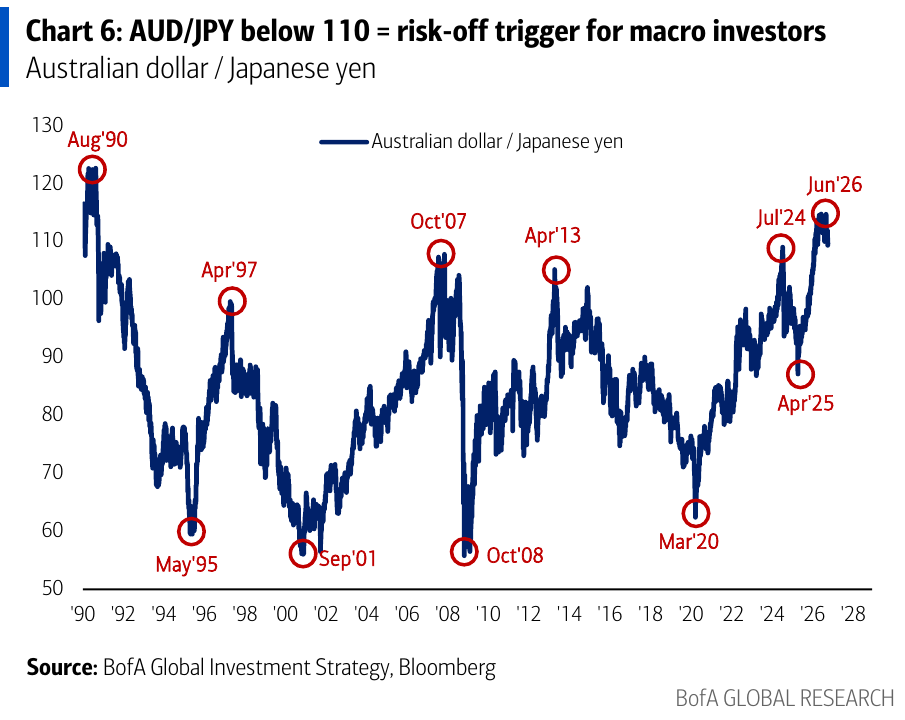
It’s risk-off until US$ peaks; US$ spiking on credit event risk… Aussie dollar (Chart 6), French bonds, risk parity (RPAR), bond insurers (AGO), tech CDS (ORCL)… deleveraging price action; threat of policy panic (open-ended UST buybacks, YCC… can’t let yields hit AI capex boom/stocks into midterms) limits downside unless small/mid-cap (MDY <$666, IJR <$135) follow banks breakdown… “peak growth optimism” = negative tech.”
So there are now two more levels to watch next to IXG and MOVE: MDY (mid-caps) at $666 and IJR (small-caps) at $135. As for AUD/JPY, the classic macro risk barometer, it has rolled over from its June high, and Hartnett draws the risk-off line at 110. On Friday we closed just below it.
Then there’s Oracle CDS, which longtime readers have been tracking all month. Oracle bonds plunged to a record low (Sep 25) and its CDS soared to record wides, as its $30 billion capex plan came into question, a day after this:
The safety net, as always, is the policy put. As Hartnett has been saying for over a decade, markets stop panicking once policymakers start. This time, the ammunition he expects is open-ended Treasury buybacks and yield-curve control. With the midterms a month away, the administration is unlikely to let the long end blow up the AI capex boom (and the stock market). Of course, that just means the day of reckoning wil be even more painful when it hits.
The Biggest Picture: “It’s The Railroads This Time”
Back on May 23, Hartnett called AI “the biggest bubble since the railroads”. Fast forward to this week when he takes the comparison literally. The bull case, he writes, is “it’s the railroads this time”: every major bubble since (the roaring ’20s, the Nifty Fifty, Japan, the internet) peaked at roughly 40% of market cap, but railroads hit 63% in 1881. Today’s “AI Big 10” is at 42%, up from the 41% he flagged last week. But on the railroad precedent, there is still a lot of room left.
So how did the railroad bubbles actually end? Hartnett walks through both.
- First railroad bubble (ended 1873): excess capex plus a credit crunch. Railroad stocks tripled from 1861 to 1872 as US track mileage doubled from 35,000 to 70,000 miles. Capex peaked at about 5% of GDP ($400mn) in the early 1870s. Then the Franco-Prussian war triggered a US credit crunch and pulled European capital back home. Jay Cooke & Company collapsed in 1873, and about 115 railroads went bankrupt in the following 12 months.
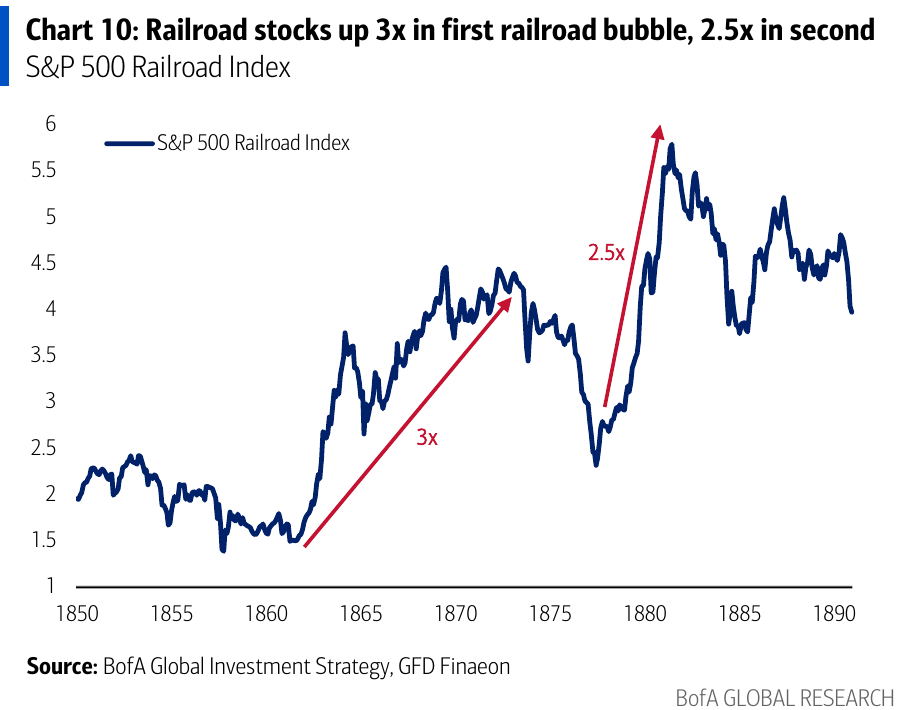
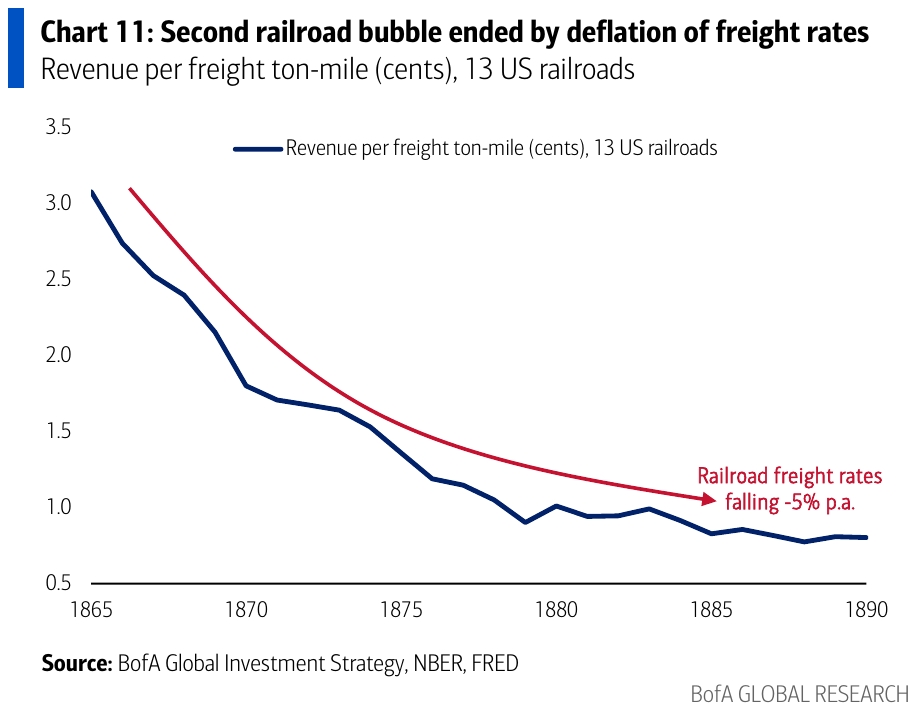
- Second railroad bubble (ended 1881): excess capex plus deflation. Railroad stocks rose 2.5x from 1877 to 1881 and peaked at 63% of the US equity market. Railroad construction quadrupled in four years to 1882, which created excess capacity and crushed freight rates. Revenues, profits and the funding for more capex went with them. Construction then collapsed 42% in 1882, which set off a banking and credit panic (the failures of Marine National Bank and Grant & Ward), gold outflows of $150mn to Europe, and the third-longest US recession on record (1882-85).
Now compare that with AI data centers. Hartnett has good news and bad news.
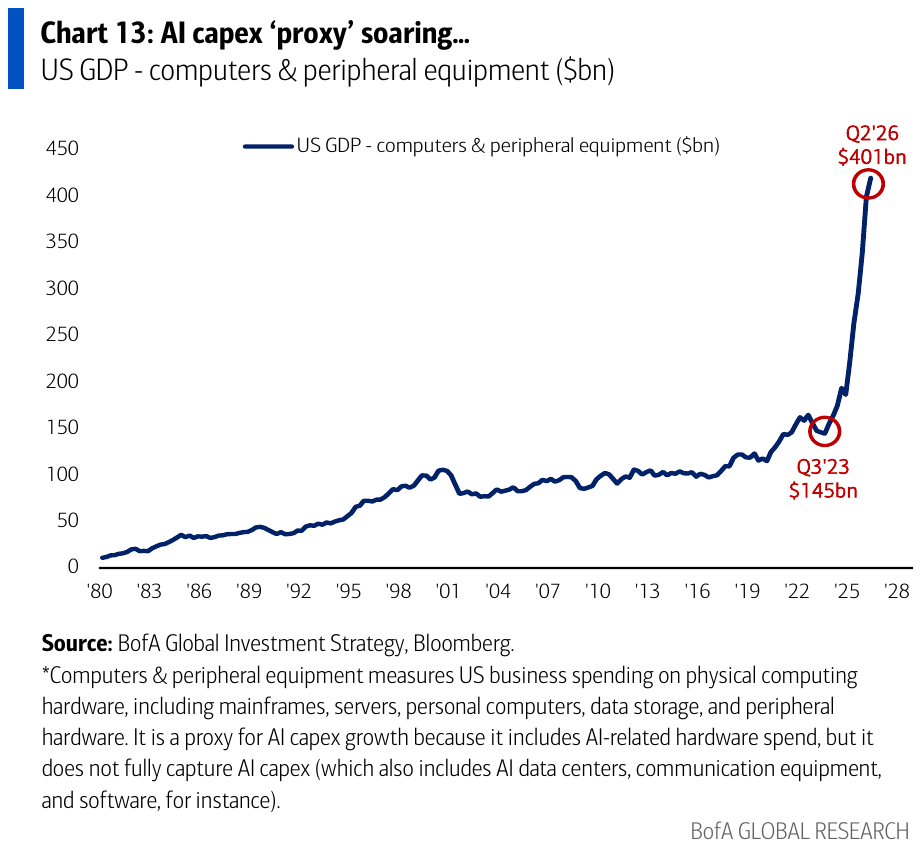
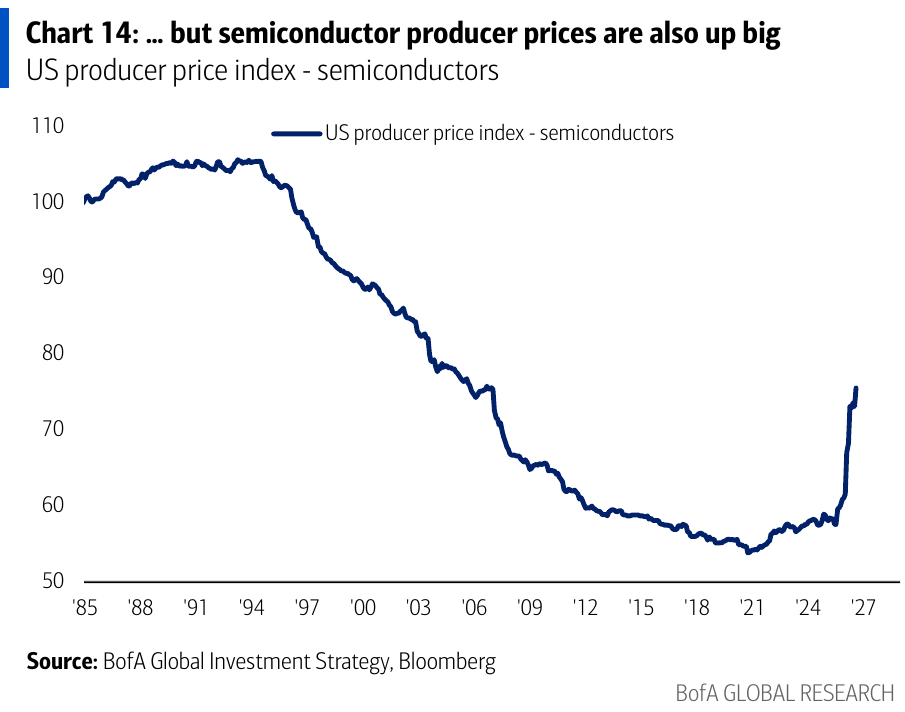
The good news: AI capex is still below railroad levels. Hyperscaler capex of $1.2-1.4 trillion is on track to reach 3.5-4% of GDP in 2027. That’s still under the 5% peak for both the railroads in the early 1870s and the fiber-optic buildout of the late 1990s. And unlike freight rates, which deflated about 5% a year in the 1870s and 1880s, semiconductor prices are soaring. Business spending on computers and peripherals, the best GDP proxy for AI capex, has nearly tripled since Q3 2023 to $401bn:
The bad news: the railroad booms were backstopped by falling Treasury yields, which is “evidently not the case today.” And both railroad tops came with credit events, sharp declines in liquidity, and capital outflows driven by geopolitics. That should sound familiar to anyone watching the 10Y at 5.33% and Brent above $100.
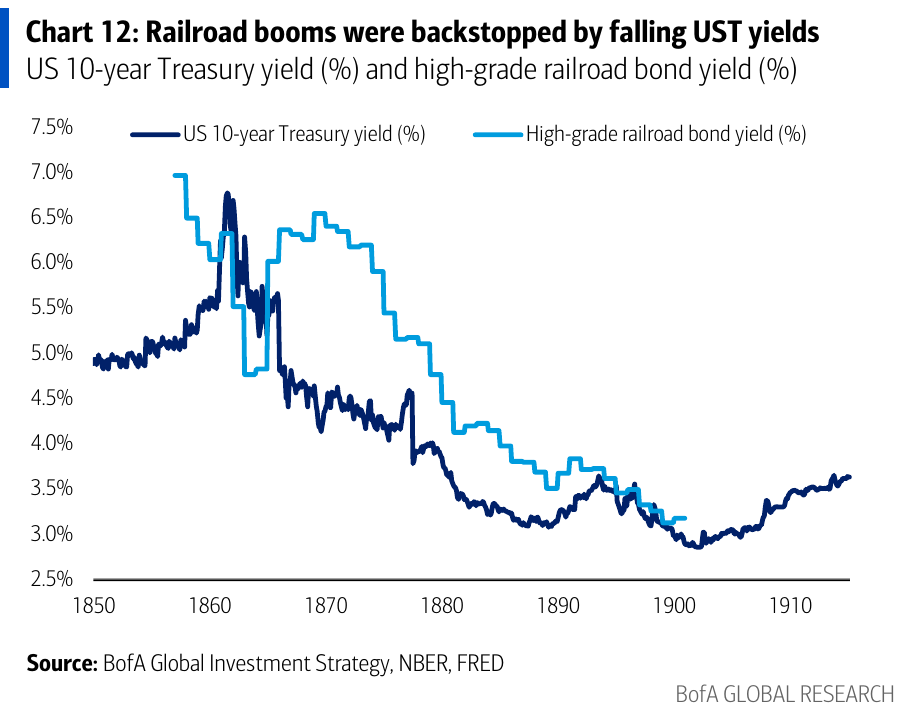
Put differently: the AI bubble has room to run on capex and concentration. What ended the last two capex manias was the cost of money, and that is moving the wrong way. We had a similar thought last week when we wrote that bonds are about to crash the stock market.
On Bonds: “Buy Humiliation”
This is where Hartnett gets contrarian. He admits a 100-200bps drop in yields probably needs a credit event or a recession. But he notes that asset allocators are very long stocks to ride the final melt-up in US tech, and very short bonds to ride the final melt-up in Treasury yields. His answer:
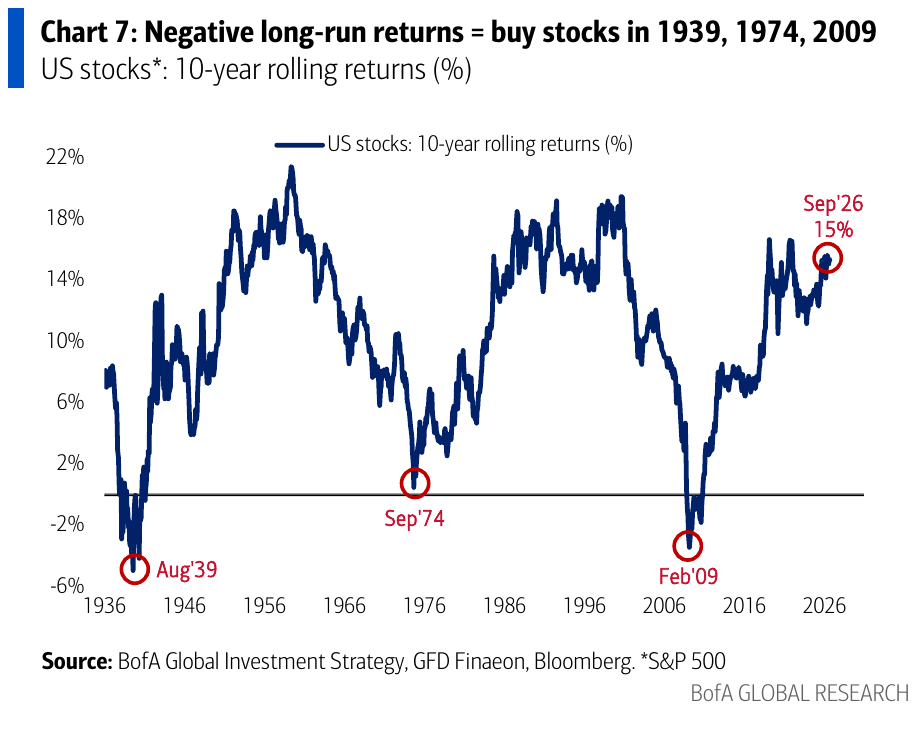
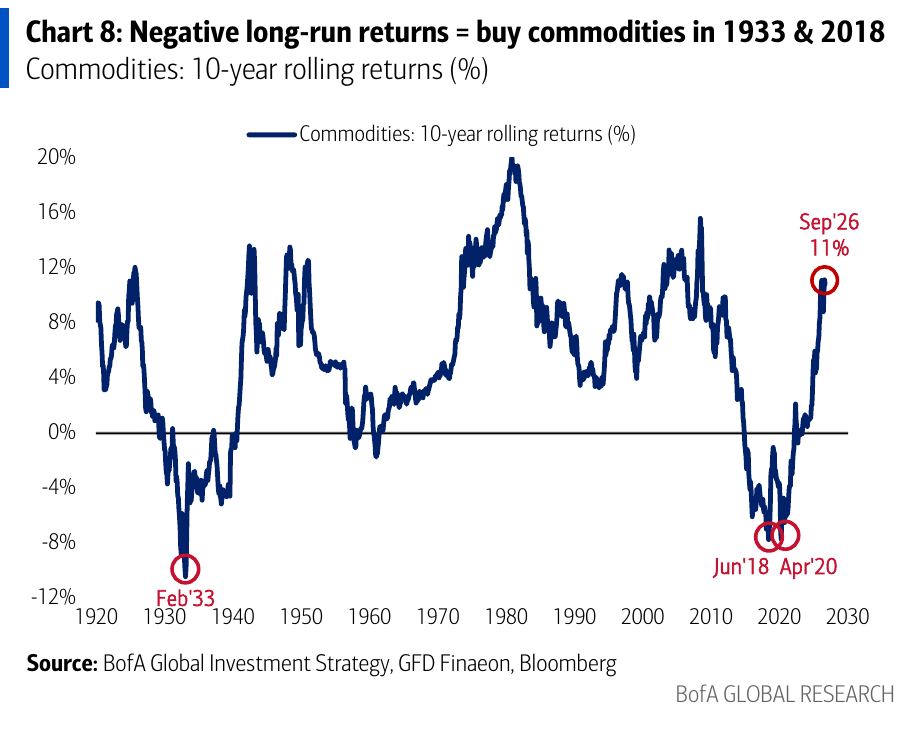
We say “buy humiliation”, start adding some bonds; negative long-run returns were great entry points for stocks in 1939, 1974, 2009 (Chart 7), commodities in 1933, 2018 (Chart 8); long-run Treasury returns worst in past 100 years (Chart 9) = entry point.
The humiliation is real. Long-dated zeros (ZROZ) are down 65% from their March 2020 peak, and 10-year rolling Treasury returns are at -2%, the worst in a century:
The last time stocks and commodities had long-run returns this bad, it marked a generational buying opportunity:
Then comes his more provocative call, on the very hyperscaler paper the market has been dumping:
Bond portfolios getting close to offering equity-like returns… price of US IG tech bonds (CITE) -9% past year, yield up from 4.5% to 6.2%… since AI back-stopped by US government, long-term hyperscaler bond yields (Oracle 8.4%, Meta 7.5%, Google 6.9%…) may soon tempt buyers.
Put differently, Hartnett is betting that Washington won’t let AI fail, which makes junk-like yields on investment-grade hyperscaler debt a policy-put trade. It’s a bold view. As of Thursday, the market was positioned the other way:
When the most-shorted bonds on the Street are the ones Hartnett wants to buy, one side of the trade is going to be humiliated. The open question is which one, and whether the answer arrives before or after the Goldman math on how much revenue it takes to justify hyperscaler capex starts to bite.
Flows: Investors Start To Nibble At Bonds
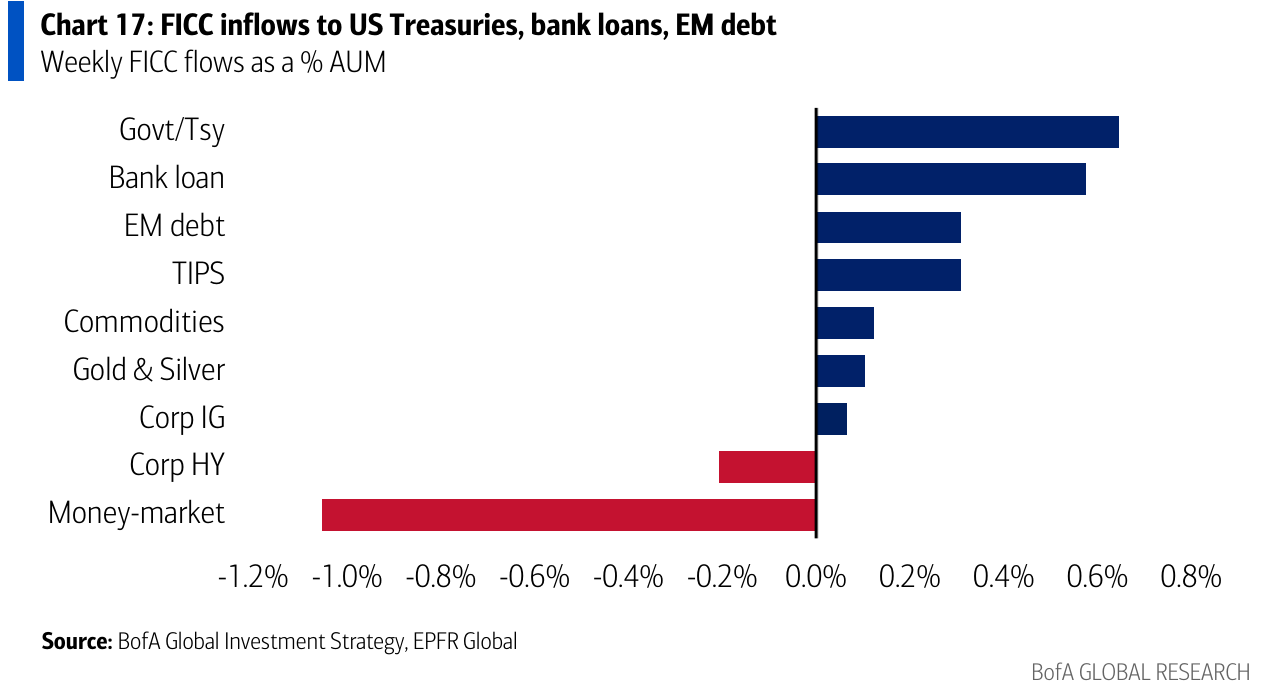
Turning to the latest EPFR data for the week ending Wednesday, Hartnett finds “$18.8bn to bonds, $15.8bn to stocks, $0.9bn to crypto, $0.7bn to gold, $118.0bn from cash on quarter-end.” His “Flows to Know” show investors are starting to follow his advice and move into bonds and bond-sensitive sectors:
- Long-term bonds (govt/corp >6yrs): $7.4bn inflow, the largest since May’25
- Municipal bonds: $4.2bn inflow, the largest ever (data since 2004)
- Europe equities: $1.3bn inflow, the largest since Feb’26
- China equities: $3.7bn inflow, the largest in 9 weeks
- Tech: $3.3bn inflow, the largest in 5 weeks. The AI trade still gets its weekly allowance.
- Utilities: $1.0bn inflow, the largest since Dec’25. That’s the bond proxy, and the power trade.
As a share of AUM, fixed income money went into Treasuries, bank loans and EM debt, while money-market funds bled 1.1% of AUM in the quarter-end shuffle:
Also worth noting: BofA’s private clients now hold a record-high 66.3% of their assets in stocks and a record-low 9.4% in cash. Allocators don’t come more all-in than that.
Bull & Bear: Off The Highs, Still “Sell”
The BofA Bull & Bear Indicator fell to 8.8 from 9.3. Hartnett puts that down to wider spreads in risky bonds, HY bond outflows and rapidly deteriorating global breadth: a net 27% of global equity indices are trading below both their 50- and 200-day moving averages, the worst since March. That’s a sizeable drop for one week, but at 8.8 the indicator is still in “sell” territory.
Bottom Line
Hartnett’s message this week can be summed up in one sentence: stocks are pricing the railroads, bonds are pricing the bust, and he is betting bonds blink first. He also thinks the policy put (buybacks, YCC, jawboning oil) keeps the long end from wrecking the AI trade into the midterms, and that makes humiliated bonds (and even Oracle at 8.4%) a buy.
We’d put it slightly differently: in both railroad busts the trigger was credit, liquidity and capital fleeing abroad, and the same three things are already showing up in Oracle CDS, AUD/JPY and the French bond market. So keep watching the levels: IXG at $125, MOVE at 125, and now MDY at $666 and IJR at $135. Once small caps follow the banks down, Hartnett’s own playbook says the risk-off cascade is here, policy put or not.