



Uddrag fra Goldman:
ETF demand has moved from a structural story to a flow event, and the charts of that ‘flow’ continue to become more WTFer by the month…
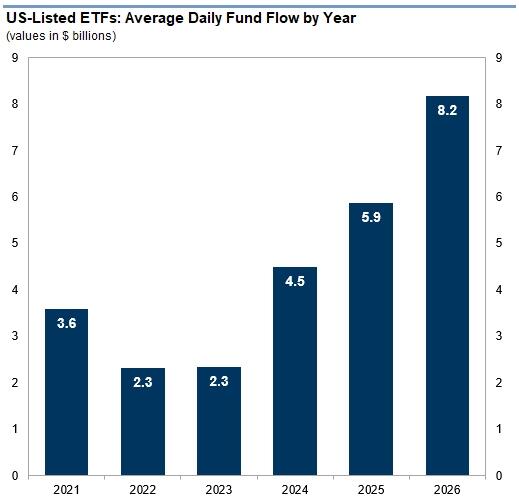
As top Goldman ETF trader, Chris Lucas, notes in his latest market color through three quarters, more than $1.5 trillion has already entered the complex, clearing last year’s record annual haul at a pace of roughly $167 billion a month and about $8 billion a session…
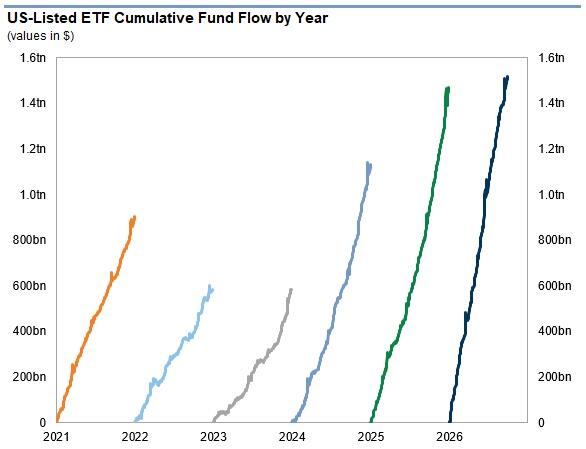
Goldman’s desk now looking for US ETF flows to top $2 trillion in 2026 once seasonal fourth-quarter tailwinds land.
We can break this down into the following:
- $1.5 trillion over 3 quarters,
- ~$167 billion/month,
- ~$8 billion/session
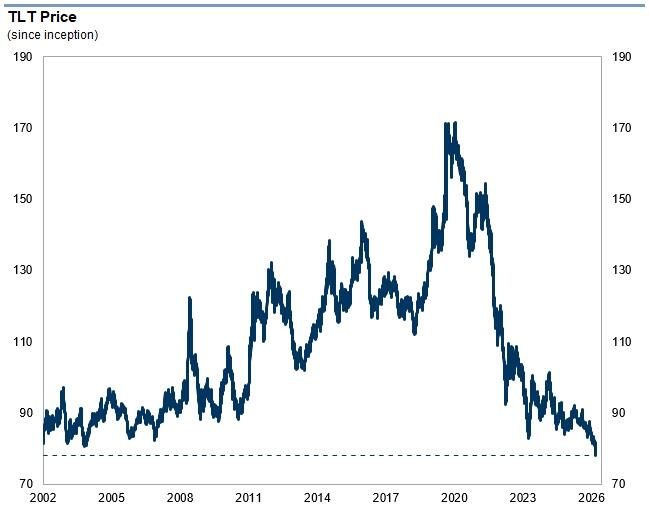
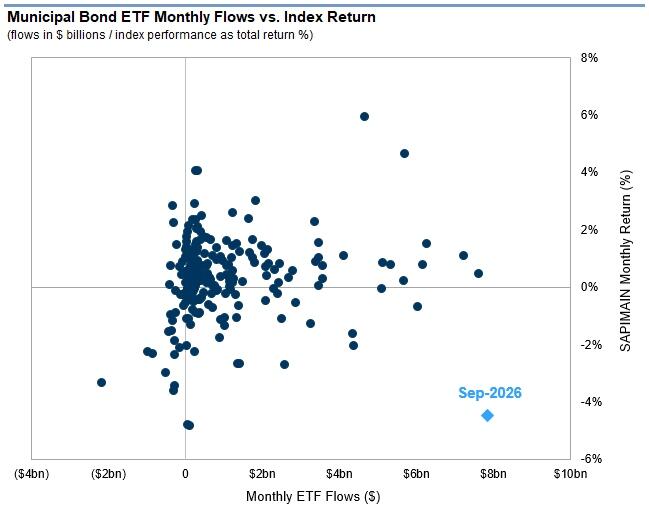
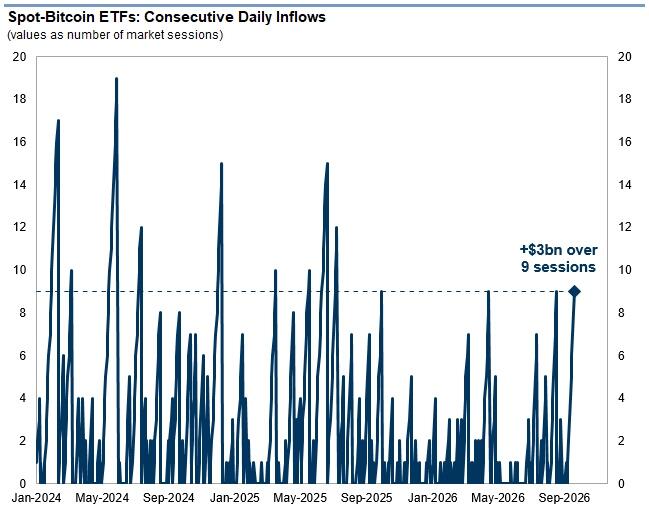
What makes the print striking is not just the size. The same wrapper is carrying mega-cap concentration, AI thematics, a 25-year low in TLT, one of the worst muni months in two decades, and the largest year-to-date nine-day haul in spot bitcoin ETFs illustrating what Lucas calls “the cross-asset firepower that ETFs offer.”
SPX is on track to outperform RTY for 7 straight weeks (longest streak since 2018), coupled with XLK outperforming SPX for 6 straight weeks…
Mega caps are providing much of the support, and demand in the market has recently sought conduits to concentrated exposures…
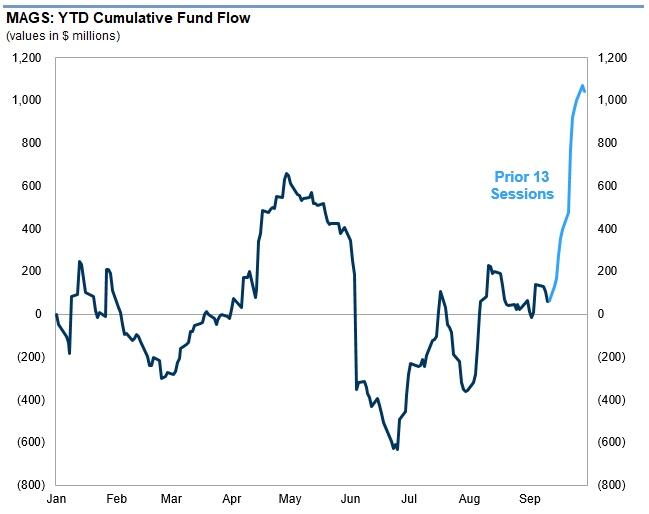
MAGS has garnered 12 inflows over the past 13 sessions, one of the fund’s longest stretches of recurring demand since the fund launched years ago…
…worth noting that RSP is on track for 7 consecutive weeks lower (which would tie its longest stretch), reaffirming the support at the top of the market cap spectrum.
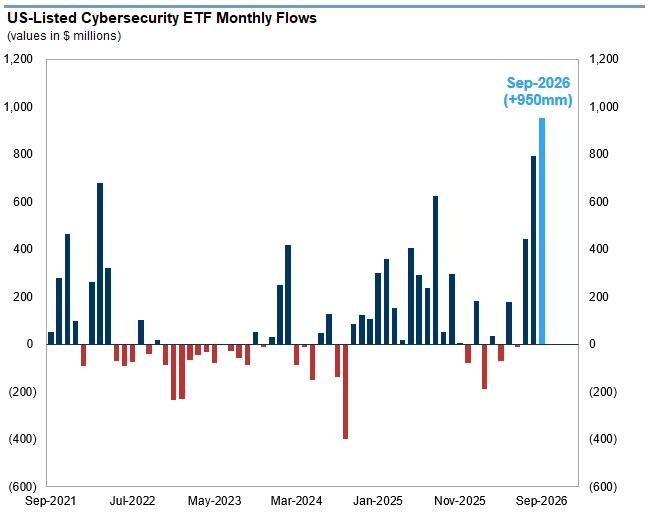
AI-fueled demand for cybersecurity exposure has the ETF complex on track for one of its best months of inflows in our dataset (+$950mm)…
In the fund’s near 25 years of operating history, TLT hit an all-time low this week… further, the fund is on track for losses over 7 consecutive sessions (its longest daily stretch lower in 2 years)…
Muni bond ETFs are collectively suffered one of their worst months of index performance in 20 years, yet inflows persist supported tax loss harvesting rotations…
Worth flagging the continuation of market demand for spot-bitcoin ETFs…
The complex has registered 9 consecutive days of inflows, totaling to more $3 billion collected (its largest 9-day haul YTD)…
The demand spans beyond the past two weeks, with over $6 billion pouring into the complex over the past two months…
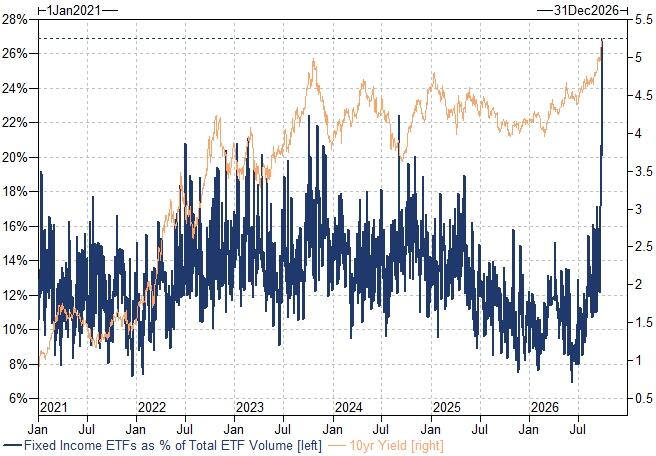
Finally, Lucas reminds readers of studies showing the relationship between ETF trading volumes and market volatility – as vol accelerates, so does ETF trading activity.
We’ve seen a similar relationship coincide with the recent ascent in rates.
As the 10yr pushed through 5% this month, fixed income ETFs have seen a rapid acceleration in trading volumes…
“Bond markets turns weird, and of course Jane is behind it all. First they mangled precious metals in Dec/Jan, now they are going after fixed income”
The through-line is that the ETF complex has become the cross-asset pressure valve. The $2 trillion year is the headline. The more interesting fact is that almost every part of the market is now expressing itself through the same vehicle.