

Det amerikanske aktiemarked ser umiddelbart stærkt ud med S&P 500 tæt på rekordniveau, men under overfladen er markedet blevet usædvanligt fragmenteret. Hovedpointen i en ny analyse fra Goldmans derivatstrateg Brian Garrett er, at S&P 500 ikke længere fungerer som markedets normale temperaturmåler. Indekset drives i stigende grad af ganske få AI- og teknologiselskaber, mens renter, kredit, olie, small caps og store dele af det øvrige aktiemarked fortæller en langt mere bekymrende historie.
Et ekstremt eksempel er, at korrelationen mellem det almindelige markedsværdivægtede S&P 500 og det ligevægtede indeks med præcis de samme 500 aktier er faldet til omkring 0,60-0,63. Det er mere end fire standardafvigelser under det historiske gennemsnit på 0,93. Det betyder i praksis, at udviklingen i selve S&P 500 i stadig mindre grad fortæller, hvordan den typiske amerikanske aktie faktisk klarer sig. Indsat tekst
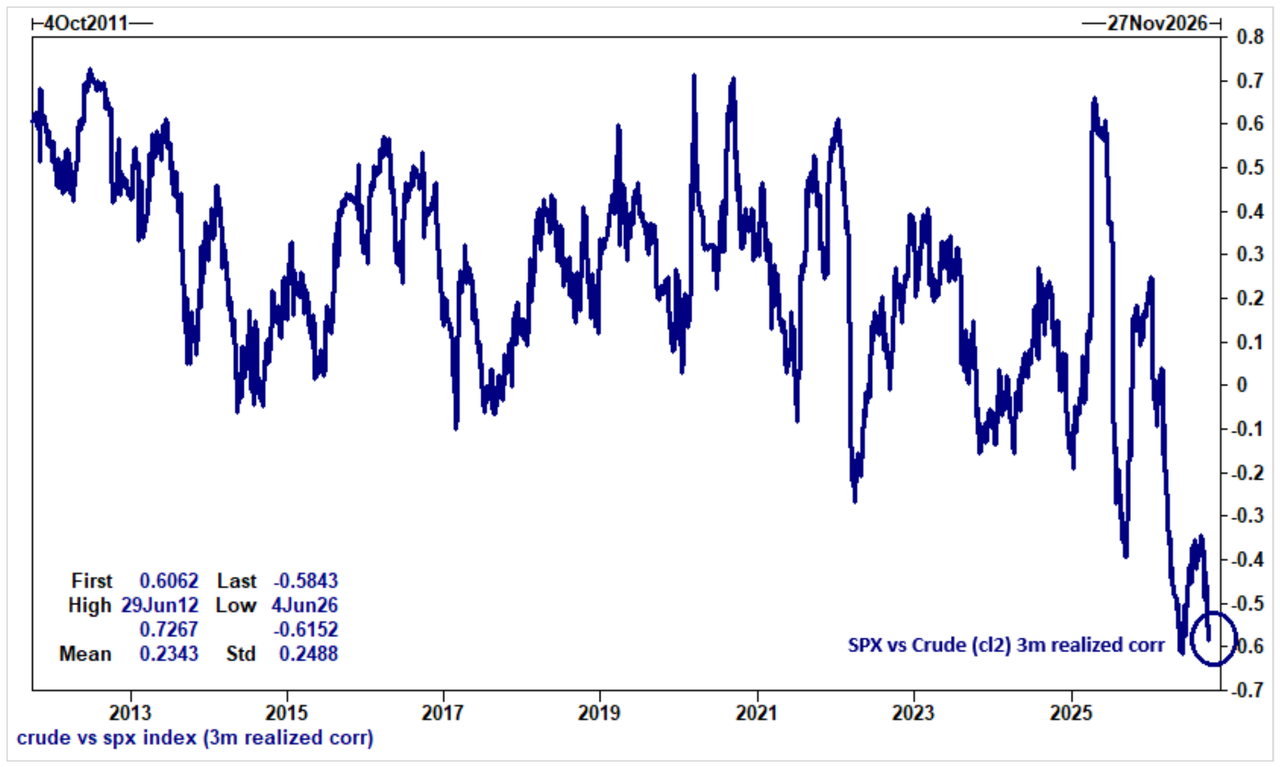
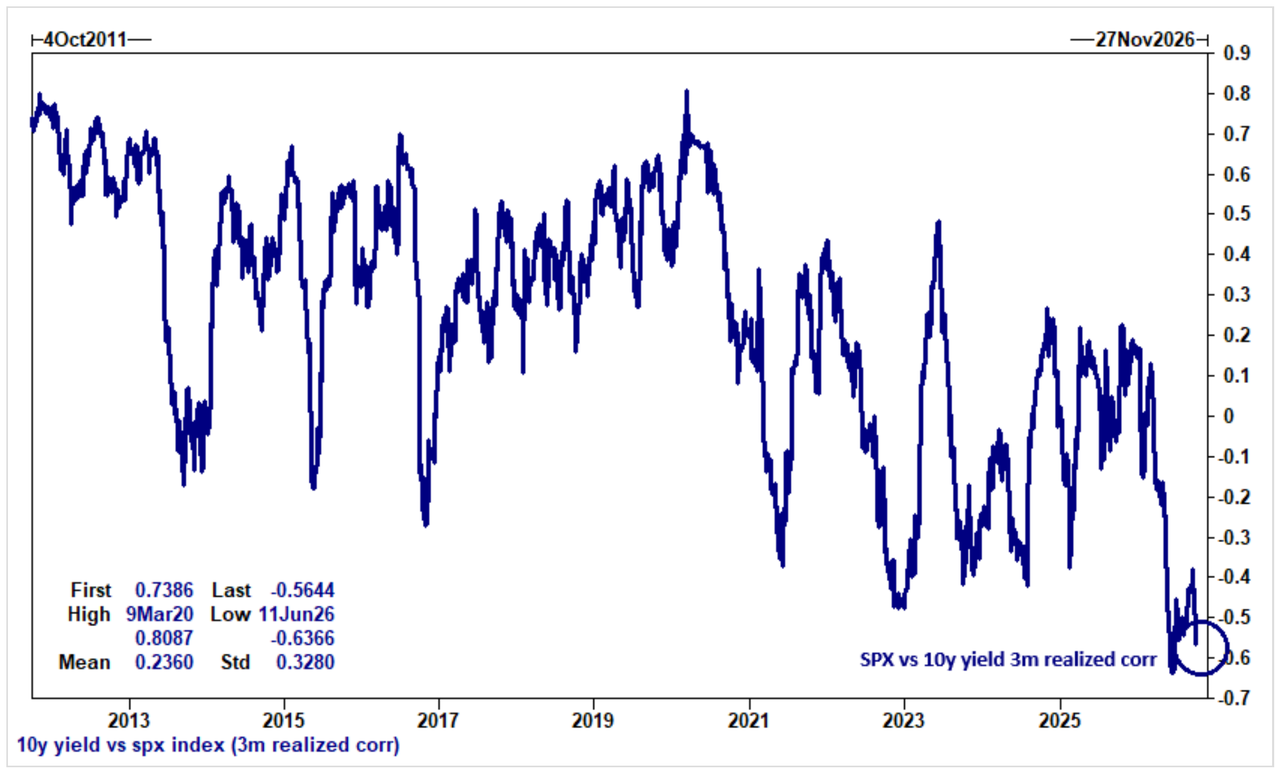
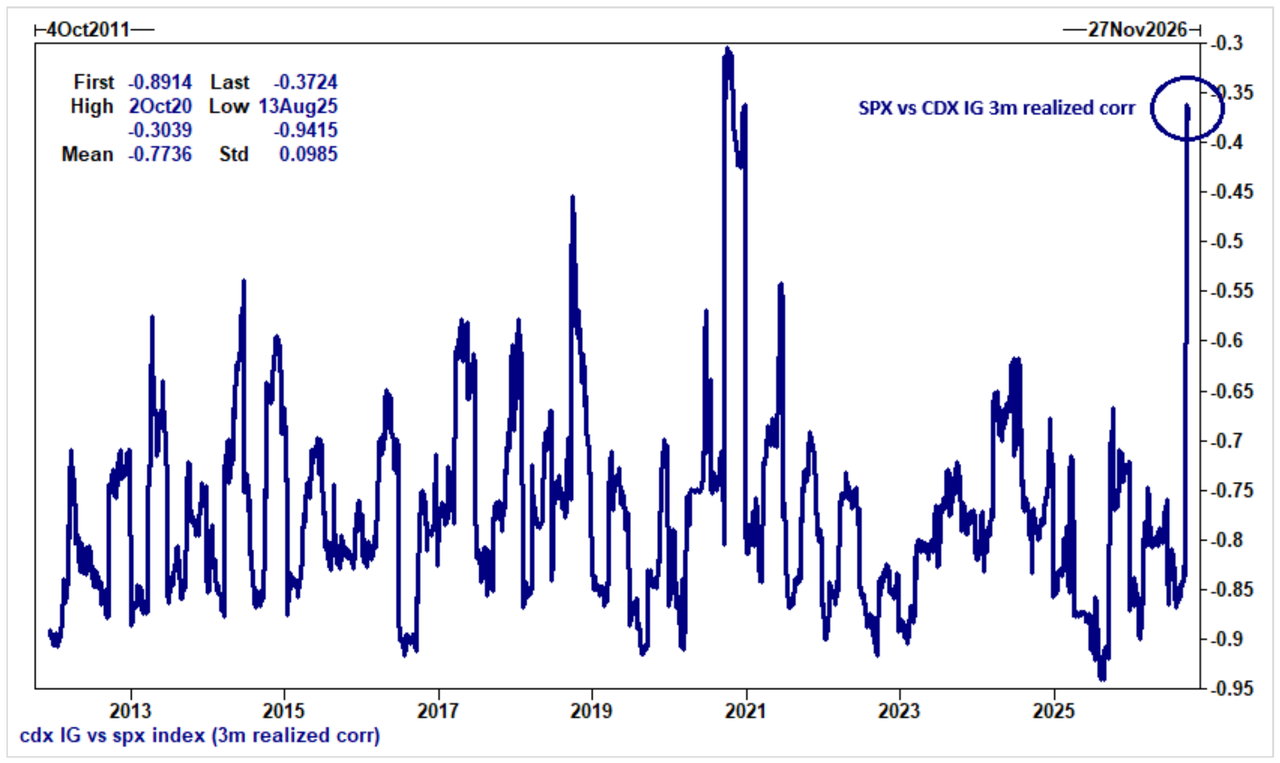
Samtidig er de traditionelle sammenhænge mellem aktier og makroøkonomien brudt sammen. S&P’s korrelation med olie er faldet til minus 0,58 mod historisk plus 0,23, mens korrelationen med den tiårige amerikanske rente ligger på minus 0,56 mod normalt plus 0,24. Også sammenhængen med kreditmarkedet er blevet markant svagere. Indsat tekst
Den skarpeste advarsel ligger i markedsbredden. Mens S&P 500 befinder sig tæt på rekord, er langt flere aktier på vej ned end op. Goldman peger på, at antallet af S&P-aktier, der rammer nye 52-ugers højder minus nye lavpunkter, er faldet til omkring minus 25 – det svageste niveau i halvandet år. Bank of Americas Michael Hartnett konstaterer samtidig, at omkring 400 S&P-aktier handler under deres 50-dages glidende gennemsnit og omkring 300 under deres 200-dages gennemsnit. Indsat tekst
Forklaringen er først og fremmest AI kontra resten af markedet. Garrett beskriver S&P 500 som en næsten selvstændig aktivklasse, hvor udviklingen i stadig højere grad bestemmes af AI-vinderne. Mens S&P holder sig tæt på toppen, er et S&P-indeks eksklusive AI-aktier faldet omkring syv procent siden toppen i slutningen af august og har dermed opgivet hele sommerens kursstigning. Indsat tekst
Der er dog også en fundamental forklaring på koncentrationen: De ti aktier, som forventes at bidrage mest til indtjeningsvæksten, ventes tilsammen at stå for mere end to tredjedele af hele S&P 500’s indtjeningsvækst i den kommende regnskabssæson. Indekset er altså koncentreret, fordi indtjeningsvæksten også er koncentreret. Problemet opstår, hvis markedets meget få vækstmotorer samtidig mister momentum. Indsat tekst
Investorerne reagerer allerede. Hedgefonde har i september købt teknologi-, medie- og teleaktier, mens stort set alle andre sektorer netto er blevet solgt. Samtidig ligger hedgefondenes nettoeksponering tæt på et femårigt lavpunkt, og shortpositionerne i Russell 2000-futures er rekordstore. Handlen med optioner på kredit- og obligations-ETF’er som HYG, LQD og TLT er mere end fordoblet på blot tre uger. Indsat tekst Indsat tekst
Goldmans centrale pointe er derfor, at den lave VIX og det stærke S&P 500 kan give investorerne en falsk følelse af sikkerhed. Hvis indeksudviklingen ikke længere afspejler de risici, der findes i porteføljen, fungerer traditionelle S&P-putoptioner heller ikke nødvendigvis som den bedste forsikring. Garrett anbefaler derfor at sprede hedging til blandt andet small caps, kredit, statsobligationer og individuelle aktier frem for alene at købe billig beskyttelse på S&P 500. Indsat tekst
Det amerikanske aktiemarked ser roligt ud på indeksniveau, netop samtidig med at en række underliggende markeder sender stadig stærkere faresignaler. Så længe AI-giganterne fortsætter op, kan denne opsplitning bestå. Men Goldman advarer indirekte om, at hvis der kommer en begivenhed, som igen får korrelationerne til at gå mod én – hvor stort set alt sælges samtidig – kan faldet blive desto mere voldsomt, fordi S&P 500 indtil nu næsten ikke har priset den uro ind, som allerede er tydelig andre steder i markedet. Indsat tekst
Uddrag fra Goldman og Zerohedge
For most of modern market history, the S&P 500 did one job: it was the place where every other risk – rates, oil, credit, the consumer – eventually got priced. But according to Goldman’s top derivatives trader, it has quietly quit that job.
“This week made it even more clear that SPX spot is no longer behaving like the clearing price for risk,” Goldman derivatives guru Brian Garrett, writes in his latest Weekend Prep note (available to pro subs here), adding that correlations “across almost everything have broken down” vs the S&P, which “seems to be increasingly correlated with almost nothing but itself” – and even then, he notes, “it’s a stretch eq weight vs mkt cap.”
Correlated With Nothing (Not Even Itself)
Start with that last point, because it is the most absurd one. The 3-month realized correlation between the cap-weighted S&P and its own equal-weight version – i.e., the same 500 stocks – hit 0.598 on Sept 22, the lowest reading in the 15-year series, more than four standard deviations below the 0.93 average. It was still just 0.63 as of Friday.
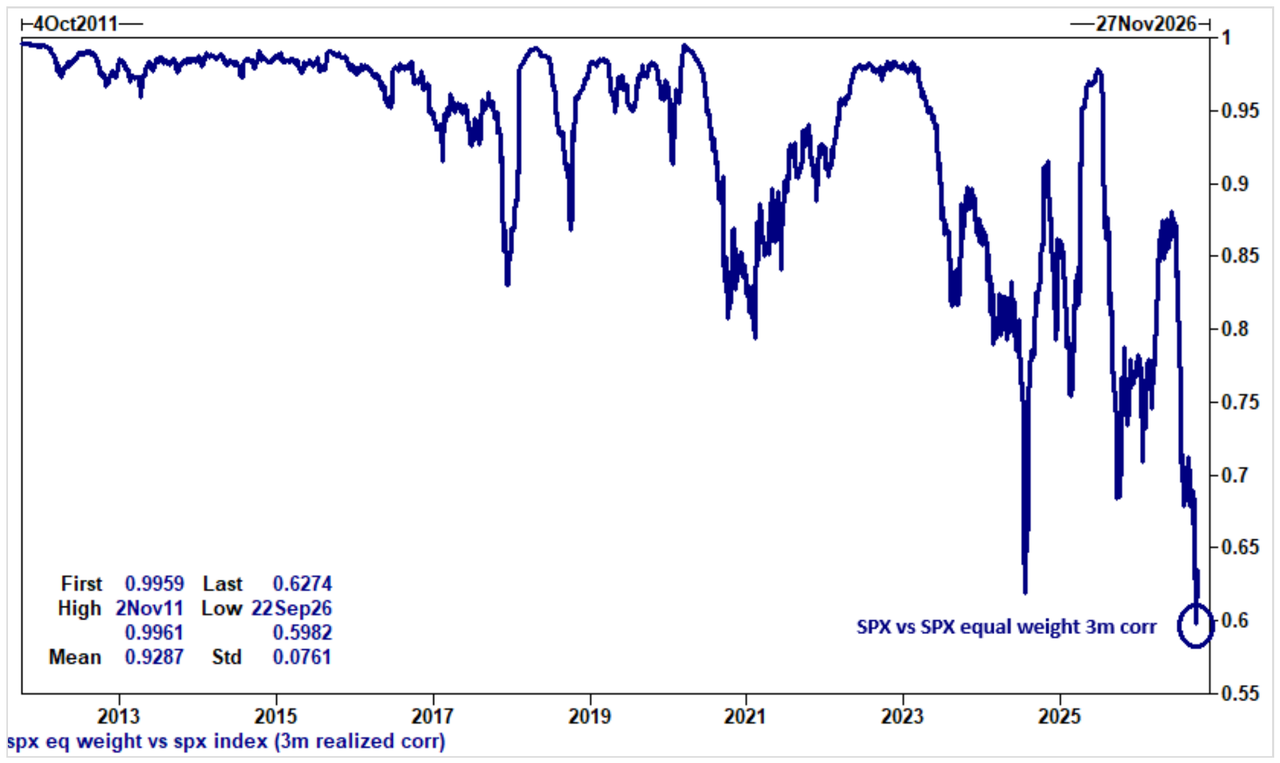
Put differently, knowing what “the market” did tells you less and less about what the average stock in the market did. Which, as regular readers know, we have been flagging since August, when Goldman found the lowest and most negative correlation on record between its Broad AI basket and the S&P ex-AI:
And it’s not just the index vs itself. Garrett’s cross-asset correlation charts tell the same story, asset by asset:
- Crude: the S&P’s 3m realized correlation with oil (CL2) is -0.58, a hair off June’s record low of -0.62, vs a 15-year average of +0.23.
- Rates: correlation with the 10Y yield is -0.56 (record low -0.64 in June), vs a +0.24 average.
- Credit: the S&P vs CDX IG correlation, normally a reliable -0.77, has collapsed to -0.37 – near the least negative in the series and a level last seen around the 2020 Covid whiplash.
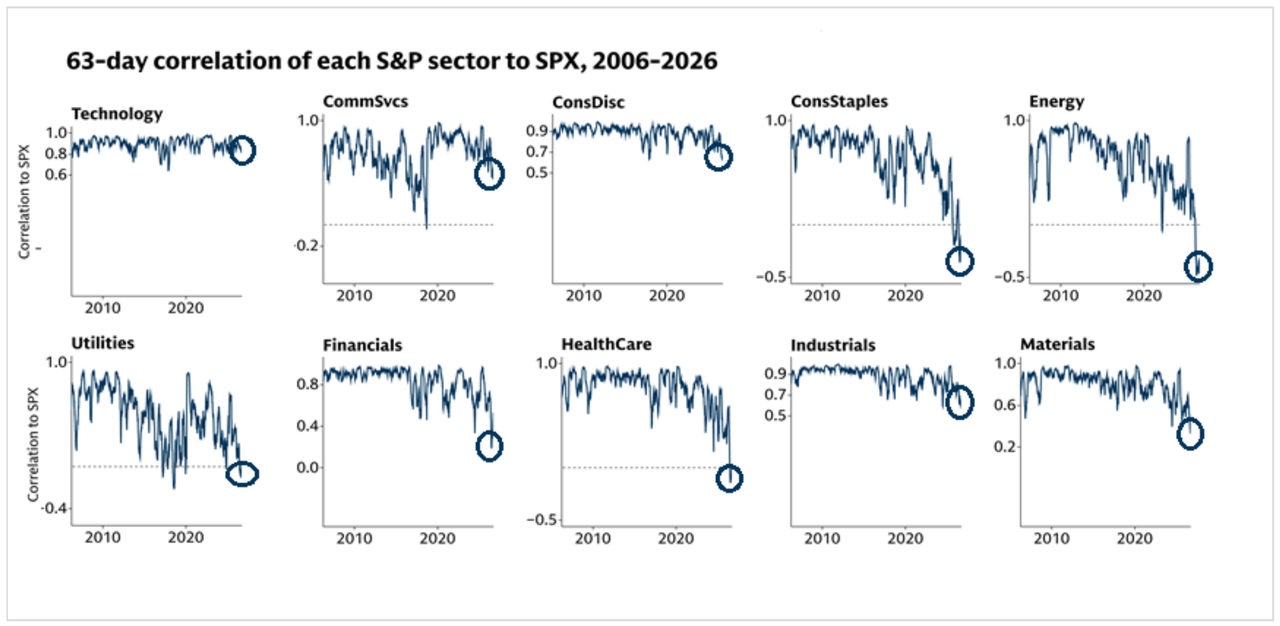
Meanwhile, under the hood, the sectors themselves have stopped moving with the index: the 63-day correlations of Staples, Energy, Utilities and Health Care to the S&P have all broken down to around zero or below – and in the case of Staples and Energy, to the most negative readings in two decades of data.
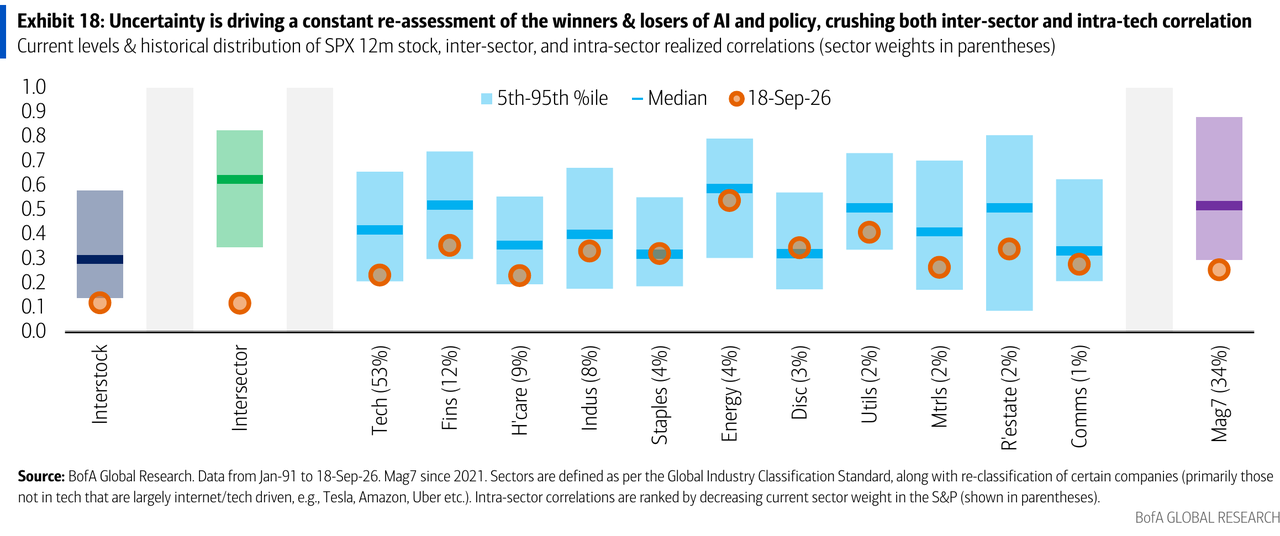
Goldman isn’t alone in noticing. BofA’s equity derivatives team wrote last month (in a note titled, appropriately, “BTDD = buy the dispersion dip“) that uncertainty “is driving a constant re-assessment of the winners & losers of AI and policy, crushing both inter-sector and intra-tech correlation.” Their chart shows 12-month interstock and inter-sector correlations both sitting at roughly 0.1, below the 5th percentile of their histories going back to 1991.
Everyone Is Telling A Different Story
The problem, in Garrett’s telling, is that every other market is screaming while the S&P hums:
“bonds are telling a different story … rates are telling a different story (“the equity market is trading the fed, the bond market is trading the regime”) … oil is telling a different story … sentiment is telling a different story (consumer sentiment at all-time lows) … all while spx implied vol trades in low double digits”
His credit and rates colleagues, he adds, “continue to signal high anxiety while spx chops in 20bps increments and vix grinds to levels normally saved for december holidays“, which is something we discussed earlier in “Conviction Collapse: Hedge Fund Leverage Hits “Liberation Day” Lows As Everything But The VIX Screams Fear”
The numbers back him up: JPMorgan’s Market Intel desk noted last Monday that the 10Y yield was up 41bps month-to-date (it’s higher now) as bond vol spiked, even as the S&P closed the week ~55bps from all-time highs and the NDX made a new one. Small caps and the equal-weight S&P, meanwhile, were both on multi-week losing streaks.
This is the same disconnect Garrett flagged a week ago, in “Not Seen Since 2000…”: Top Goldman Derivs Trader Says Equities ‘Refuse To Price Any Panic’ (Sep 27):
Breadth – or lack thereof – is where it shows most clearly. The 5-day average of S&P members making 52-week highs minus 52-week lows has collapsed to roughly -25, the worst in the 18 months shown, with the index itself within spitting distance of its record. We covered the same phenomenon last Monday in Record Highs, Record Angst: Goldman Tech Desk Finds Median Stock 16% Underwater As Breadth Craters To Dot Com Lows.
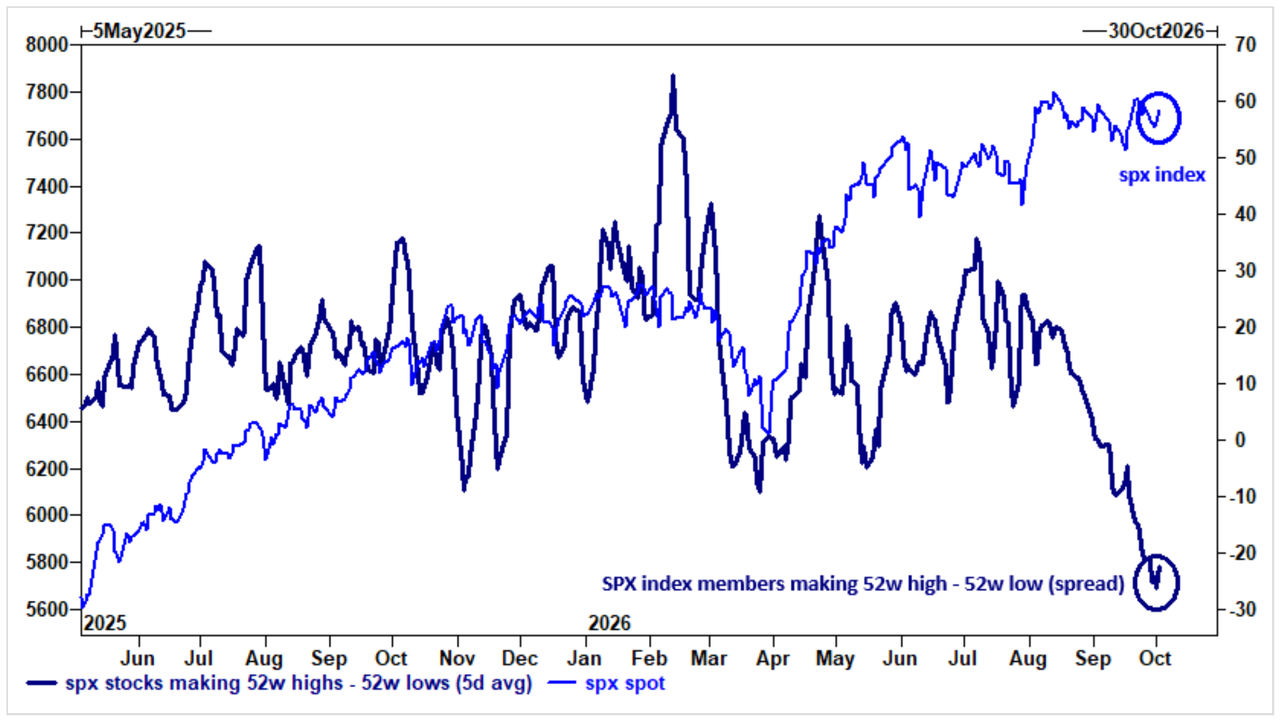
BofA’s Michael Hartnett, for his part, put it more memorably in this week’s Flow Show: with 400 S&P stocks trading below their 50dma and 300 below their 200dma, the market is trading “long artificial intelligence” (NDX), “short artificial irrelevance” (SPW).
Even retail is catching on: Garrett points out that this weekend’s Barron’s cover story is about a “scary” divided stock market, citing both max dispersion and low breadth. The Stock Trader’s Almanac suggests this isn’t a harbinger of immediate P&L destruction, Garrett writes, “but conversations in the trenches coupled with net positioning levels suggest otherwise.” (When the Barron’s cover and the Goldman desk agree, at least one of them is usually late.)
AI vs. Non-AI: The Only Factor That Matters
So what is driving the S&P? According to Garrett, the index now behaves like “a self-contained asset class – driven less by traditional macro transmission and more by narrow set of forces dominating index returns (‘ai vs non-ai‘) … wreaking max frustration for the aggressive investor community.”
The single chart that sums it up, and which Garrett calls “one of the highlights from the week”: the S&P (dark line) is pinned near its highs while the S&P excluding AI stocks (SPXXAI) has fallen roughly 7% from its late-August peak, giving back its entire summer rally.
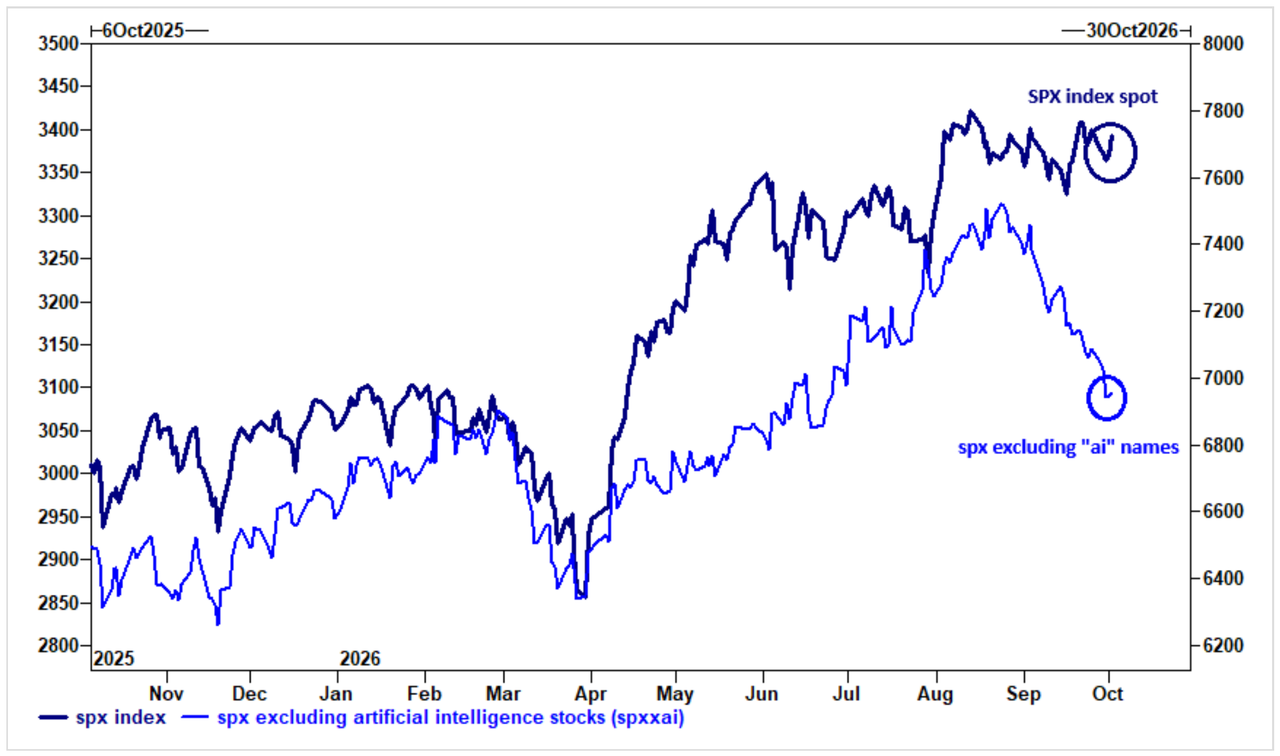
Garrett is careful to note that “if you just follow the earnings, an outlier doesn’t mean its wrong.” This reporting season, “the top 10 contributing stocks are expected to account for over two-thirds of aggregate s&p 500 earnings growth.” In other words, the index is narrow because earnings are narrow. That is comforting right up until those ten stocks have a bad day.
The positioning data shows the money chasing it. Goldman Prime’s September summary had a one-liner that, in Garrett’s words, “jives perfectly with what’s going on at the index level”: “hedgefunds rotated into tmt stocks in September, while [basically] every other sector was net sold.” His translation: “if your other stocks refuse to work, the AI / tmt momentum train is garnering additional passengers.” The NDX made a new all-time high this week (“not a typo”), and the cash desk saw renewed long-only demand for semis, with MU (earnings) and NVDA (buyback) the highlights.
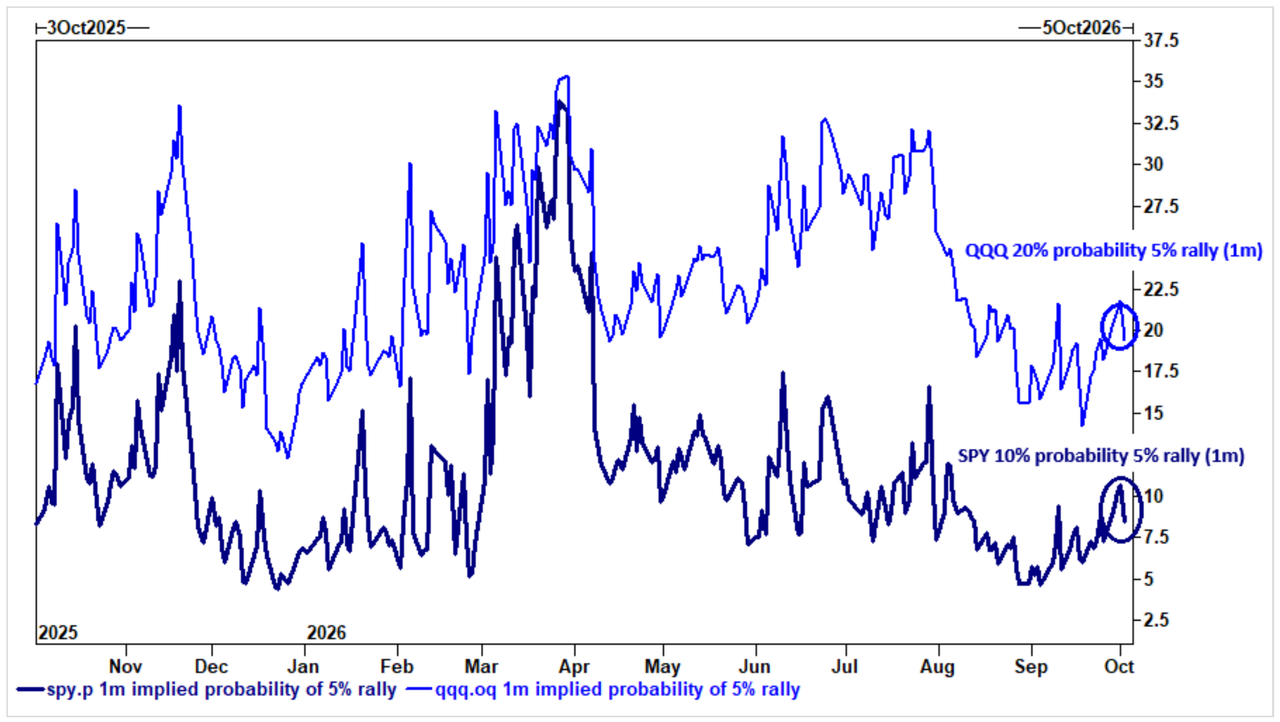
On the derivatives side, the desk likes owning upside in NDX/QQQ “to get upside exposure in tech (aka, the only things working),” including knock-out calls and QQQ>IWM outperformance trades. The market-implied probability of a 5% QQQ rally in a month (~20%) is twice that of SPX (~10%). Garrett’s verdict: “can’t beat them, join them.”
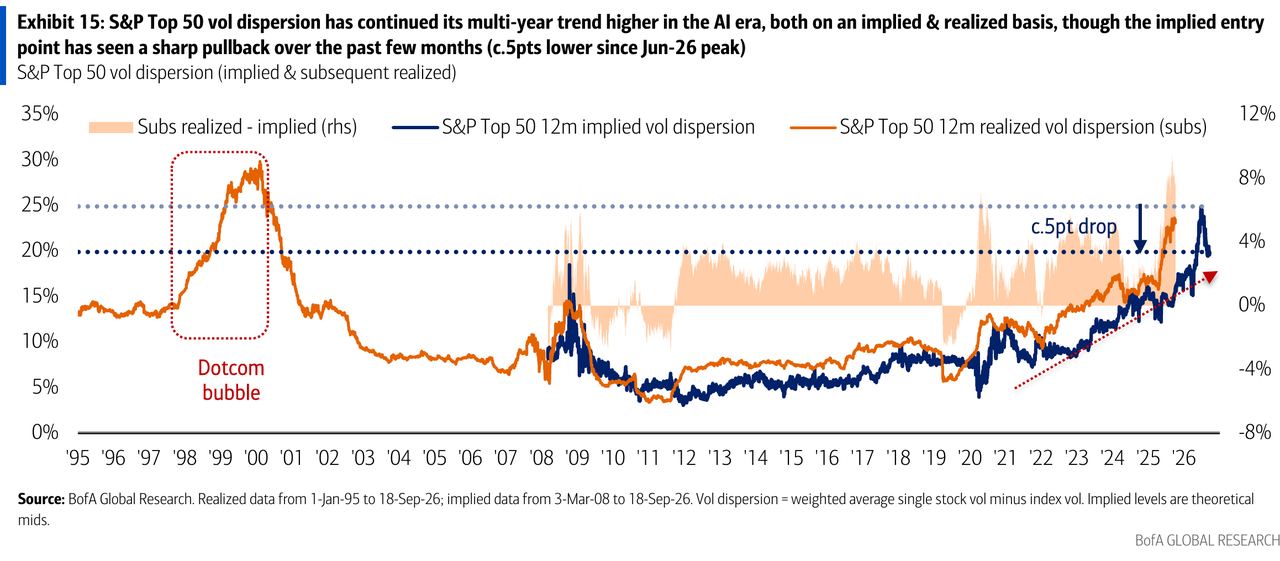
BofA sees the same backdrop as fuel for dispersion trades. Its derivatives strategists note that S&P Top 50 vol dispersion “has continued its multi-year trend higher in the AI era,” with the entry point now above GFC peaks, and argue “the Dotcom bubble analogue suggests further room higher from here, with the potential to even exceed late 90s peaks given valuations in the core of AI are not as stretched yet.” Nothing says “healthy market” like a Dotcom analogue used as the bull case.
Elsewhere on the Street, Nomura’s head of flow equity-derivatives sales Alex Kosoglyadov told Hedgeweek that “agentic AI winner-and-loser” trades have become a particular focus for clients.
Waiting For Corr-1
The obvious question is what snaps the market back together. Garrett’s answer is the one everybody is waiting for, and the problem with it:
“market participants are waiting for a corr-1 event to force these relationships back into order, but the problem with waiting for a 4+ sigma occurrence is that it, by definition, is quite infrequent“
Not that the warnings have been in short supply. Garrett himself warned last month that history doesn’t like correlation this low:
Two days later, on Sept 9, BTIG’s Jonathan Krinsky said the quiet part loudly: “We continue to think a correlation one downside event is brewing”. Yet nearly a month later, no corr-1 event has arrived, and the index keeps chopping while everything around it moves. Hence the “max frustration.”
The positioning snapshot from Garrett’s top 7 bullets:
- Hedge fund net leverage for fundamental L/S is down three weeks in a row, the lowest since Liberation Day and approaching a 5-year nadir. But “the ‘lack of net’ should not be confused with ‘complacent’ as gross exposure is high and investors are fully cognizant of the known unknowns.”
- Small caps: “gs estimates systematic exposure is in 7th percentile and leveraged funds are carrying record short exposure” in Russell 2000 futures.
- FICC ETF options: volume in options on HYG, LQD, TLT and IEF “has more than doubled” in three weeks. “As stock indices decouple from the macro, traders are using the liquid equivalent in ETF universe to express a view,” and Goldman trading is “both active and aggressive here.”
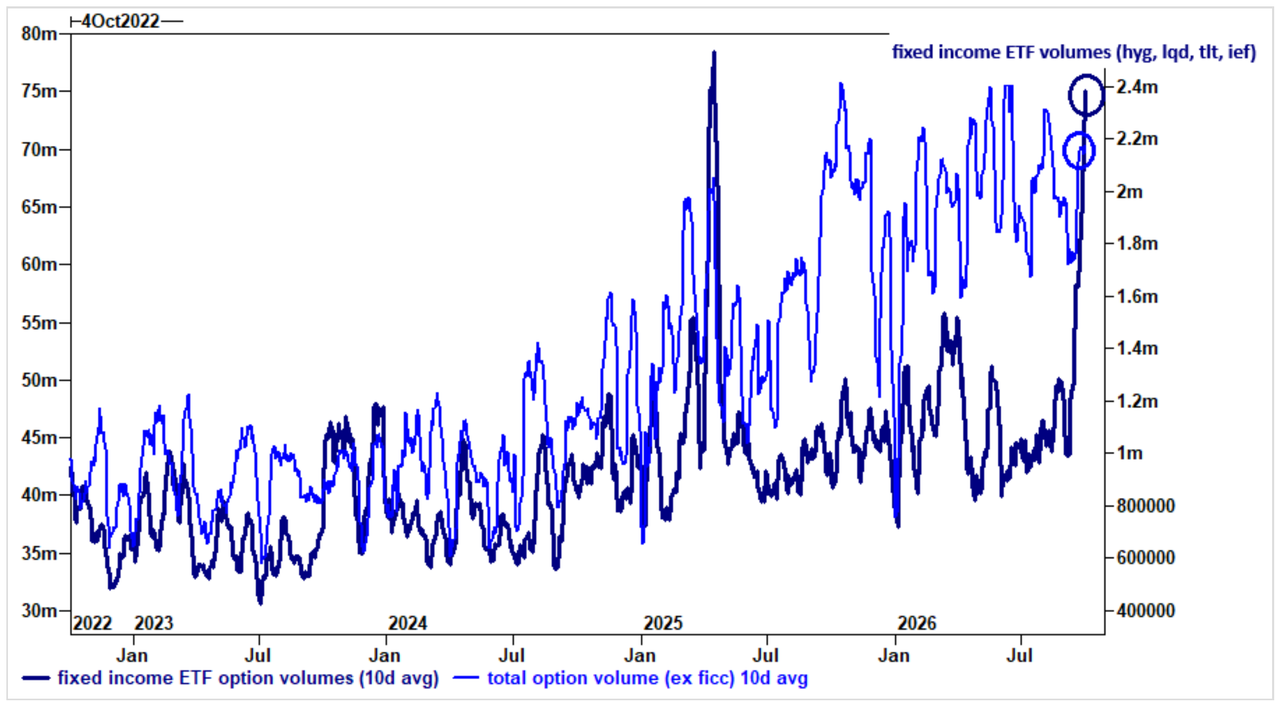
That last chart fits with what Goldman’s FICC desk showed last week on exploding CDS trading (Sep 28) and with the long end, which Goldman described as “still totally bidless” (Oct 1). If you want to trade the macro, these days you go where the macro still trades.
The Hedge Menu: Stop Relying On “Cheap SPX”
Which brings us to Garrett’s main practical point. When the index no longer reflects the risk, an index hedge no longer hedges it:
“i think you need to broaden out from using solely ‘cheap spx’ to hedge the book – we’ve traded a lot of iwm downside, a lot of HYG and TLT convexity, and a lot of single stock protection over the last week (upside and downside)”
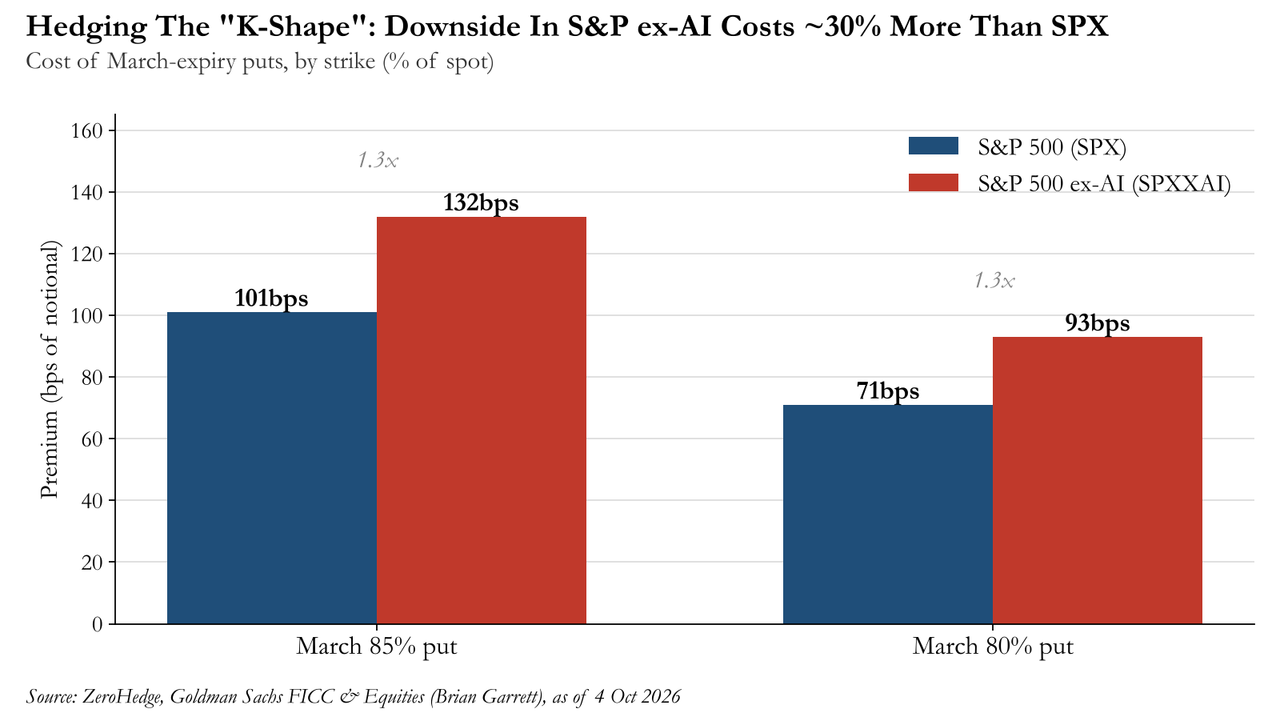
His vanilla idea: if the “K-shape” economy continues to bleed into a “K-shape” market, buy wing downside in the S&P ex-AI. The SPXXAI March 85% put costs 132bps (vs 101bps for the SPX equivalent), and the March 80% put costs 93bps (vs 71bps). That’s roughly a 30% premium for protection on the part of the market that’s actually falling, which seems a fair price for hedging the risk you actually have.
For those with a bit more appetite for exotics, Garrett has two “light exo” trades:
- Hedge the small-cap squeeze: with Russell short exposure via futures extreme, “an aggressive move lower in yields could create a squeeze.” The hedge is a dual digital (yields lower, small caps higher): 3-month expiry, IWM >108% and 10ySOFR <35bps, for a 10:1 payout.
- Stocks and oil down together: “another light exo trade that’s cheap compared to itself, is spx lower, crude lower (trades in 6th pctl on 2y lookback).” Adding a USO-lower contingency significantly cheapens the SPX digital: 3m SPX <96% and USO <90% costs 6.1% (16:1 payout). Given that the S&P-crude correlation sits near record negative, the market is pricing the joint move as a long shot. That’s exactly what makes it cheap.
On baskets, the desk keeps pitching its consumer inertia basket (GSXUSWCH) and single-stock hedging suite, plus upside on high-beta stocks on a sector/industry-neutral basis (GSPUBETA). And, music to our ears, “power up america is back” (GSX1POW1). Readers who saw Goldman’s call that behind-the-meter generation will power 25% of all data centers by 2030 (Sep 27) won’t be surprised.
Bonus: “TailGPT”
Finally, the most fun part of the note. Garrett calls the desk’s new weekly “tail book” “one of the most useful weekly 1 pagers now externally available … in 2026 parlance, akin to ‘tailGPT‘.” The prompt he gave the desk:
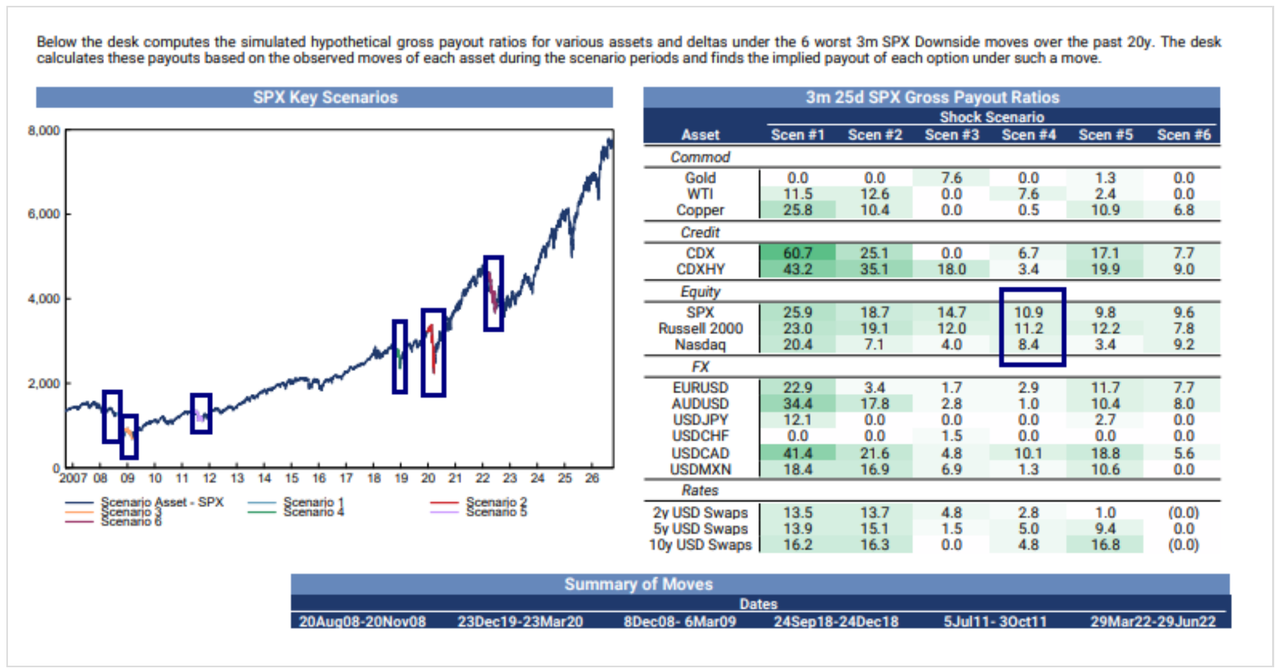
“take the most significant 3 month risk-off periods across the largest markets over the last 20 years (spx, cdx, rates, fx, etc) … pull the historical spot level changes across every major asset class during those periods… then assume one was to go long the 3m 50delta, 3m 25delta, or 3m 10delta option for each of those periods at current prices… then calculate the net multiple on premium using the observed historical spot moves vs today’s cost of convexity”
The answer: “no problem, bg.”
The output below shows hypothetical gross payouts on 3m 25-delta options across commodities, credit, equities, FX and rates, applying the moves from the six worst 3-month S&P drawdowns of the past 20 years at today’s prices. A GFC-style replay (Aug–Nov 2008) would have paid 60.7x on CDX IG protection and 41.4x on USDCAD, vs 25.9x on SPX itself. In the scenario the desk boxed, the Q4 2018 selloff (Sept–Dec 2018), Russell 2000 puts would have paid 11.2x, slightly more than SPX (10.9x). That fits with Garrett’s IWM downside call.